Role of the Interplay Between the Internal and External Conditions in Invasive Behavior of Tumors
Abstract
Tumor growth, which plays a central role in cancer evolution, depends on both the internal features of the cells, such as their ability for unlimited duplication, and the external conditions, e.g., supply of nutrients, as well as the dynamic interactions between the two. A stem cell theory of cancer has recently been developed that suggests the existence of a subpopulation of self-renewing tumor cells which is responsible for tumorigenesis, and is able to initiate metastatic spreading. The question of abundance of the cancer stem cells (CSCs) and its relation to tumor malignancy has, however, remained an unsolved problem and has been a subject of recent debates. In this paper we propose a novel model beyond the standard stochastic models of tumor development, in order to explore the effect of the density of the CSCs and oxygen on the tumor’s invasive behavior. The model identifies natural selection as the underlying process for complex morphology of tumors, which has been observed experimentally, and indicates that their invasive behavior depends on both the number of the CSCs and the oxygen density in the microenvironment. The interplay between the external and internal conditions may pave the way for a new cancer therapy.
I Introduction
Cancer usually begins with out-of-order duplication of a single cell that has stem cell-like behavior, referred to as the cancer stem cell (CSC) Reya et al. (2001). Based on the CSC hypothesis, a CSC can duplicate unlimitedly and differentiateBeck and Blanpain (2013). The classical CSC hypothesis proposes that, among all cancerous cells, only “a few” act as stem cells, but studies have reportedQuintana et al. (2008) that a relatively high proportion of the cells were tumorigenic, contradicting the general belief. The CSCs have been proposed as the driving force for tumorigenesis and the seeds for metastases Medema (2013). Their decisive role in maintaining capacity for malignant proliferation, invasion, metastasis, and tumor recurrence has been reported frequentlyLi and Li (2014). For example, CSCs of breast tumor are involved in spontaneous metastases in mouse modelsLiu et al. (2010). Also, CSCs promote the metastatic and invasive ability of melanomaLin et al. (2016) and their prsence is correlated with invasive behavior at colorectal adenocarcinomaChoi et al. (2009). The effect of number of CSCs on tumor morphology has been subject to some experimental studies and simulations. Based on simulationsEnderling et al. (2013); Sottoriva et al. (2010), the frequency of the CSCs smooths the morphology of tumor and based on experimental studyCastellón et al. (2012), the number of CSCs is higher in tumors with medium invasiveness (Gleason grade) than tumors with lower (Gleason grade) and higher (Gleason grade) invasiveness. However, the relation between tumor malignancy and the frequency of the CSCs needs more clarificationMedema (2013).
Cancerous cells use oxygen to produce metabolites for duplication and growthVaupel et al. (1989). Experimental in-vivoHöckel et al. (1996) and in-vitroCristini et al. (2005) studies, as well as computer simulationsAnderson et al. (2006); Anderson (2005), have reported that the density of oxygen regulates tumor morphology and its shortage drives morphological irregularities. Due to the apparent strong correlations between the tumors’ shape and their malignancy, fractal characterization of tumors has been used as a diagnostic assay for various types of tumorsBrú et al. (1998); Caldwell et al. (1990); Lee and Claridge (2005). However, there is still no explanation as to why cellular structures at the scale of tumors display self-similar characteristicsBaish and Jain (2000).
In this paper we propose a novel model to study the effect of the number of the CSCs and the oxygen’s density on the invasive behavior of general type of cancer. As we show below, the development of irregular shapes and respectively tumor’s invasive behavior is correlated with these two factors. Unlike the previous studies, we present a quantitative measure by which one understands better the effect of completion on the malignancy of tumors. We take the shape irregularity as the factor for identifying the invasive behavior of tumor and compare our results with experimental reports. The model that we present contains the essential features of the cells, such as symmetric/asymmetric division, metabolic state, cellular quiescence and movements, apoptosis, and existence of oxygen and its consumption. Our results explain, for the first time to our knowledge, the aforementioned experimentally-observed fractal behavior and contradict the predictions of recent models for the relation between the number of the CSCs and the growth rate and invasion. In addition, we believe that the results may cast doubt on the recent therapeutic approach based on oxygen deprivation.
Results
As the system evolves, the cells consume oxygen, enhance their metabolic state, and proliferate after reaching the energy level of , in order to create a clone —the tumor— see Figure1. The perimeter of this clone is the main object that we study in this paper.
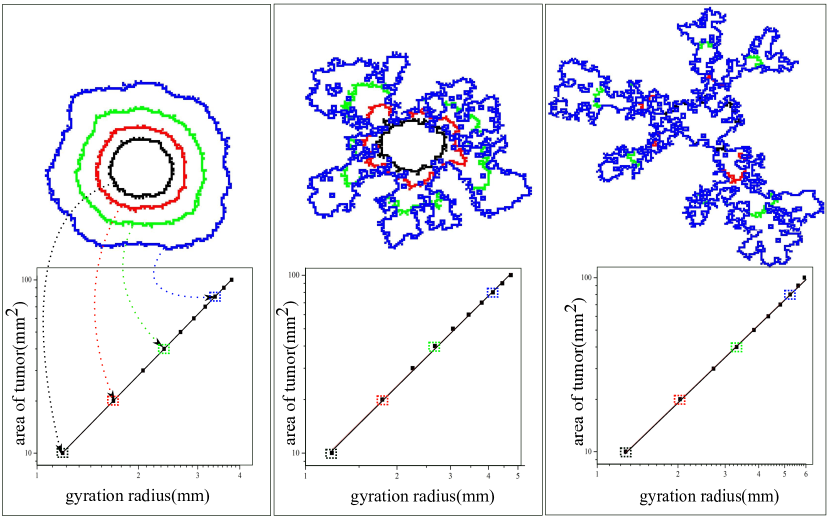
As Figure1 demonstrates, the cells take on irregular shapes during their growth whose complexity depends on the number of the CSCs (). One interesting approach is to study the structure of the borders in the context of interface instability Vasiev (2004); Vasiev et al. (1994); Vasieva et al. (1994). The analogy with the instability of interfaces has been established for the case of melanomaAmar et al. (2011) and the instabilities were attributed to nutrient density. But here, we are going to quantify tumor behavior through classifying irregular morphology of tumors. To quantify the irregularity of the tumor’s morphology and its evolution, we use fractal analysis. To this end, we measure the average distance from the center of the mass, as well as the area of the tumor during its growth. Figure1 indicates that versus is a linear plot so that, . Thus, the slope of the line in the logarithmic plot is the fractal dimension , implying self-similarity of the tumors of various sizes. The self-similarity of the tumors’ growth is the result of heterogeneous duplication on their perimeter, which itself is due to the oxygen gradient. Cells in the region with higher curvatures have better supply of oxygen, helping them increase their metabolic state and proliferate faster. The proliferation also creates new perimeter curvatures with the same behavior. As the number of oxygen consumers, which is proportional to , increases the competition between the cells for the limited oxygen supply intensifies and oxygen availability becomes more heterogeneous. Thus, the tumors take on more irregular shapes or lower fractal dimension , contradicting the previous studies Sottoriva et al. (2010); Enderling et al. (2013) that proposed an adverse relation between the number of the CSCs and the invasive behavior.
We note that fractal scaling has been reported previously in the experimental studies Caldwell et al. (1990); Brú et al. (1998). Moreover, irregular shapes have been interpreted as an indication of invasive behavior of different tumorsBrú et al. (1998); Caldwell et al. (1990); Lee and Claridge (2005). Tumors with more irregular shapes are more invasive, and in our model the more irregular tumors have smaller . There are several reports that confirm the correlation between and tumor malignancy (a malignant tumor possesses a lower fractal dimension than that of a benign mass) Tambasco et al. (2010); Etehad Tavakol et al. (2010); Zook and Iftekharuddin (2005); Pérez et al. (2015).
A study of the variations of with and the density of the oxygen is useful to characterization of the tumor behavior. The computed for various values of and oxygen densities are shown in Figure 2.
Figure2 presents explicitly the value of and the corresponding malignancy of tumor as a result of both the internal feature and the external conditions. For a fixed density of oxygen, the invasive behavior of tumor always increases with , implying that, regardless of the environmental conditions, higher numbers of CSCs always lead to a more invasive behavior —see Figure2 in the Supplementary Information (SI). This result contradicts the existing result on adverse effect of on the tumor’s invasive behavior Sottoriva et al. (2010); Enderling et al. (2013). On the other hand, the effect of the environmental stress on invasion is regulated by internal feature of cells, . For , the oxygen deprivation significantly increases the malignant behavior of tumors, while for , the density of oxygen has negligible effect on tumor’s invasive behavior.
Relation to Superficial Spreading melanoma
As presented here, our model explains a two dimensional tumor growth. Early stages of Superficial Spreading melanoma has a two dimensional structure which might be a good option to apply our findings to. Experiments indicate that there is no blood flow to the SSMs with thickness less than 0.9 mm Srivastava et al. (1986). In addition, melanoma is, at least in its early stages, an approximately two-dimensional (2D) phenomenon and a 2D model properly mimics its structure. The malignant cells in the Superficial Spreading melanoma (SSM) stay within the original tissue - the epidermis - in an in-situ phase for a long time, which could be up to decades. Initially, the SSM grows horizontally on the skin surface, known as radial growth, with lesion indicated by a slowly-enlarging flat area of discolored skin. Then, part of the SSM becomes invasive, crossing the base membrane and entering the dermis, giving rise to a rapidly-growing nodular melanoma within the SSM that begins to proliferate more deeply within skin.
Discussion
The proposed model sheds new light on and provides new insight into the invasive behavior of tumors by deciphering the effect of both intrinsic and extrinsic features of cells. It also demonstrates that elimination of the oxygen in the previous models gives rise to such a relation. The fractal behavior that has been identified and then attributed to the growth limited to the perimeter, similar to surface growthBrú et al. (1998, 2003). Nevertheless, close inspection of the proliferation activity in the perimeter in the proposed model reveals larger parts of the cells as proliferative cells —see Figure1 of the Supplementary Information. As the model demonstrates, a single biological parameter, namely , changes the cell’s features and results collectively in various self-similar states with distinct fractal dimensions. Previous models, which considered the CSCs Sottoriva et al. (2010); Enderling et al. (2013), obtained an inverse relation between the number of the CSCs and invasion, but our model indicates increased malignancy to be proportional to larger numbers of the CSCs. Compared to experimental dataCastellón et al. (2012) our model confirms increasing of morphological irregularities (Gleason grade), but full consistency needs more biological details to be added to model.
Tumors with low number of the CSCs that were proposed by the previous studies Hermann et al. (2007); Enderling et al. (2013) did not respond to oxygen deprivation, as was expected Höckel et al. (1996); Cristini et al. (2005). Hence, tumors that respond to oxygen deprivation must have larger number of the CSCs.
In addition, models that do not consider the CSC evolution and endow the cells with unlimited proliferation capacity Cristini et al. (2005); Anderson et al. (2006), produce tumors corresponding to . Such models consider the effect of oxygen and, as our model confirms, oxygen deprivation leads to higher irregularities. As decreases, the effect of oxygen vanishes. Thus, a lower number of the CSCs, which was proposed previously Hermann et al. (2007); Enderling et al. (2013), does not conform to the experimentally well-established oxygen effects. Our model, in addition to reproducing such result, provides quantitative and comparable results to classify the irregularities that can be used to study experimental results that have been reported the fractal dimensions.
The conceptual results are applicable to the growth of other solid tumors which display the mentioned behavior in response to oxygen tension and frequency of cancer stem cells. For example, in the case of the SSM in which the number of CSCs is not small Girouard and Murphy (2011); Quintana et al. (2008) oxygen deprivation probably increases tumor malignancy. Contrary to the previous studies, the present model predicts invasion as the result of both the tumor and the microenvironment, demonstrating the effect of nutrient deprivation on the invasion. This implies that recent studies on such therapeutic approach Tang et al. (2016); Li et al. (2016) must consider carefully the side effects that, based on our model for tumors with larger numbers of the CSCs, can increase tumor malignancy.
The model
Similar to many other natural systems, biological media fluctuate due to the intrinsic randomness of the
individual events Hilfinger and
Paulsson (2011). Cells are involved in regulatory pathways that depend
highly nonlinearly on the chemical species that are present in low copy numbers per cell
Berg et al. (2000), as a result of which other factors, such as the forces between cells,
fluctuate significantly Trepat et al. (2009). Thus, statistical approaches are suitable for
simulating cells’ behavior. We consider the 2D lattice shown in
Figure3 in which each bond is 100 micrometer long, while each site has the capacity for 100
cancer cells which typically have 10 m diameterWang et al. (2011). The nutrient density is constant on the perimeter of a circle with a radius of 1 cm. It diffuses into the internal zones and is consumed by the living cells. In the
Supplementary Information we present the results of various other initial/boundary conditions for
the oxygen supply, including smaller and larger radii of the circle, regular and random distribution of
the oxygen source, as well as its uniform distribution in the medium, and show that the
predictions of the model do not depend on the choice of the oxygen supply mechanism. Though we considered two dimensional structure, a 3D structure for oxygen supply system (vessels and capillaries), the results remain qualitatively the same. The model can, however, be extended to 3D.
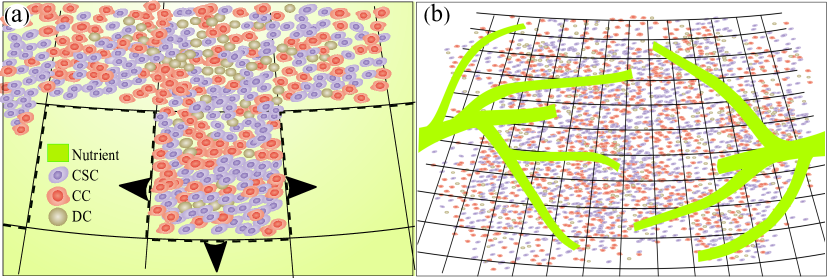
Keeping the oxygen density uniform in the milieu — mol/ml Anderson (2005)— a CSC is inserted at the center of medium that consumes the oxygen and enhances its metabolic state. Although metabolic pathways are not fully understood, metabolic activity is a crucial factor in a cell’s decision to either proliferate or die Buchakjian and Kornbluth (2010). In the former case a cell must increase its biomass and replicate its genome prior to division, in order to create two daughter cells. Thus, the cell must generate enough energy and acquire or synthesize biomolecules at a sufficient rate to meet the demands of proliferation Jones and Thompson (2009). Given such biological facts, we choose metabolic state as the decisive factor for a cell’s decision to proliferate, and define an internal energy for each cell as an indicator of its metabolic state. Physically, the cells acquire energy from the environment to accumulate internal energy Scalerandi and Sansone (2002)—the energy of the absorbed molecules— which evolves according to the energy conservation law:
| (1) |
where is the oxygen density at position and time , with and being positive constants related to energy accumulation and consumption rate (for details about all constants and their values see Table 1 in SI). If a cell’s energy reaches a threshold , it will begin duplication. We set , and such that every cell in the appropriate situation will be in the duplication state after 15 hours Haass et al. (2014), which is about the time that tumor cells need to reach the so-called cell checkpoints (early ), and in the cell cycle for division. is the primary point at which a cell must decide whether to divide. After it passes and enters the phase, the cell is committed to division Haass et al. (2014) (other checkpoints, such as at which the cell is mostly concerned with the condition of its DNA, still remain to be completed in the next step). As we show below, Eq. (1) together with the limits imposed reproduces cell plasticity and various proliferation activities under a variety of external conditions Meacham and Morrison (2013) that were reported recently Haass et al. (2014). Time is measured in units of 10 minutes.
The evolution of the internal energy of the cells depends on the local
density of oxygen through a set of coupled differential equations, and if enough oxygen exists at the
position of the first CSC, increases to and the first CSC duplicates into two
daughter cells. This relation between oxygen density, cell metabolic state and its duplication dynamics
ensures the apparent role of the oxygen density in the tumor evolution. One may consider various
scenarios for quantitative studies of the CSC proliferation
Shahriyari and
Komarova (2013); Dhawan et al. (2014); Tomasetti and Levy (2010); Cao et al. (2013), but the probability of
distinct kinds of divisions has yet to be assessed experimentally. Besides, some other
studies Yoo and Hatfield (2008) have proposed the cells’ self-renewal ability as the prerequisite for tumor
maintenance. Thus, we choose the simplest biologically-correct model that has the ability to generate
the entire possible range of the CSC population percentage, from zero up to the values produced by the
various mathematical Shahriyari and
Komarova (2013); Dhawan et al. (2014); Tomasetti and Levy (2010); Cao et al. (2013)
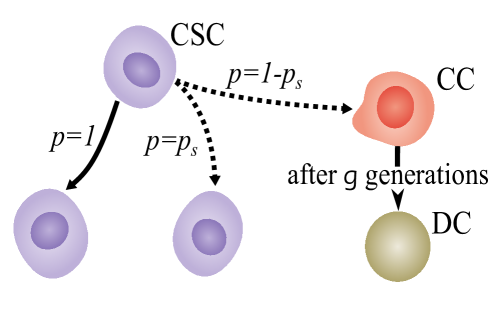
and biological models Yoo and Hatfield (2008). In this model, during duplication of each
CSC one daughter cell is assumed to be CSC and the second one is either a CSC with probability —the probability of symmetric duplication of the CSCs— or a cancerous cell (CC) with probability
—see Figure4. Each CC duplicates into two CCs if it is allowed to duplicate
Sottoriva et al. (2010). Such a probabilistic approach is motivated by a fact stated earlier, that
according to the classical CSC hypothesis, among all cancerous cells, only “a few” act as stem cells,
whereas some studiesQuintana et al. (2008); Gedye et al. (2016) have reported that the population of CSCs can be relatively high, which is why we take the population of the CSCs (the probability ) as
a parameter of our model. For the model reduces to the stochastic model of tumor development
Nowell (1976). Every CSC continues such a division for an unlimited frequency, but the CC can have
only limited generations of duplication Hayflick and Moorhead (1961), which we set it to be
Sottoriva et al. (2010); Reya et al. (2001) after which it will die and produce dead cells (DCs) —see Figure4. As the cells undergo apoptosis, they are recognized and removed from the body by phagocytes.
Thus, we assume that the dead cells remain inactive in the medium, but even if we eliminate them after
death, the main results remain the same; see the Figure S15 at SI.
We define the density of cells of type at location at time by,
| (2) |
with CSCs, CCs, and DCs. Equation (2) is also valid for the total
density of cells, . Recall also that the capacity of each site
is 100 cells Wang et al. (2011). The density of the CCs is denoted by in which indicates their generation that varies from 1 to (after
generations they produce the DCs). Healthy tissues contain healthy cells in which the distribution of the
nutrients is in a steady state. We eliminate the healthy cells for all the tumors, as our results are
based on comparison with and differences of tumors’ behavior that are the most important part of our
study.
Local density gradients drive the random motion of the cells Ambrosi and Preziosi (2002). Thus, one has,
| (3) |
where is the diffusion coefficient. Equation (3) is applicable to the various kinds of cells, for which Anderson (2005); Bray (2001) cm2/s. Population growth of biological groups depends on the species ability for proliferation and the environmental limitations. One important environmental limit is contact inhibition of cell division Martz and Steinberg (1972), i.e., if after the energy rises to the cells will duplicate, if there is space; otherwise, they will stay quiescent until they find space for duplicationMontel et al. (2011). Thus, proliferation at each site depends on the number of cells that can duplicate, and the effect of competition for space between all types of cells. The evolution of the CSCs that qualifies for the duplication metabolic threshold , is expressed by a diffusion-reaction equation,
where is the rate of passing the , and phases in the cell cycle, which is fixed as a cell that has enough internal energy (has passed the aforementioned , and phases) will duplicate in 5 hours Haass et al. (2014), if there were no other cells. The last term on the right side of Eq. (The model) that includes the term captures the effect of contact inhibition of proliferation in which is the total density of all cells at . The entire cell cycle takes 20 h. The evolution of the th generation of the CCs is governed by
| (5) |
where denotes the Kronecker delta, i.e., for and otherwise, with . The first term on the right side of Eq. (5) represents diffusion of the cells due to the local concentration gradient Ambrosi and Preziosi (2002); Anderson (2005); the second is the creation of the first generation of the CCS due to asymmetric duplication of the CSCs Sottoriva et al. (2010), while the third term represents the creation of the th generation (for ) of the CCs from duplication of the prior generation. The concentration of the CCs decreases due to duplication and creation of the next generation, which the th terms accounts for, while the last term accounts for the death of the final (th) generation of the CCs. is the rate of apoptosis —the process of programmed cell death— and is fixed as the th generation has a halflife equal to 1 day. Finally, the evolution of the oxygen density in the presence of the cells is governed by
with being proportional to oxygen consumption rate by the cells, which is the same for both the CCs and cancerous stem cells. We varied the rates of oxygen consumption for every kind of cells, but the essential results remained the same; see the SI. was fixed by setting the reported value for oxygen consumption Casciari et al. (1992); Anderson (2005) to be mol cell-1s-1. is the diffusion coefficient of oxygen in the medium, which we fixed it based on the calculations at room temperature, cm2/s. We present in the SI the results for other values of . For distances more than 1 cm from the medium’s center the oxygen density is constant (see the SI for the results for larger and smaller distances, as well as other ways of supplying the oxygen), and is equal to 0.15 mol/ml Anderson (2005). For simplicity, in all the calculations we normalize to 1. From outside of the aforementioned circle, oxygen penetrates into the central area. Given the assumptions, the cells are active elastic species, consuming oxygen and proliferating.
As we show in the SI, other boundary conditions do not change the essential results. In addition, (i) we also varied both the proliferation activity and oxygen consumption rate for various kinds of cells, but the results remained qualitatively the same. (ii) The CSCs and CCs are assumed to have equal oxygen consumption rates, but when we changed them for every kind of cell, the results were qualitatively the same. (iii) The CSCs and CCs are assumed to have the same internal energy threshold for duplication, and equal rates of crossing the , and phases in the cell cycle. But changing the proliferation activity of the cells did not change our main results. Let us also emphasize that our model is not the same as the classical models of diffusion-limited aggregation Gerlee and Anderson (2010), as such model did not deal with the effect of reaction and consumption.
Acknowledgements
A.A.S. would like to acknowledge supports from the Alexander von Humboldt Foundation, and partial financial supports from the research council of the University of Tehran. We also acknowledge the High Performance Computing center of the University of Tehran in its Department of Physics, where most of computations were carried out.
References
- Reya et al. (2001) T. Reya, S. J. Morrison, M. F. Clarke, and I. L. Weissman, nature 414, 105 (2001).
- Beck and Blanpain (2013) B. Beck and C. Blanpain, Nature Reviews Cancer 13, 727 (2013).
- Quintana et al. (2008) E. Quintana, M. Shackleton, M. S. Sabel, D. R. Fullen, T. M. Johnson, and S. J. Morrison, Nature 456, 593 (2008).
- Medema (2013) J. P. Medema, Nature cell biology 15, 338 (2013).
- Li and Li (2014) S. Li and Q. Li, International journal of oncology 44, 1806 (2014).
- Liu et al. (2010) H. Liu, M. R. Patel, J. A. Prescher, A. Patsialou, D. Qian, J. Lin, S. Wen, Y.-F. Chang, M. H. Bachmann, Y. Shimono, et al., Proceedings of the National Academy of Sciences 107, 18115 (2010).
- Lin et al. (2016) X. Lin, B. Sun, D. Zhu, X. Zhao, R. Sun, Y. Zhang, D. Zhang, X. Dong, Q. Gu, Y. Li, et al., Cancer science 107, 1079 (2016).
- Choi et al. (2009) D. Choi, H. W. Lee, K. Y. Hur, J. J. Kim, G.-S. Park, S.-H. Jang, Y. S. Song, K.-S. Jang, and S. S. Paik, World journal of gastroenterology: WJG 15, 2258 (2009).
- Enderling et al. (2013) H. Enderling, L. Hlatky, and P. Hahnfeldt, Breast 11, 200 (2013).
- Sottoriva et al. (2010) A. Sottoriva, J. J. Verhoeff, T. Borovski, S. K. McWeeney, L. Naumov, J. P. Medema, P. M. Sloot, and L. Vermeulen, Cancer research 70, 46 (2010).
- Castellón et al. (2012) E. A. Castellón, R. Valenzuela, J. Lillo, V. Castillo, H. R. Contreras, I. Gallegos, A. Mercado, and C. Huidobro, Biological research 45, 297 (2012).
- Vaupel et al. (1989) P. Vaupel, F. Kallinowski, and P. Okunieff, Cancer research 49, 6449 (1989).
- Höckel et al. (1996) M. Höckel, K. Schlenger, B. Aral, M. Mitze, U. Schäffer, and P. Vaupel, Cancer research 56, 4509 (1996).
- Cristini et al. (2005) V. Cristini, H. B. Frieboes, R. Gatenby, S. Caserta, M. Ferrari, and J. Sinek, Clinical Cancer Research 11, 6772 (2005).
- Anderson et al. (2006) A. R. Anderson, A. M. Weaver, P. T. Cummings, and V. Quaranta, Cell 127, 905 (2006).
- Anderson (2005) A. R. Anderson, Mathematical Medicine and Biology 22, 163 (2005).
- Brú et al. (1998) A. Brú, J. M. Pastor, I. Fernaud, I. Brú, S. Melle, and C. Berenguer, Physical Review Letters 81, 4008 (1998).
- Caldwell et al. (1990) C. B. Caldwell, S. J. Stapleton, D. W. Holdsworth, R. A. Jong, W. J. Weiser, G. Cooke, and M. J. Yaffe, Physics in medicine and biology 35, 235 (1990).
- Lee and Claridge (2005) T. K. Lee and E. Claridge, Skin Research and Technology 11, 1 (2005).
- Baish and Jain (2000) J. W. Baish and R. K. Jain, Cancer research 60, 3683 (2000).
- Vasiev (2004) B. N. Vasiev, Physics Letters A 323, 194 (2004).
- Vasiev et al. (1994) B. Vasiev, P. Hogeweg, and A. Panfilov, Physical Review Letters 73, 3173 (1994).
- Vasieva et al. (1994) O. Vasieva, B. Vasiev, V. Karpov, and A. Zaikin, Journal of theoretical biology 171, 361 (1994).
- Amar et al. (2011) M. B. Amar, C. Chatelain, and P. Ciarletta, Physical review letters 106, 148101 (2011).
- Tambasco et al. (2010) M. Tambasco, M. Eliasziw, and A. M. Magliocco, Journal of translational medicine 8, 140 (2010).
- Etehad Tavakol et al. (2010) M. Etehad Tavakol, C. Lucas, S. Sadri, and E. Ng, Journal of Healthcare Engineering 1, 27 (2010).
- Zook and Iftekharuddin (2005) J. M. Zook and K. M. Iftekharuddin, Magnetic Resonance Imaging 23, 671 (2005).
- Pérez et al. (2015) J. L. Pérez, E. T. Puente, E. I. Kulich, J. A. B. MAr, M. Nistal, P. G. Peramato, M. R. García, J. M. N. Villar, and M. De Miguel, bioRxiv p. 015016 (2015).
- Smitha et al. (2015) K. Smitha, A. Gupta, and R. Jayasree, Physics in medicine and biology 60, 6937 (2015).
- Pribic et al. (2015) J. Pribic, J. Vasiljevic, K. Kanjer, Z. N. Konstantinovic, N. T. Milosevic, D. N. Vukosavljevic, and M. Radulovic, Biomarkers 9, 1279 (2015).
- Buczko and Mikołajczak (2015) O. Buczko and P. Mikołajczak, Annales Universitatis Mariae Curie-Sklodowska, sectio AI–Informatica 3, 153 (2015).
- Srivastava et al. (1986) A. Srivastava, P. Laidler, L. E. Hughes, J. Woodcock, and E. J. Shedden, European Journal of Cancer and Clinical Oncology 22, 1205 (1986).
- Brú et al. (2003) A. Brú, S. Albertos, J. L. Subiza, J. L. García-Asenjo, and I. Brú, Biophysical journal 85, 2948 (2003).
- Hermann et al. (2007) P. C. Hermann, S. L. Huber, T. Herrler, A. Aicher, J. W. Ellwart, M. Guba, C. J. Bruns, and C. Heeschen, Cell stem cell 1, 313 (2007).
- Girouard and Murphy (2011) S. D. Girouard and G. F. Murphy, Laboratory investigation 91, 647 (2011).
- Tang et al. (2016) X. Tang, J. Wu, C.-K. Ding, M. Lu, M. M. Keenan, C.-C. Lin, C.-A. Lin, C. C. Wang, D. George, D. S. Hsu, et al., Cancer research 76, 1892 (2016).
- Li et al. (2016) H. Li, L. Sun, E. L. de Carvalho, X. Li, X. Lv, G. J. Khan, H. Semukunzi, S. Yuan, and S. Lin, European Journal of Pharmacology (2016).
- Hilfinger and Paulsson (2011) A. Hilfinger and J. Paulsson, Proceedings of the National Academy of Sciences 108, 12167 (2011).
- Berg et al. (2000) O. G. Berg, J. Paulsson, and M. Ehrenberg, Biophysical journal 79, 1228 (2000).
- Trepat et al. (2009) X. Trepat, M. R. Wasserman, T. E. Angelini, E. Millet, D. A. Weitz, J. P. Butler, and J. J. Fredberg, Nature physics 5, 426 (2009).
- Wang et al. (2011) Y. Wang, K. Maslov, Y. Zhang, S. Hu, L. Yang, Y. Xia, J. Liu, and L. V. Wang, Journal of biomedical optics 16, 011014 (2011).
- Buchakjian and Kornbluth (2010) M. R. Buchakjian and S. Kornbluth, Nature reviews Molecular cell biology 11, 715 (2010).
- Jones and Thompson (2009) R. G. Jones and C. B. Thompson, Genes & development 23, 537 (2009).
- Scalerandi and Sansone (2002) M. Scalerandi and B. C. Sansone, Physical review letters 89, 218101 (2002).
- Haass et al. (2014) N. K. Haass, K. A. Beaumont, D. S. Hill, A. Anfosso, P. Mrass, M. A. Munoz, I. Kinjyo, and W. Weninger, Pigment cell & melanoma research 27, 764 (2014).
- Meacham and Morrison (2013) C. E. Meacham and S. J. Morrison, Nature 501, 328 (2013).
- Shahriyari and Komarova (2013) L. Shahriyari and N. L. Komarova, PLoS One 8, e76195 (2013).
- Dhawan et al. (2014) A. Dhawan, M. Kohandel, R. Hill, and S. Sivaloganathan, PloS one 9, e96093 (2014).
- Tomasetti and Levy (2010) C. Tomasetti and D. Levy, Proceedings of the National Academy of Sciences 107, 16766 (2010).
- Cao et al. (2013) Y. Cao, H. Naveed, C. Liang, and J. Liang, in Engineering in Medicine and Biology Society (EMBC), 2013 35th Annual International Conference of the IEEE (IEEE, 2013), pp. 5550–5553.
- Yoo and Hatfield (2008) M.-H. Yoo and D. L. Hatfield, Molecules and cells 26, 514 (2008).
- Gedye et al. (2016) C. Gedye, D. Sirskyj, N. C. Lobo, J. Meens, E. Hyatt, M. Robinette, N. Fleshner, R. J. Hamilton, G. Kulkarni, A. Zlotta, et al., Scientific reports 6, 25220 (2016).
- Nowell (1976) P. C. Nowell, Science 194, 23 (1976).
- Hayflick and Moorhead (1961) L. Hayflick and P. S. Moorhead, Experimental cell research 25, 585 (1961).
- Ambrosi and Preziosi (2002) D. Ambrosi and L. Preziosi, Mathematical Models and Methods in Applied Sciences 12, 737 (2002).
- Bray (2001) D. Bray, Cell movements: from molecules to motility (Garland Science, 2001).
- Martz and Steinberg (1972) E. Martz and M. S. Steinberg, Journal of cellular physiology 79, 189 (1972).
- Montel et al. (2011) F. Montel, M. Delarue, J. Elgeti, L. Malaquin, M. Basan, T. Risler, B. Cabane, D. Vignjevic, J. Prost, G. Cappello, et al., Physical review letters 107, 188102 (2011).
- Casciari et al. (1992) J. J. Casciari, S. V. Sotirchos, and R. M. Sutherland, Journal of cellular physiology 151, 386 (1992).
- Gerlee and Anderson (2010) P. Gerlee and A. R. Anderson, Mathematical biosciences and engineering: MBE 7, 385 (2010).