Magnetism and the phase diagram of MnSb2O6
Abstract
Static and dynamic magnetic properties of P3̄1-phase MnSb2O6 have been studied by means of muon spin relaxation (SR), high-frequency electron spin resonance (HF-ESR), specific heat, and magnetisation studies in magnetic fields up to 25 T. The data imply onset of long-range antiferromagnetic order at = 8 K and a spin-flop-like transition at T. Below , muon asymmetry exhibits well-defined oscillations indicating a narrow distribution of the local fields. A competing antiferromagnetic phase appearing below = 5.3 K is evidenced by a step in the magnetisation and a slight kink of the relaxation rate. Above , both SR and HF-ESR data suggest short-range spin order. HF-ESR data show that local magnetic fields persist up to at least K. Analysis of the antiferromagnetic resonance modes and the thermodynamic spin-flop field suggest zero-field splitting of GHz which implies small but finite magnetic anisotropy.
I Introduction
Frustrated spin systems provide access to study the emergence of novel ground states and unusual excitations. Triangular Heisenberg antiferromagnets are generic for frustrated magnetism and may possess rich magnetic phase diagrams and unusual ground states. Collins ; Nakatsuji ; Starykh2015 Even in the classical case, i.e., for large spin values, the ground state exhibits a hidden symmetry and unusual excitations. Seabra2011 While the tendency towards static magnetic order increases upon partial lifting of frustration, competing interactions still yield unusual ground states and short range spin fluctuations evolve far above . A further ingredient determining the ground states in addition to the spin size and the degree of geometrical frustration is magnetic anisotropy as frustration is more severe when spin alignment is restricted. Collins ; Yun
The honeycomb structure in MnAs2O6 with P3̄1 structure exhibits a trigonal arrangement of Mn2+-ions and is an example of a frustrated spin system as it exhibits a network of triangles with competing antiferromagnetic exchange interactions. Wangbo Indeed, the layered and frustrated magnetic structure gives rise to an incommensurate spin order below 12 K. Nakua The recently synthesized P3̄1 phase of MnSb2O6 is isostructural and isoelectronic to MnAs2O6. Nalbandyan2015 Note, that this phase differs from the trigonal, structurally and magnetically chiral polymorph of MnSb2O6. Reimers ; Johnson ; Werner2017 Density functional theory calculations on the P3̄1 phase suggest that the exchange interactions are very similar to those of its counterpart MnAs2O6 and that the long range antiferromagnetically ordered ground state appearing below K is of incommensurate nature. Wangbo In addition, weak ferromagnetism was suggested from static susceptibility data to be present below K. Here, we report the magnetic phase diagram and a detailed study of the magnetic properties of MnSb2O6 by means of zero-field muon spin resonance (SR), high-frequency electron spin resonance (HF-ESR), and static magnetisation measurements. Our data imply long-range antiferromagnetic order of most presumingly commensurate nature. In addition, there is thermodynamic evidence for a competing AFM phase below K. While weak ferromagnetism is ruled out by our experiments, there is clear evidence for short range magnetic order well above , i.e. up to about 100 K, which corresponds to the frustrated nature of magnetism in the P3̄1 polymorph of MnSb2O6. Observed zero-field splitting of GHz implies small but finite magnetic anisotropy.
II Experimental
Layered trigonal (P3̄1) MnSb2O6 was prepared by ion exchange reaction as reported elsewhere. Nalbandyan2015 Static magnetisation was studied in static magnetic fields up to 15 T by means of a home-built vibrating sample magnetometer vsm (VSM) and in fields up to 5 T in a Quantum Design MPMS-XL5 SQUID magnetometer. Pulsed field studies up to 25 T were done in a home-built device utilizing magnetic pulses of about 8 ms. Specific heat has been measured in magnetic fields up to 7 T by means of a relaxation method in a Quantum Design PPMS. Transmission HF-ESR measurements were carried out using a phase-sensitive millimeter-wave vector network analyzer (MVNA) from AB Millimetré. Comba2015 Experiments on a MnSb2O6 powder sample which was fixed with eicosane were performed in the frequency range from 30 to 350 GHz in a 16 T superconducting magnet from Oxford instruments. ZF-SR experiments were performed at the Paul Scherrer Institute using the DOLLY instrument with a He4-flow cryostat in the temperature range from 2 to 250 K on a pressed powder sample ( mg). A veto-logic was used to detect only the decay positrons from muons stopped in the sample. The SR data were analyzed with the software package MUSRFIT. Suter2012
III Static magnetization and specific heat
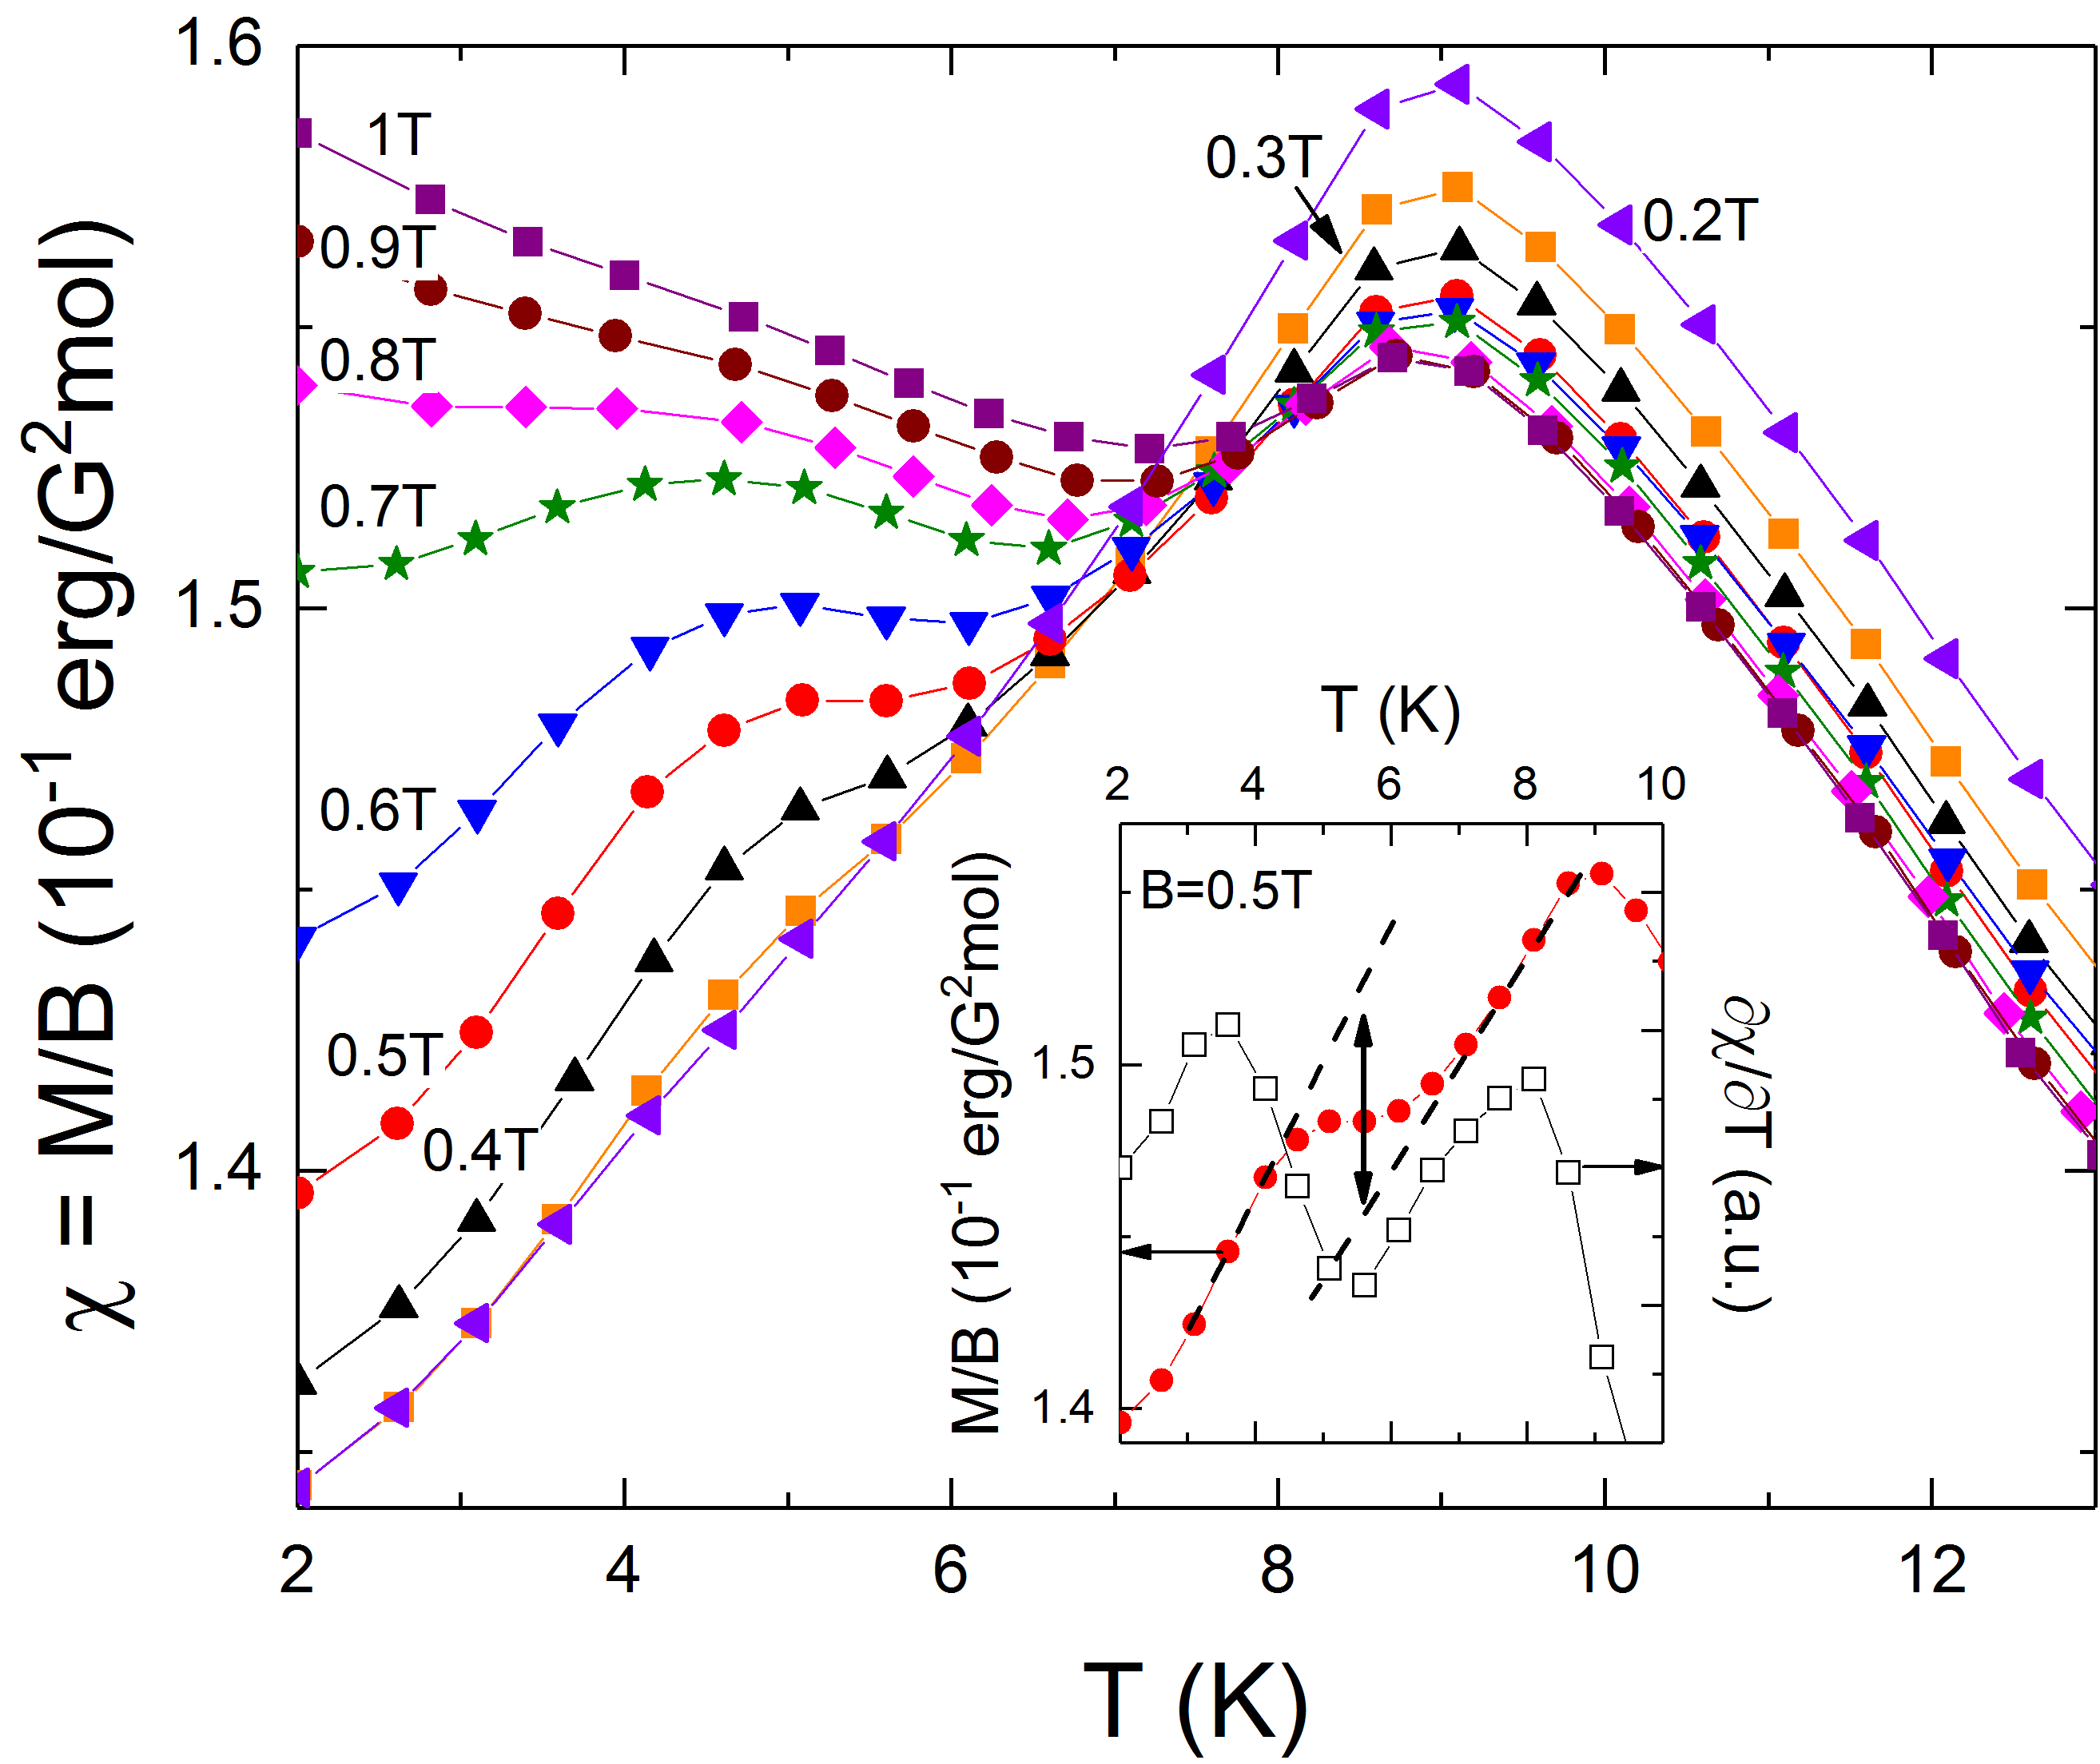
The static magnetic susceptibility at low temperatures shown in Fig. 1 illustrates the evolution of magnetic order in MnSb2O6. While there is a broad maximum in vs. centered around K, we infer = 8.0(4) K from the maximum in . The negative Weiss temperature K derived from a Curie-Weiss approximation to the high-temperature data (not shown) implies a moderate frustration parameter, i.e., .
While application of magnetic fields up to T does not significantly affect the onset of magnetic order at , there are two notable features: (1) There is a general strong increase of the low-temperature susceptibility as a function of magnetic field. As will be discussed in detail below, this is associated with the spin-flop transition. (2) There is an additional anomaly, i.e., a step-like increase of the susceptibility below at finite magnetic fields. The associated increase in the static magnetisation is illustrated in the inset of Fig. 1. E.g., at T, there is a increase in the magnetisation of /Mn at = 5.5(2) K. As the applied magnetic field increases, the step-like anomaly emerges, and correspondingly shifts to higher temperatures.
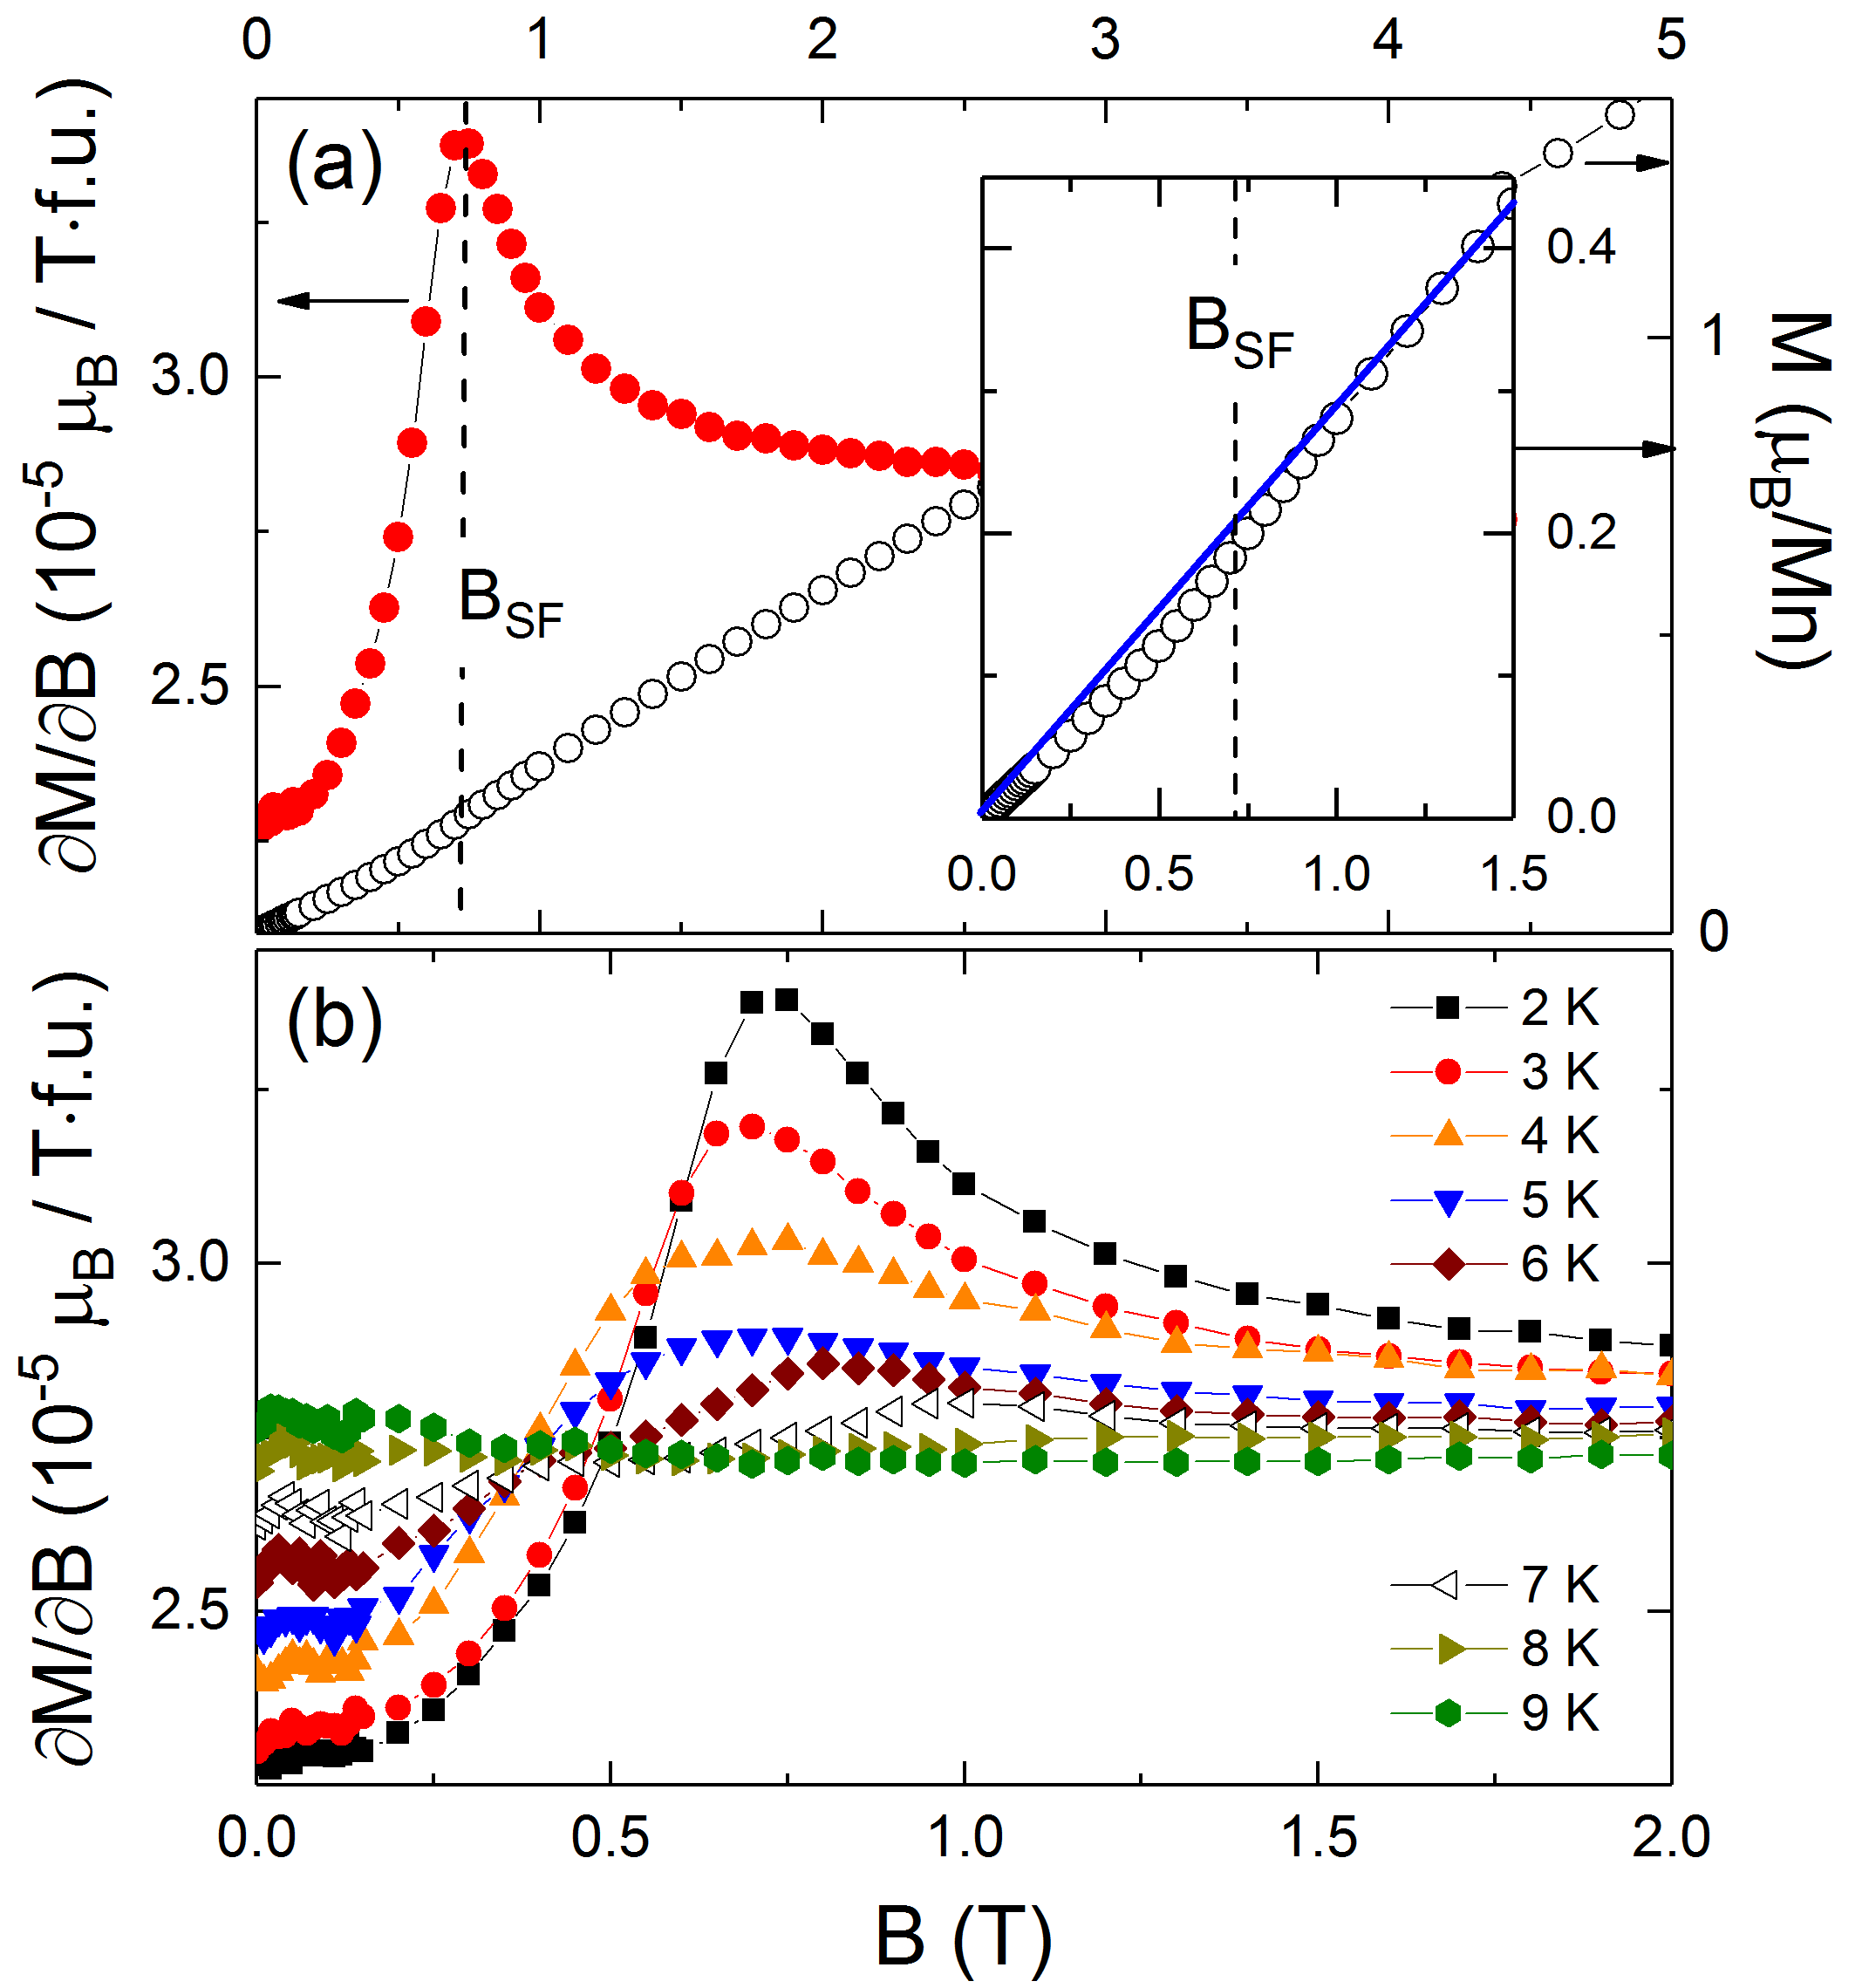
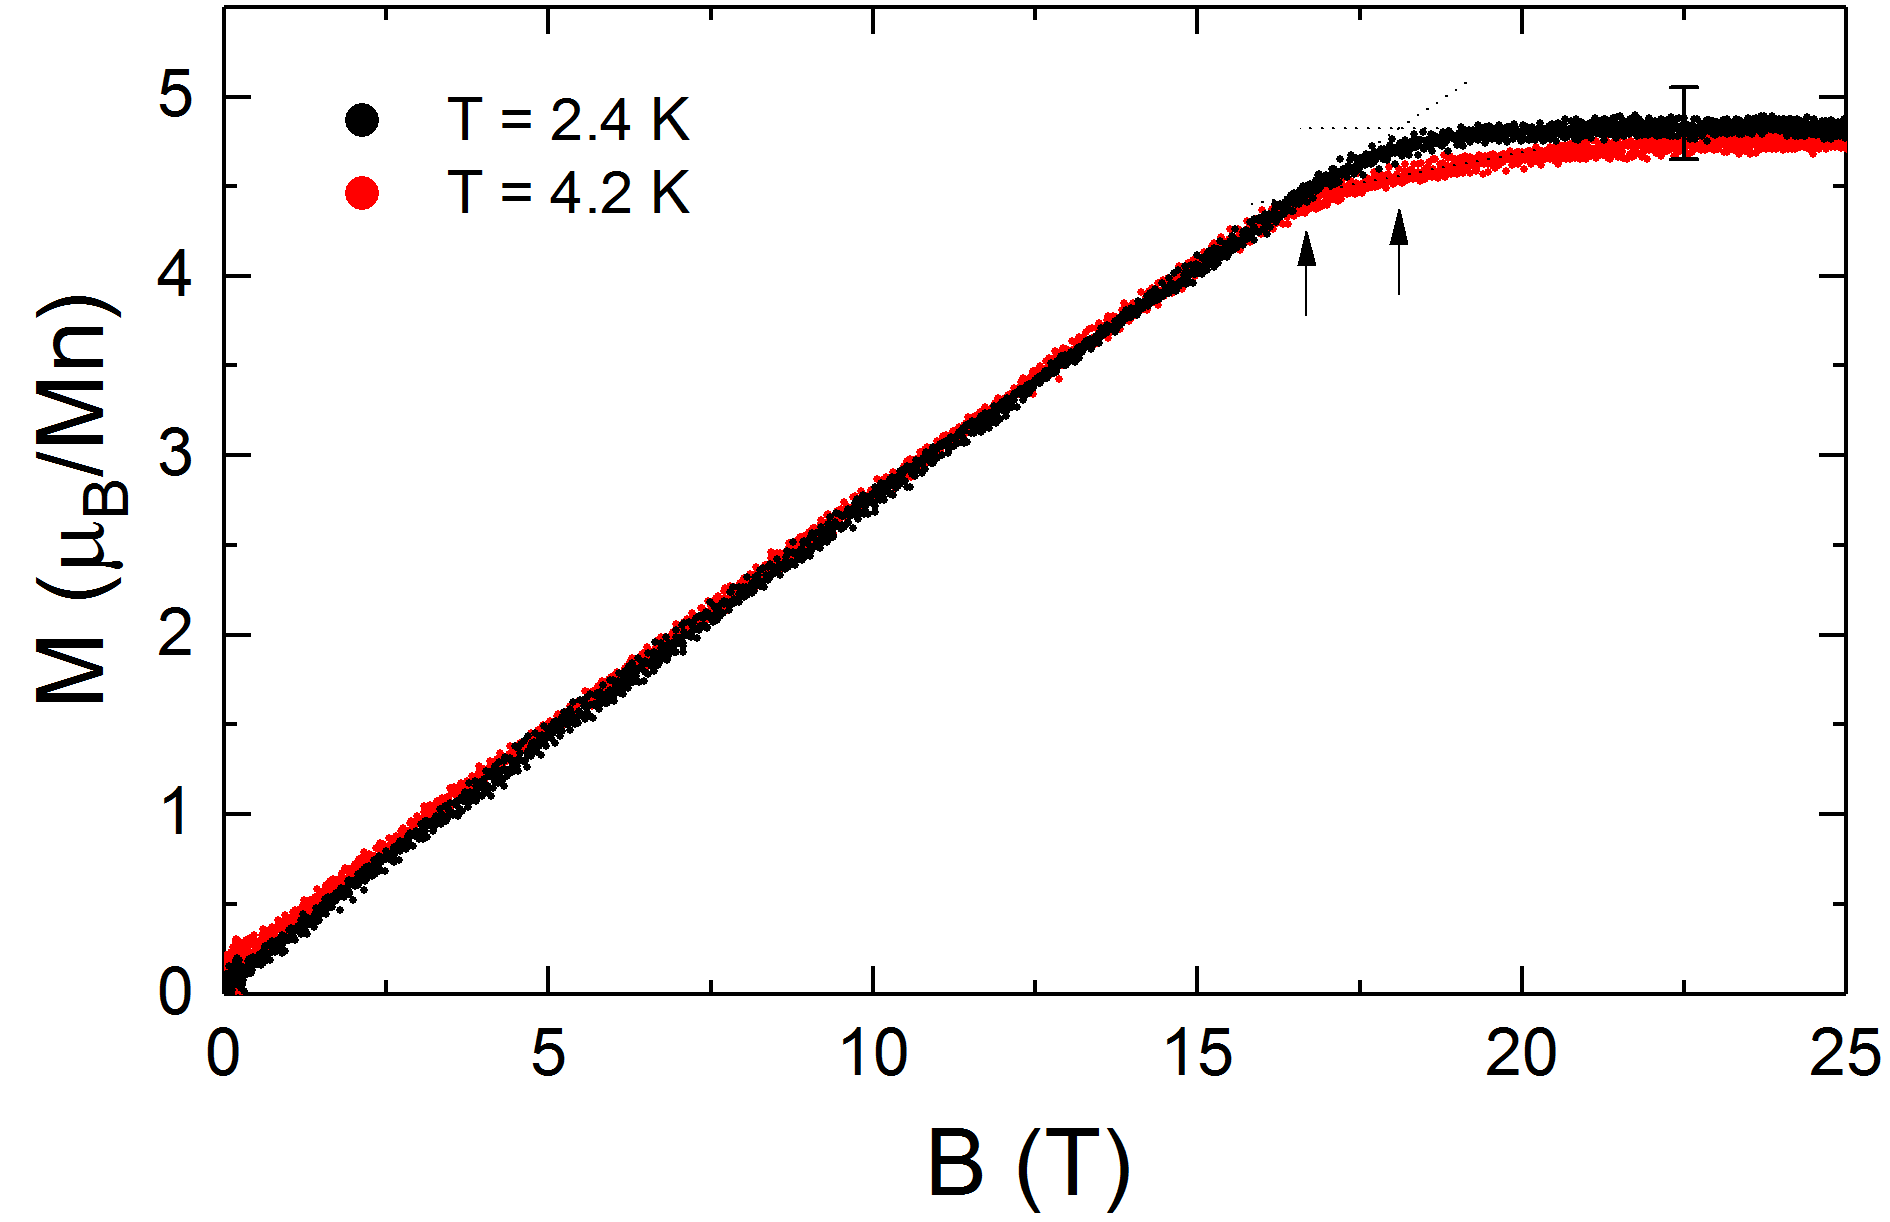
The field dependence of the magnetisation shown in Fig. 2 displays additional features. At , there is a small feature in which is associated with a pronounced maximum in the magnetic susceptibility. This anomaly is attributed to the spin-flop transition. At 2 K, the spin flop transition appears at = 0.72 T and there is a small magnetic field hysteresis of about 0.1 T. The corresponding jump in the magnetisation data amounts to /Mn. Upon heating, the anomaly at is suppressed and finally vanishes above (see Fig. 2b). This scenario of spin reorientation is supported by the static susceptibility data in Fig. 1 where magnetic anisotropy is evidently overcome by a magnetic field of less than 1 T. The high-field behaviour shown in Fig. 3 displays a linear field dependence of the magnetisation saturating at ( K) T. The saturation magnetisation amounts to 4.90.2 /Mn which agrees to expected high-spin value of Mn2+-ions.

The effect of magnetic fields on the long-range antiferromagnetically ordered phase as well as the associated magnetic entropy changes are demonstrated by the specific heat data in Fig. 4. At , displays a rounded peak-like anomaly which we interpret to be remnant from a -shaped one. In general, the actual transition temperature might be alternatively associated with the mid of the specific heat jump at K. Tari While all our conclusions do not change with either assignment of , the SR data presented in Fig. 5 are compatible to K. Upon application of magnetic fields, the anomaly is shifted to lower temperatures. In order estimate the magnetic entropy changes, the specific heat of the isostructural non-magnetic analogue, ZnSb2O6, was subtracted from the data. Tari Integrating the resulting magnetic specific heat / yields the magnetic entropy changes displayed in Fig. 4. At , about 2/3 of the total magnetic entropy is found to be released.
In contrast to the clear anomaly at , at there is no clear feature in the specific heat data. The measured field dependence () enables assessing the associated entropy or specific heat changes from the slope of the phase boundary. This procedure requires knowledge on the nature of the phase transition. Interpreting the magnetisation anomaly as a step and exploiting a Clausius-Clapeyron relation, i.e., assuming a (very weak) 1st order character yields associated entropy changes mJ/(molK). For a continuous transition where the anomaly is analysed as a step in , the analysis yields J/(molK). klingeler2005 In both cases, the anomaly would be smeared out over K and cannot be resolved by the calorimetric measurements presented. In this respect we mention the ambiguous behaviour () at low temperatures. The data suggest approximately linear behavior vs. at around 5 K which exact origin is unclear. Considering the right-bending of vs. below 3.5 K, the data are reminiscent to the presence of a hump in the temperature dependence of the specific heat in triangular spin systems such as AMn5(SO4)6 (A = Pb,Sr) and Li4FeSbO6 which may be associated to frustrated nature of the spin system. west2009 ; zvereva2013 Although less pronounced than in these systems, such a hump in MnSb2O6 might overlay a possible behavior with and it prevents clear conclusions about the nature of low-energy magnetic excitations from the specific heat data.
IV Zero-field muon spin relaxation
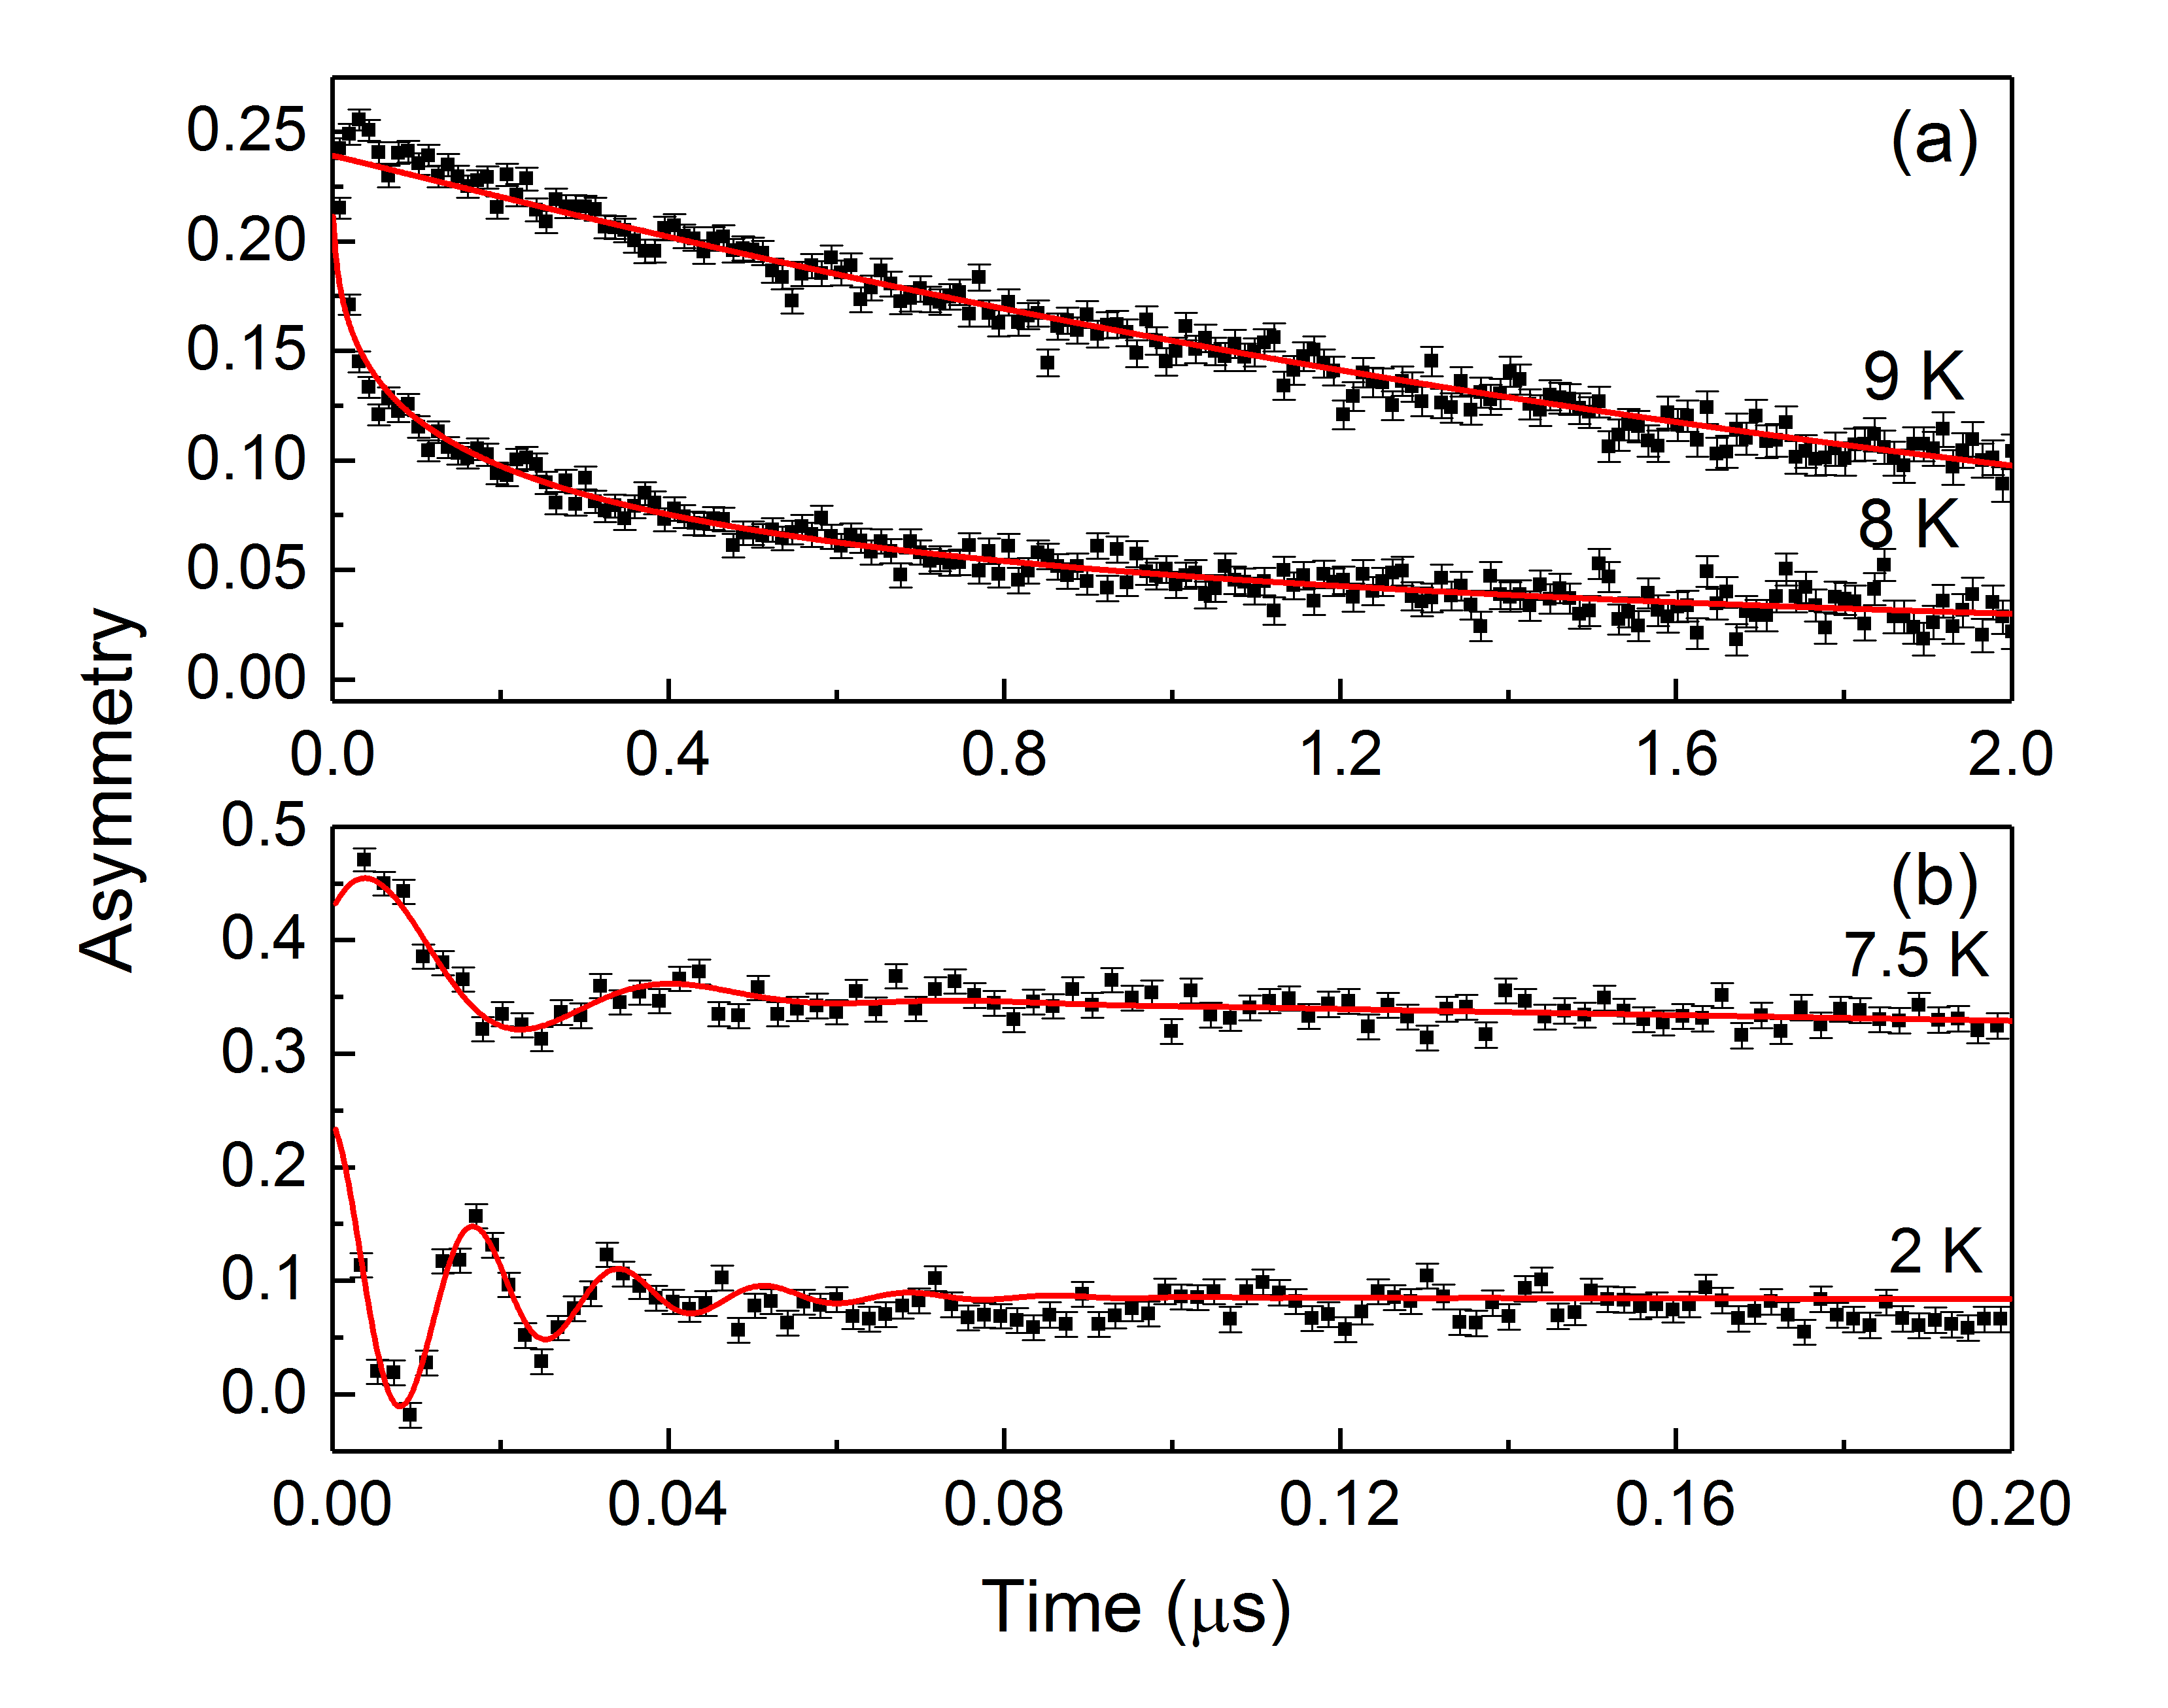
In order to probe the local magnetic fields of the corresponding magnetic phase via the spin precession frequency and relaxation rate, we have performed ZF-SR spectroscopy. schenck_85 The ZF-SR asymmetry spectra in Fig. 5 confirm long-range magnetic order at low temperatures. Depending on the temperature, the spectra show two different types of behaviour. At K, the data exhibit only slow decay of the asymmetry signal (Fig. 5a). This is attributed to dipole-dipole interaction between the muon spin and the nuclear and electronic spins in MnSb2O6. In the whole temperature range 9 K 270 K (not all spectra are shown), the asymmetries are essentially identical for the first few 100 ns. In contrast, the spectra tails at s time scales slightly increase upon heating from 9 to 20 K. As will be discussed below, these changes of the long-time relaxation may be associated to short-range spin order. Whereas, there are no changes upon further temperature increase from 20 up to 270 K.
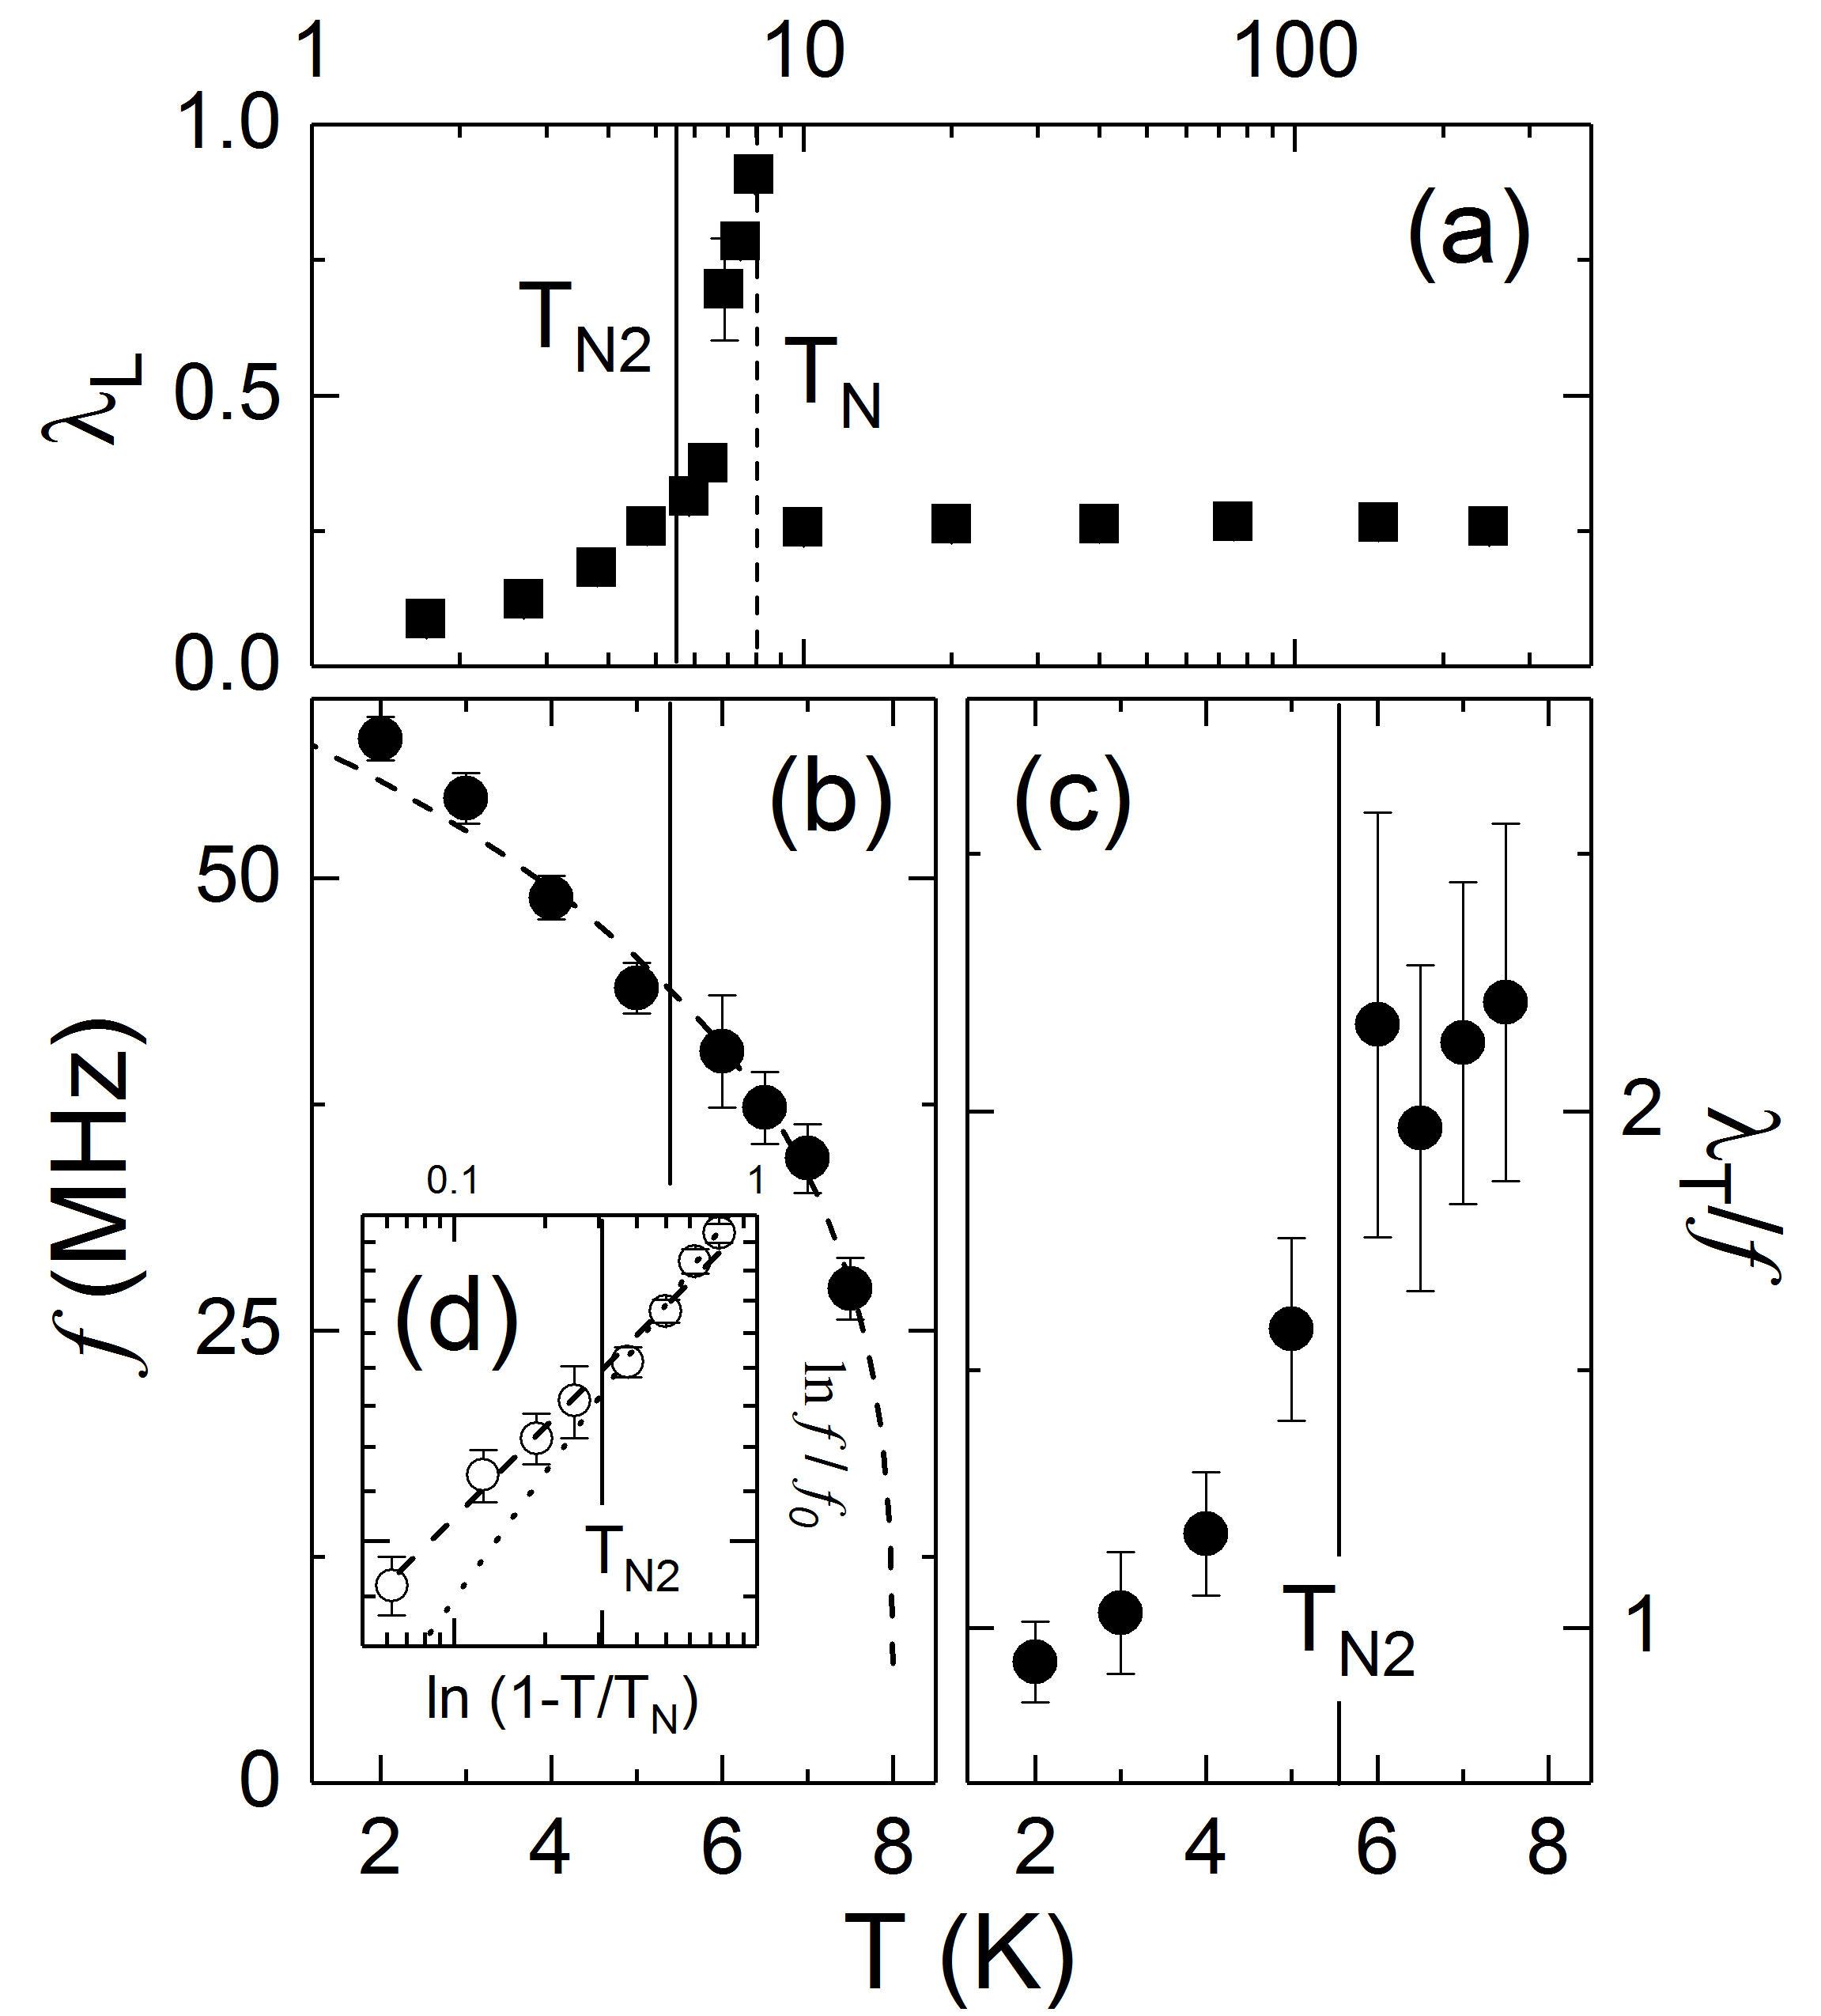
Adopting that muon-spin relaxation is dominantly due to the dynamics of electronic moments, a general exponential function was used to describe the SR spectra above . Here, is the generalized muon-spin relaxation rate. The exponent is a measure for the homogeneity of the system. The data imply only small variation of =1.15 (5) in the temperature range 9 K 270 K which suggests a homogeneous system. The obtained -values (see Fig. 6a) are rather temperature independent in the temperature range from 9 up to 270 K. In particular, there is no indication of local fields associated to weak ferromagnetism below 41 K. Thus, the SR data prove the absence of weak ferromagnetism in bulk MnSb2O6 in contrast to Ref. Nalbandyan2015, .
Upon cooling below , there is a clear change in the ZF-SR asymmetry spectra. Above all, the asymmetry signal on the s time scales is significantly suppressed. This becomes evident when comparing the SR spectra at 8 K and 9 K which are displayed in Fig. 5a without any offset on the spectra. The asymmetry at the two temperatures is quite different in the whole time scale under study. This difference implies the presence of a fast relaxation process at K, implying the presence of quasi-static internal fields. The presence of long-range spin order is indeed clearly confirmed by a reasonably well defined damped oscillation behavior at K (Fig. 5b). Upon further cooling, the damping decreases and the oscillations become more and more pronounced. The decay and the oscillation of the muon polarisation imply the evolution of local static magnetic moments in the experimental time window. In the case of a single muon site, the muon ensemble precesses about the mean local magnetic field with the Larmor frequency = where 851.4 MHz/T is the gyromagnetic ratio of the muon.
As displayed in Fig. 5b, the damped oscillations in the SR spectra below are well described by means of the internal field function
| (1) |
where is the ratio of the oscillating term to the non-oscillating term, which is close to 2/3 due to the statistic average of the perpendicular orientation of the polycrystal to the direction of polarized muons. f is the Larmor frequency related to the averaged local magnetic field at the muon site, and is the phase term. and are the muon relaxation rates reflecting the static and dynamic effects. From the frequency at K, i.e., ( K) = 57.7 MHz, the local magnetic field at the muon site is estimated as T.
The oscillations are reasonably well defined and hence allow extracting the temperature dependent antiferromagnetic order parameter by means of fitting of the SR spectra in the oscillating regime. The order parameter is presented in Fig. 6b and d. It shows the typical development of internal fields associated with long-range magnetic order. In a phenomenological description, the data may be described by
| (2) |
The best fitting parameters describing the data at are , = 60 MHz, and = 8 K. At , there is a slight change in the temperature dependence of which might be associated to (see Fig. 6d).
The transversal relaxation rate divided by the oscillation frequency stays rather constant between 8 K and 6 K but clearly decreases for K (Fig. 6b). This change of behaviour coincides with the step-like anomaly observed in the static susceptibility measurements at and the change in the temperature dependence . We note, however, the large error bars of between and 6 K. In contrast, the muon relaxation rate shows no clear feature at but increases as the transition temperature is approached from below.
V High-Frequency Electron Spin Resonance
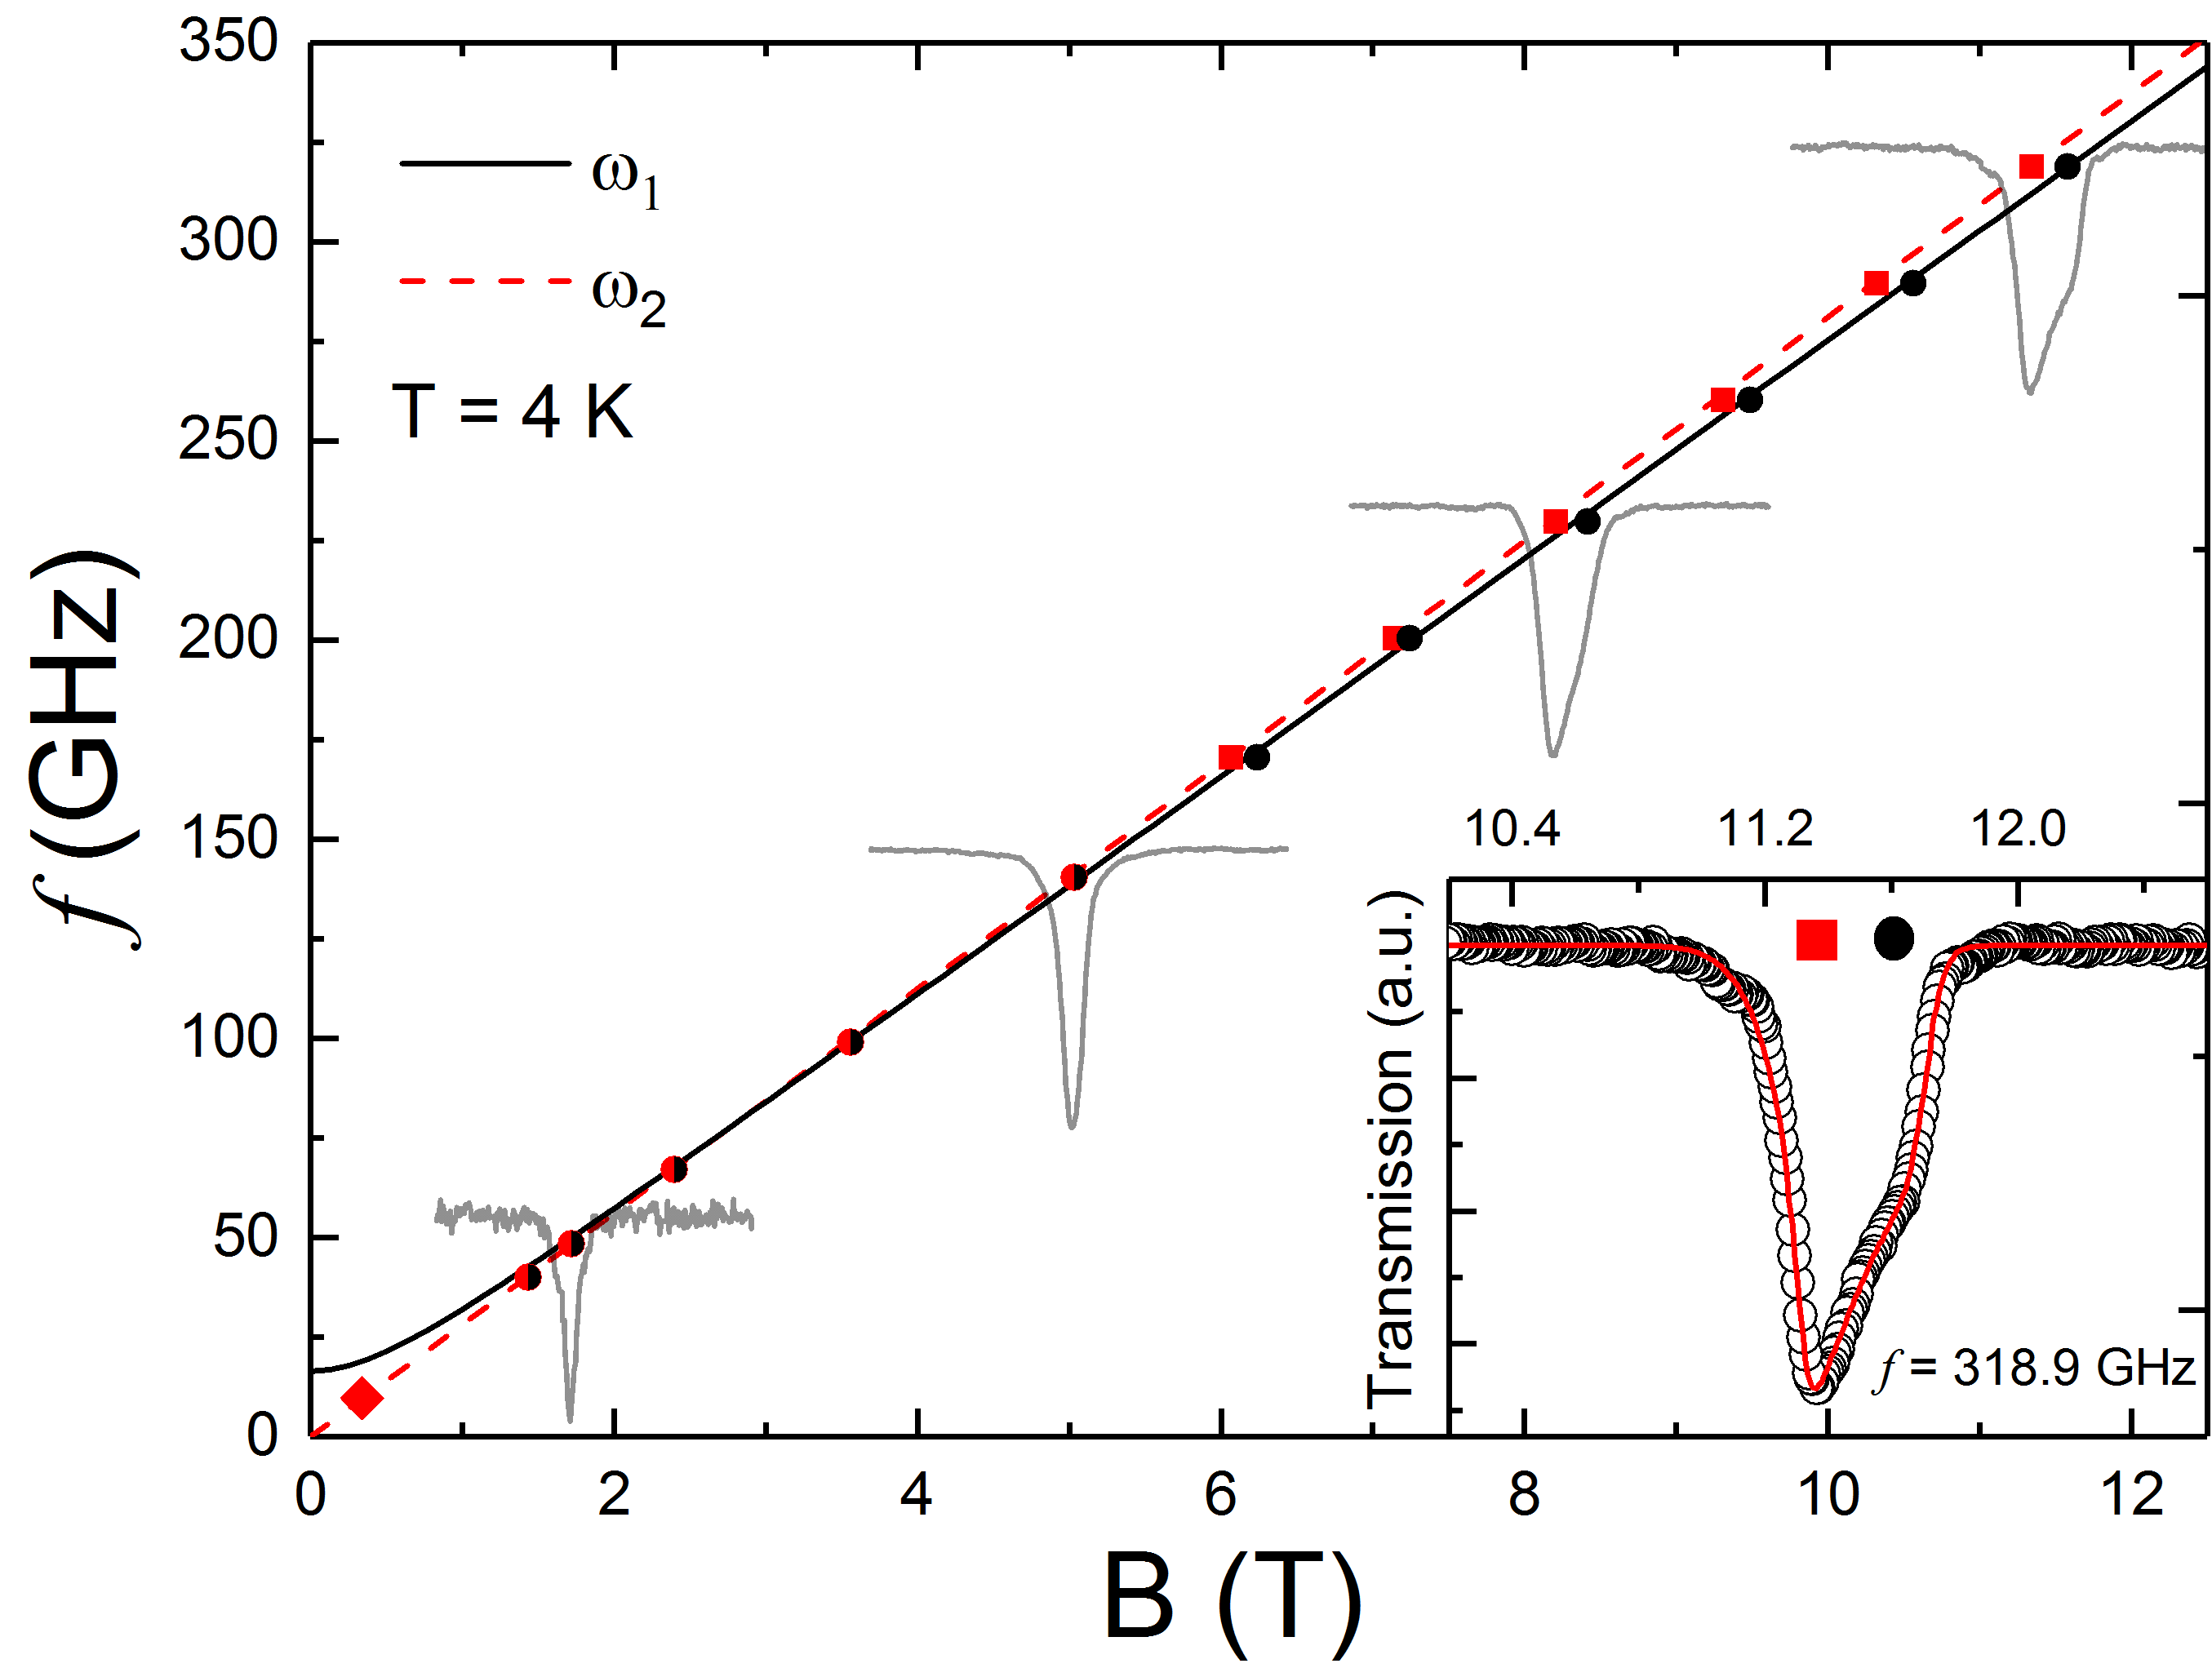
Further information on the magnetism in MnSb2O6 is obtained from HF-ESR measurements. Fig. 7 shows selected spectra and the observed resonance fields, taken well in the long-range ordered phase at K, in a frequency-magnetic field plot. At high frequencies, typical transmission powder spectra with two features are observed. The more pronounced minimum feature appears at the lower magnetic field which is indicative of an easy-plane-type anisotropy. Koo2015 Fitting the resonance features by means of powder spectra yields the respective resonance fields and shown in Fig. 7 which can be attributed with the magnetic fields directed parallel and perpendicular to the easy plane, respectively. At low frequencies, due to the small difference of the resonance fields we only observe single resonance features.
The observed resonance branches in the frequency vs. field diagram can be described by means of the antiferromagnetic resonance (AFMR) model with two sublattices in consideration of an easy-plane-type anisotropy field. Turov In this model, there are two AFMR resonance modes and associated with magnetic fields directed either perpendicular or parallel to the easy plane. Due to the fixation of the powder sample, we expect to observe both modes. The AFMR modes are described as following:
| (3) |
| (4) |
is the gyromagnetic ratio. The modified magnetic fields ( = 1, 2) account for the anisotropy of the -factor. The exchange field and the anisotropy field are combined as . The best fit to the data yields the branches and shown in Fig. 7. The best fitting parameters are = 1.970.01, = 2.010.01, and T.
While the gapless branch fully agrees to the resonance feature from a previous X-band ESR study Nalbandyan2015 , our analysis suggests the presence of small but finite zero-field splitting (ZFS) of ( T) = 18 GHz. Since no experimental data have been obtained below 30 GHz in this study due to the limitations of the experimental devices, such a small ZFS can not be unambiguously derived from the ESR data alone. The absence of any additional resonance at low frequencies down to 30 GHz however implies that the ZFS is smaller than 30 GHz. Note, that our data are not consistent with both and being gapless because in that case line splitting at 100 GHz would be large enough to be well resolved. In addition, the extracted anisotropy gap perfectly agrees to the thermodynamic spin-flop field. At K, the magnetisation curve demonstrates = 0.72 T, which corresponds to the anisotropy gap ( K) = 20 GHz. This value agrees to the best fit to the HF-ESR branches.
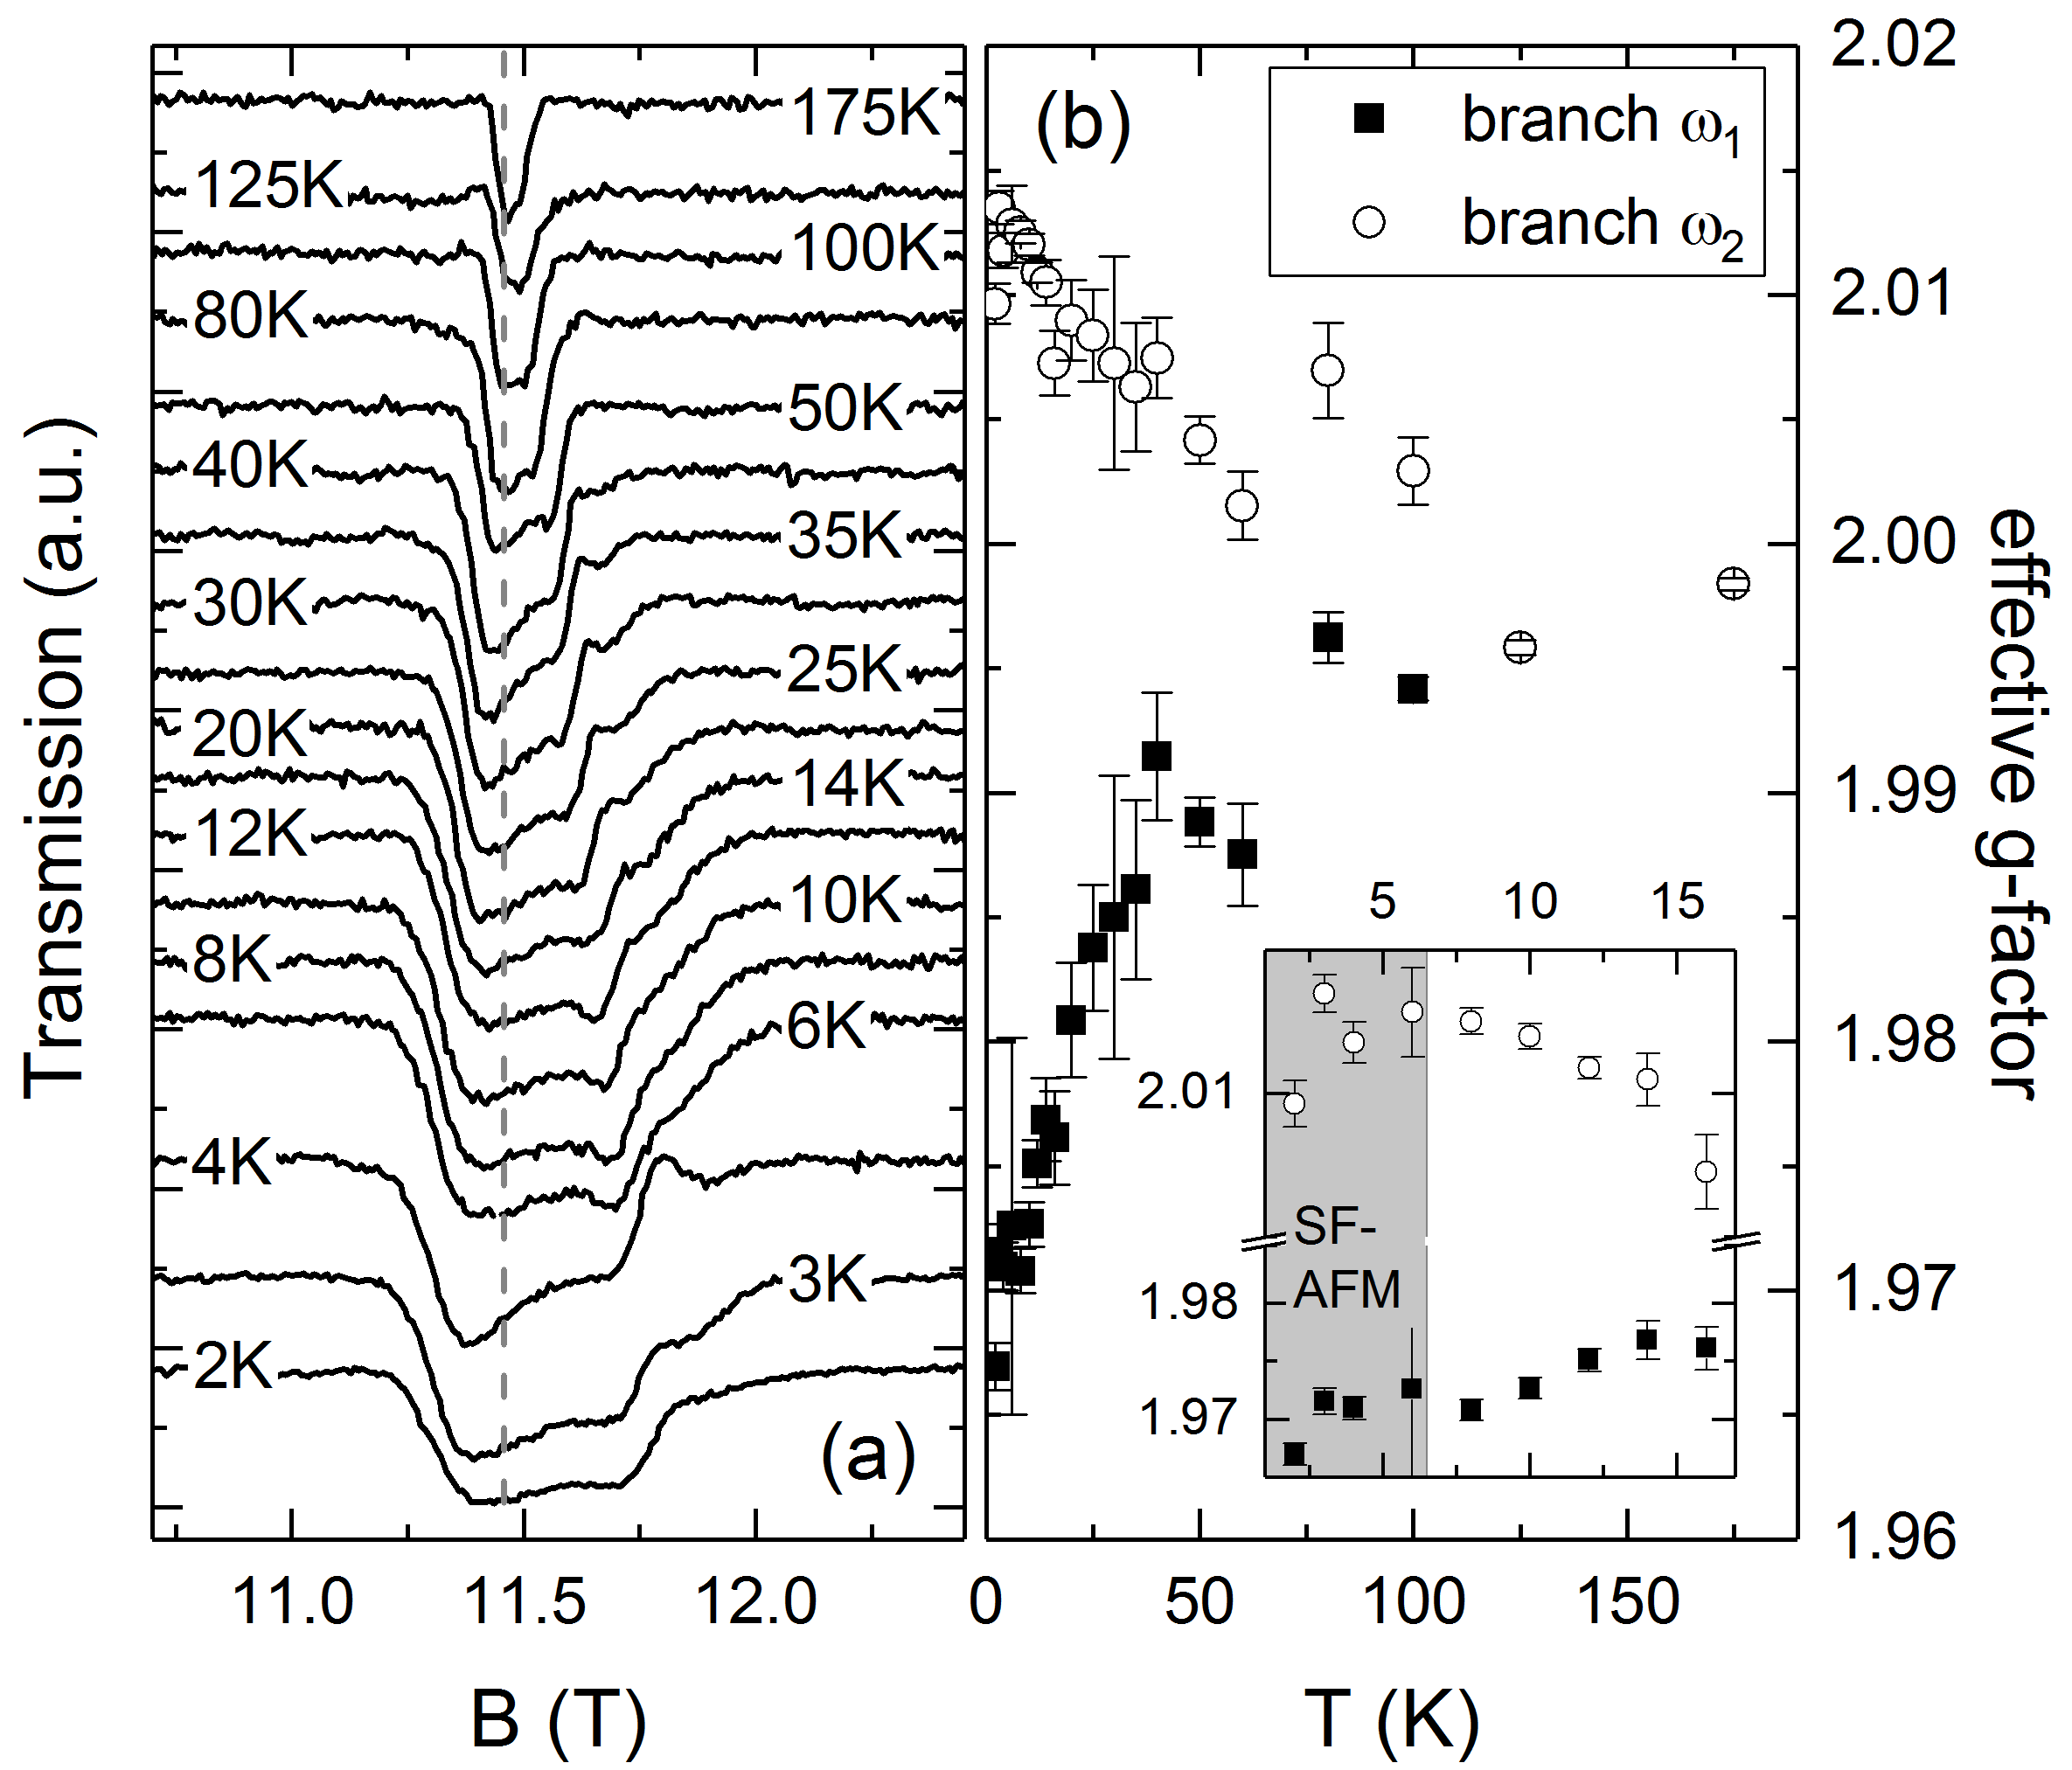
Figure 8 shows the temperature dependence of the two resonance features at GHz from 2 to 175 K. At high temperatures, the resonance is well described by a single Lorentzian with . Upon cooling, at temperatures not less than 100 K the resonance starts to broadening and shifting. The two resonance features can be clearly separated at K and can be fitted with two Lorentzians. This clearly indicates the presence of local magnetic fields implying that short-range spin correlations remain well above the Neel temperatures up to at least 12. As seen by the temperature dependence of the effective -factors in Fig. 8b, local magnetic fields continuously evolve upon cooling and eventually the typical splitting of the resonance features attributed to AFMR modes in the ordered phase is observed. Note, that no particular effects appear upon crossing the actual long-range ordering temperature which, at the resonance field of about 11 T, amounts to K.
VI Discussion
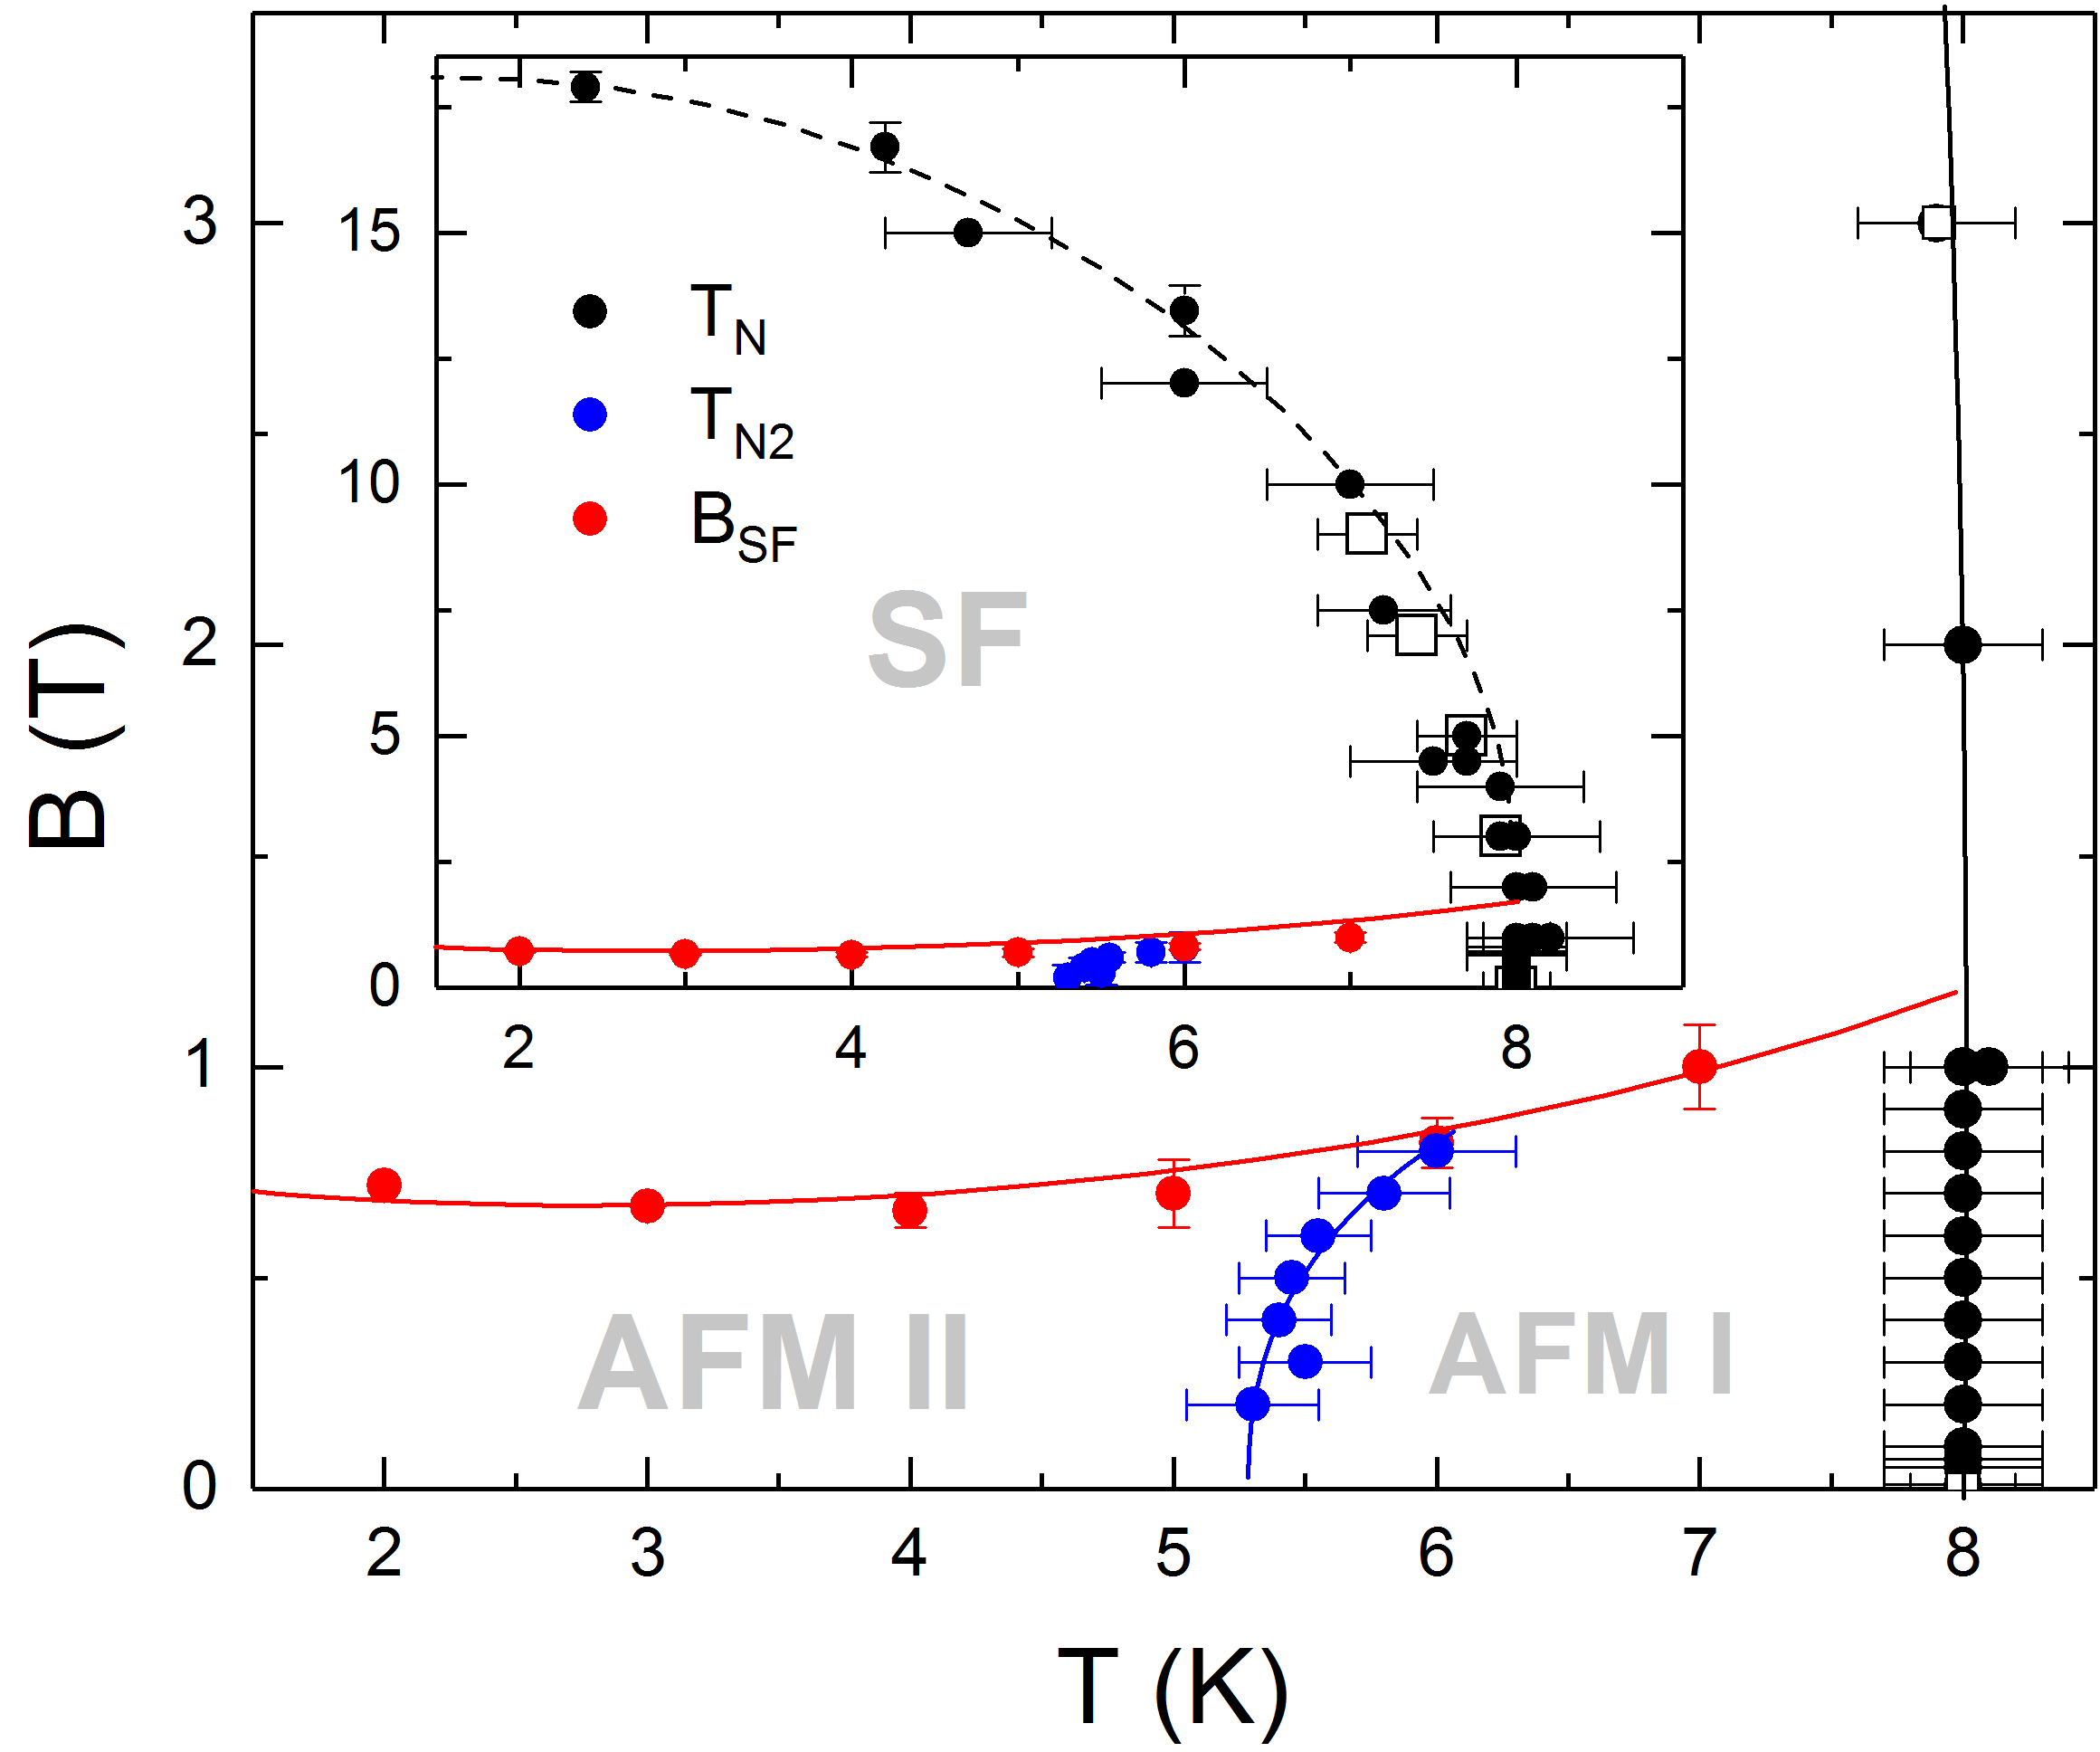
The ZF-SR-data confirm the evolution of quasi-static internal magnetic fields, i.e., of long-range AFM order in MnSb2O6 below K. Together with the static magnetisation and specific heat data this enables constructing the magnetic phase diagram of MnSb2O6 (see Fig. 9). Note, that our data clearly exclude the presence of a potential weakly ferromagnetic phase below 41 K. The phase boundary () between the long-range antiferromagnetic ordered phase AFM I and the paramagnetic one shows the expected negative slope.
In contrast to DFT predictions Nalbandyan2015 and different from the isostructural compound MnAs2O6 [Wangbo, ], magnetic order is of commensurate nature as evidenced by well-defined oscillations of the SR asymmetry spectra. In both materials, DFT+U suggests triangular magnetic substructures in which spin exchange interactions , , and are weak and comparable in magnitude. Wangbo ; Zvereva2015 Koo and Whangbo point out that in MnAs2O6 spin exchange interactions are not the deciding factor favoring the incommensurate spin structure over a commensurate one but suggest dipole-dipole interactions being crucial. Wangbo The fact that our data imply commensurate spin order in the isostructural compound MnSb2O6 where , , and from DFT+U is very similar as in MnAs2O6 confirms that even small effects may decide the actual spin ground state. We conclude that the observed effective anisotropy of 18 GHz should be considered in this respect. In addition, our analysis of the ESR and magnetisation data suggests that the spin structure in the SF phase involves not more than two magnetic sublattices. AFMR models with three or more sublattices would imply an additional ZFS of the mode and/or a different intensity distribution of the AFMR spectra.
Analysing the antiferromagnetic order parameter in terms of a phenomenological model yields the critical exponent . This value is in between the values for the 2D-XY () and the 3D Heisenberg () antiferromagnet which suggests that magnetic order in MnSb2O6 is not of a simple two- or three-dimensional antiferromagnetic Heisenberg-type. This agrees to DFT calculations which yield intralayer interactions which are stronger than the (however finite) interlayer ones and would form 2D AFM networks if the interlayer coupling was negligible. Nalbandyan2015 Hence, one neither would expect perfect 2D nor 3D magnetism in agreement with the observed critical behaviour. In contrast to the order parameter extracted from the SR-data, splitting of the HF-ESR line does not reflect a clear change at . If at all, line broadening and splitting which, in the paramagnetic phase, signals the presence of short-range correlations, stay somehow constant at . This agrees to the fact that, at GHz, the resonance branches are well in the linear regime. Werner2017
At small magnetic fields, the phase diagram demonstrates two antiferromagnetic phases (AFM I and AFM II). Our observation of the yet unknown AFM II phase illustrates the presence of two competing antiferromagnetic phases. Thermodynamically, the presence of the phase boundary is unambiguously derived from the associated jump in the magnetisation. In the dynamic response, the AFM II phase may be associated with a kink in the temperature dependence of the transverse relaxation rate. However, no significant anomaly in the order parameter is observed at . In agreement with being positive, the slope of () is positive, too. The spin-flop transition appears in both AFM I and AFM II at around 1 T. The nearly vanishing temperature dependence of implies negligible entropy changes at the spin-flop transition as compared to the magnetisation anomaly. In the spin-flop phase, we do not find evidence for a phase boundary (). FN2
Magnetic anisotropy appears to be relevant in this high-spin Mn2+-system. The HF-ESR data imply a small but finite planar anisotropy showing up in the zero-field splitting of the associated AFMR mode of approximately 20 GHz. The resulting exchange-anisotropy field which is obtained by analysing the resonances by means of an easy-plane two-sublattice model yields T. Exploiting the saturation field T allows estimating the planar anisotropy field T which is the same as in trigonal P321-MnSb2O6 and similar to CaMnClH2O. Werner ; Phaff The thermodynamic spin-flop field quantitatively provides the same anisotropy gap as derived from the analysis of the AFMR data. Interestingly, the spin-flop phase seems not to exhibit two AFM states. This enables speculating about the relevance of anisotropy for stabilising the actual antiferromagnetic ground state. In the region of the phase diagram where the magnetic field overcomes the anisotropy energy and yields a spin-rotated situation, one of the -spin configurations is destabilised, i.e., it only appears if anisotropy is dominant compared to the external field. We conclude that the magnetic field abrogates the energy difference between AFM I and AFM II and that magnetic anisotropy is crucial for selecting the actual magnetic state from two AFM phases of very similar energy. This conclusion is in-line with numerical results which suggest that very small effects are decisive for stabilising the incommensurate spin structure over a commensurate one in MnAs2O6. Wangbo
VII Summary
MnSb2O6 is a spin frustrated system which magnetic structure exhibits antiferromagnetically frustrated triangles. Nalbandyan2015 Although analysis of static magnetisation data in terms of a Curie-Weiss model only yields a moderate ratio / , the presence of local magnetic fields antiferromagnetic spin fluctuations is clearly confirmed by shift and broadening of the resonance HF-ESR resonance lines. The increase of the SR spectra tail in the long time scale further confirms the presence of short-range magnetic correlations above . HF-ESR data show that local magnetic fields persist up to at least . Such a wide temperature range of antiferromagnetic fluctuations agrees to the triangular arrangement of Mn2+-ions and corresponding frustrated magnetism in MnSb2O6. Below , muon asymmetry exhibits well-defined oscillations indicating a narrow distribution of the local fields which strongly suggests the commensurate nature of spin order. The antiferromagnetic order parameter implies a behaviour in between what is expected for the 2D-XY and the 3D Heisenberg model. A competing antiferromagnetic phase appearing below = 5.3 K is evidenced by a step in the magnetisation and a slight kink of the relaxation rate. We conclude that small but finite anisotropy of GHz derived is crucial for selecting the actual magnetic ground state from two AFM phases of very similar energy.
Acknowledgements.
We are very grateful to V.B. Nalbandyan providing the samples. RK and EAZ acknowledge financial support by the Excellence Initiative of the German Federal Government and States. Partial support by the DFG via project KL 1824/13 is gratefully acknowledged. RS and HHK are thankful to the DFG for the financial support through SFB 1143 for the project C02. This work was supported by the Ministry of Education and Science of the Russian Federation in the framework of Increase Competitiveness Program of NUST ”MISiS” grant K2-2017-084; by act 211 of the Government of Russian Federation, contracts No. 02.A03.21.0004 and 02.A03.21.0011. Support by Russian Foundation for Basic Research through grants 17-52-45014, 18-02-00326 and 18-502-12022 is acknowledged.References
- (1) M.F. Collins and O.A. Petrenko, Can. J. Phys. 75, 605-655 (1997)
- (2) S. Nakatsuji, Y. Nambu, H. Tonomura, O. Sakai, S. Jonas, C. Broholm, H. Tsunetsugu, Y. Qiu, Y. Maeno, Science 309, 697-1700 (2005)
- (3) O. A. Starykh, Rep. Prog. Phys. 78 052502 (2015)
- (4) L. Seabra, T. Momoi, P. Sindzingre, N. Shannon, Phys. Rev. B 84, 214418 (2011)
- (5) M. Yun, G. S. Jeon, J. Phys.: Conf. Ser. 592, 012111 (2015)
- (6) H.-J. Koo, M.-H. Whangbo, Inorg. Chem. 53, 3812-3817 (2014)
- (7) A.M. Nakua, J.E. Greedan, J. Solid State Chem. 118, 118 402-11 (1995)
- (8) V. B Nalbandyan, E. A Zvereva, A. Y. Nikulin, I. L Shukaev, M. H. Whangbo, H. J. Koo, M. Abdel-Hafiez, X. J. Chen, C. Koo, A. N. Vasiliev, R. Klingeler, Inorg. Chem. 54, 1705-1711 (2015)
- (9) J.N. Reimers, J.E. Greedan, M.A. Subramanian, J. Solid State Chem. 79, 263 (1989)
- (10) R.D. Johnson, K. Cao, L.C. Chapon, F. Fabrizi, N. Perks, P. Manuel, J.J. Yang, Y.S. Oh, S.-W. Cheong, P.G. Radaelli1, Phys. Rev. Lett. 111, 017202 (2013)
- (11) J. Werner, W. Hergett, M. Gertig, J. Park, C. Koo, R. Klingeler, Phys. Rev. B 95, 214414 (2017).
- (12) J. Werner, C. Koo, R. Klingeler, A. N. Vasiliev, Y. A. Ovchenkov, A. S. Polovkova, G. V. Raganyan, and E. A. Zvereva, Phys. Rev. B 94, 104408 (2016)
- (13) R. Klingeler, B. Büchner, K.-Y. Choi, V. Kataev, U. Ammerahl, A. Revcolevschi, J. Schnack, Phys. Rev. B 73, 014426 (2006)
- (14) P. Comba, M. Großhauser, R. Klingeler, C. Koo, Y. Lan, D. Müller, J. Park, A. Powell, M.J. Riley, H. Wadepohl, Inorg. Chem. 54, 11247-11258 (2015)
- (15) R. Klingeler, B. Büchner, S-W. Cheong, M. Hücker, Phys. Rev. B 72, 104424 (2005).
- (16) D.V. West, T.M. McQueen, I.D. Posen, X. Ke, Q. Huang, H.W. Zandbergen, A.J. Williams, P. Schiffer, R.J. Cava, J. Solid State Chem. 182, 1343 (2009).
- (17) E.A. Zvereva, O.A. Savelieva, Ya.D. Titov, M.A. Evstigneeva, V.B. Nalbandyan, C.N. Kao, J.-Y. Lin, I.A. Presniakov, A.V. Sobolev, S.A. Ibragimov, M. Abdel-Hafiez, Y. Krupskaya, C. Jähne, G. Tan, R. Klingeler, B. Büchner, A.N. Vasiliev, Dalton Trans. 42, 1550-1566 (2013).
- (18) Different atomic masses have been accounted for by considering a factor of 1.03 (cf. A. Tari, The specific heat of matter at low temperatures, London, 2002).
- (19) A. Suter, B. Wojek, Physics Procedia 30, 69 (2012)
- (20) C. Koo, E.A. Zvereva, I.L. Shukaev, M. Richter, M.I. Stratan, A.N. Vasiliev, V.B. Nalbandyan, R. Klingeler, J. Phys. Soc. Jpn. 85, 084702 (2016)
- (21) E. A. Turov, Physical Properties of Magnetically Ordered Crystals, Academic Press (1965).
- (22) See, e.g., A. Schenck, Muon Spin Rotation Spectroscopy, Adam Hilger (1985).
- (23) In the spin-flop phase such a feature would be, however, hardly visible if appearing below K.
- (24) A. C. Phaff, C. H. W. Swüste, K. Kopinga, W. J. M. de Jonge, J. Phys. C: Solid State Phys. 16, 6635 (1983)