Mixing between Seyfert and H II-region excitation in local active galaxies
Abstract
We fit theoretical models to the emission-line spectra of 2766 Seyfert galaxies from the Sloan Digital Sky Survey (SDSS). The model line fluxes are derived by ‘mixing’ photoionization model predictions of active galactic nucleus (AGN) narrow line region (NLR) emission and H II region emission. The observed line fluxes in each spectrum were directly compared to the grid of mixed models using the Bayesian parameter estimation code NebulaBayes, thereby measuring the degree of mixing in each spectrum for the first time. We find that the majority of the Balmer line emission in the majority of Seyfert-classified SDSS spectra arises from contaminating H II regions within the fixed-size aperture. Even for spectra with [O III]/H, a median of of the Balmer flux arises in H II regions. We show that the results are qualitatively insensitive to the assumed Seyfert ionizing continuum, and that ionizing spectra with a peak energy of – 50 eV produce the most plausible distributions of mixing fractions. The analysis cleanly quantifies how the starburst – AGN ‘mixing fraction’ increases on the BPT diagram for SDSS galaxies. Apart from the mixing fraction, the models also vary with the ionization parameter in the NLR, the gas pressure, and the metallicity. Measurements for the metallicity in particular will be presented in a companion paper.
1 Introduction
The Sloan Digital Sky Survey (SDSS; York et al., 2000) provides a rich spectroscopic sample of galaxies in the local universe, including tens of thousands of galaxies hosting Active Galactic Nuclei (AGN). The SDSS AGN population has been extensively studied, providing insights into many aspects of the population: the host galaxy properties (e.g. Kauffmann et al., 2003; Kewley et al., 2006; Koss et al., 2011; Reines & Volonteri, 2015), nuclear activity as a function of galaxy environment (e.g. Miller et al., 2003; Constantin et al., 2008; von der Linden et al., 2010; Khabiboulline et al., 2014) classification of excitation mechanisms (e.g. Kewley et al., 2006; Shirazi & Brinchmann, 2012; Bär et al., 2017), gas kinematics (e.g. Greene & Ho, 2005), comparisons to AGN emission at other wavelengths (e.g. Kauffmann et al., 2008; Koss et al., 2011; Mateos et al., 2013; Paliya et al., 2018), relative alignment of the host galaxy and active nucleus (Lagos et al., 2011), and the distribution of black hole masses and Eddington ratios (e.g Greene & Ho, 2007; Kauffmann & Heckman, 2009; Jones et al., 2016) amongst other topics.
A large proportion of SDSS AGN spectra show clear mixing between H II region emission and AGN NLR emission on optical diagnostic diagrams. This mixing is broadly attributable to the summing of emission in the SDSS fiber aperture, but more subtly is associated with the correlation between star formation rate and population-averaged supermassive black hole accretion rate (e.g. Chen et al., 2013) and with the close timing of starbursts and black hole accretion (e.g. Wild et al., 2010). Although integral field data now allows detailed spatial analysis of the mixing of H II and NLR emission (e.g. Davies et al., 2014a, b; Dopita et al., 2014), the effect of H II region contamination on single-fibre SDSS NLR spectra has not been robustly quantified. The H II – NLR mixing significantly complicates detailed photoionization modelling of the SDSS AGN.
In this Letter we tackle the H II – NLR mixing using theoretical models and a general Bayesian method, determining the proportion of the emission arising from each of the two mechanisms for each SDSS AGN spectrum. We demonstrate that the mixing is an important consideration even for the highest-excitation AGN spectra in the SDSS sample.
2 Observational data
Our sample is taken from SDSS DR7 (Abazajian et al., 2009), and we use the emission line fluxes provided by the MPA/JHU catalogue111www.mpa-garching.mpg.de/SDSS/DR7/
http://home.strw.leidenuniv.nl/~jarle/SDSS/ (Tremonti et al., 2004). We selected galaxies with redshifts in the range , which resulted in the g-band covering fraction (proportion of the galaxy light within the fiber aperture) having a 25th percentile, median, and 75th percentile of 0.15, 0.22 and 0.30, respectively. The lower redshift cut involves a trade-off between sample size and potential systematic aperture effects due to low covering fractions (Kewley et al., 2005), and is also determined by the need for the [O II] doublet to be redshifted into the observed wavelength range.
We applied the following further cuts:
-
1.
All fluxes and errors of relevant emission lines were required to be finite and positive
-
2.
A signal to noise (S/N) cut was applied based on the H flux. We required H and did not use S/N cuts on other lines to avoid biasing the sample (in particular, biasing the metallicities).
-
3.
We required spectra to have a Balmer decrement H / H greater than 2.7, because lower values are unphysical, and we require reliable flux calibration and reddening corrections.
After these cuts there remained 2766 Seyfert-classified objects and 51806 H II-classified objects. The spectra were classified using the [N II] and [S II] optical diagnostic diagrams (Baldwin et al., 1981; Veilleux & Osterbrock, 1987), following the method of Kewley et al. (2006). Only the Seyfert- and ‘composite’-classified galaxies were included in the analysis, with LINER, star-forming, and ambiguous galaxies being excluded.
3 Method
The primary tool we use in our analysis is NebulaBayes222https://github.com/ADThomas-astro/NebulaBayes, a package that performs Bayesian parameter estimation by comparing observed emission line fluxes and errors with an arbitrary grid of model fluxes. NebulaBayes is described in detail by Thomas et al. (2018).
The MAPPINGS V (Sutherland & Dopita, 2017) photoionization model grids we feed into NebulaBayes are ‘mixing’ grids, derived by combining H II region and NLR model grids. Both grids have dimensions in the parameters of oxygen abundance , ionization parameter at the inner edge of the photoionization model , and gas pressure . In addition, the NLR grid has a fourth parameter , which is the peak (on a log-log plot of energy flux versus energy) of the ‘big blue bump’ ionizing accretion disk emission in the model of the ionizing spectrum (Thomas et al., 2016). The H II and NLR grids used here are the same as those distributed with the NebulaBayes software (Thomas et al., 2018), with the exception of four intermediate values that have been added to the NLR grid.
The H II and NLR grids were combined into a ‘mixing’ grid using the following assumptions:
-
1.
The H II regions and NLR clouds within the same aperture have the same metallicity
-
2.
The H II regions and NLR clouds within the same aperture have the same pressure,
-
3.
There is little sensitivity to the H II region ionization parameter. This parameter was fixed at , a representative value for high metallicity galaxies that was found by analysing the SDSS H II spectra using NebulaBayes with the H II region grid alone.
-
4.
can be fixed to a single representative value without biasing the results.
The number of parameters is limited by computational practicalities and by the number of independent line fluxes in each spectrum. A more complex model is unlikely to be justified by statistically significant improvements to model fits.
The ‘mixing’ is parametrized by , the proportion of the H flux in a ‘mixed’ spectrum that arises from NLR as opposed to H II emission (). This parametrization, first used by Kewley et al. (2001b), is more sophisticated than approaches that use distances on the optical diagnostic diagrams to parametrize the gas excitation (e.g. Khabiboulline et al., 2014). We sampled at the six values , 0.2, 0.4, 0.6, 0.8 and 1.0. In total, there were four parameters in each mixing grid (with a different grid for each considered value): , , and .
The following emission lines were used in the analysis: [O II], [Ne III], [O III], [O III], He I, [O I], [N II], and [S II]. We also included H and H, which are essential for both normalization and reddening-correction. We used the built-in ability of NebulaBayes to deredden spectra to match the predicted Balmer decrement at every point in the model grid.
Two priors were combined, with equal weighting. These were a prior on the [S II] doublet flux ratio, to constrain the gas pressure, and a prior on the [N II]/[O II] ratio, to help constrain the metallicity.
4 Results
4.1 Variation in the mixing fraction
Our results for the parameter are presented in Figure 1 on optical diagnostic diagrams, with the classification lines described by Kewley et al. (2006) shown for reference. The results show that the mixing fraction behaves intuitively by increasing upwards along the mixing sequence from the star-forming sequence to the Seyfert region.
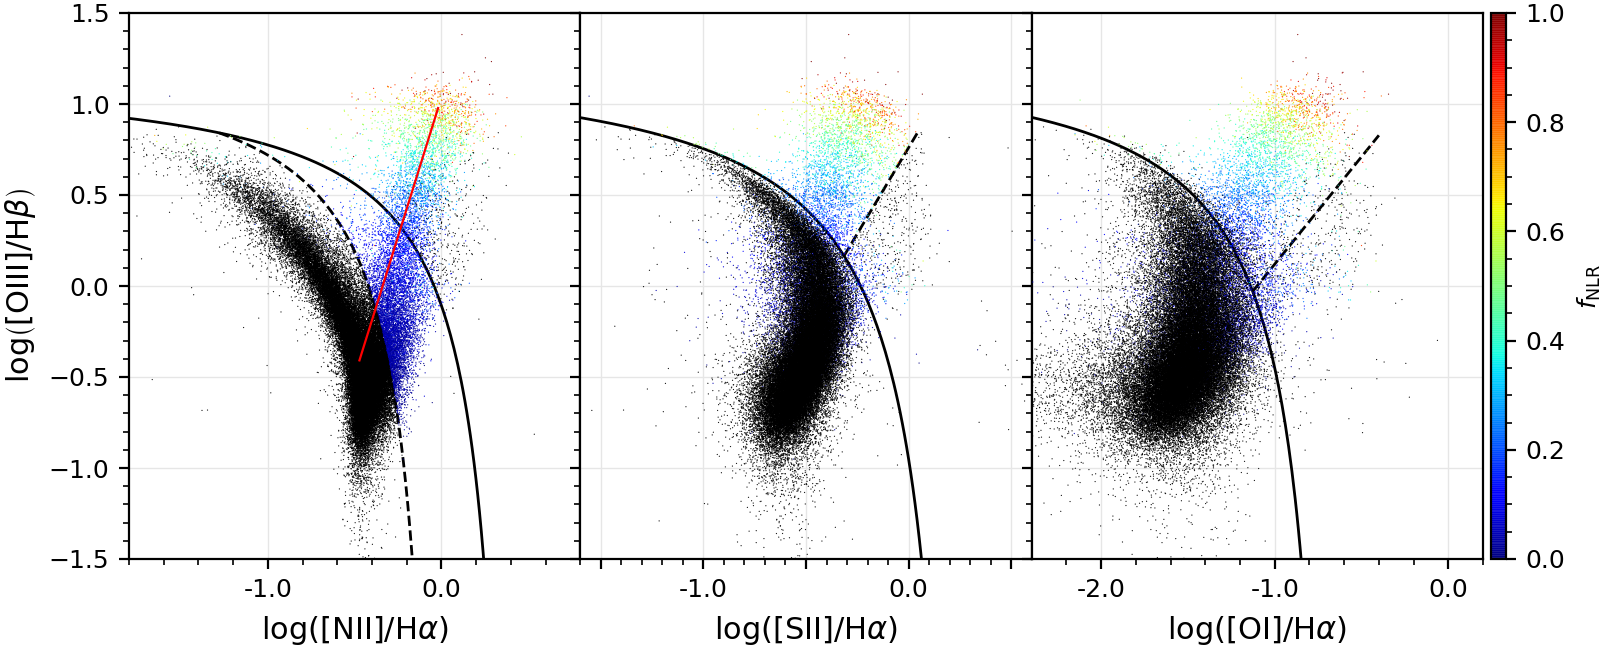
The red line in the left panel of Figure 1 is a ‘mixing line’, which is chosen to be linear in log-log space and follow the upper locus of the H II-AGN mixing sequence. The line connects the median H II-classified point (at ) and the median Seyfert-classified point with (at ), where [N II]/H and [O III]/H. We note that a true ‘mixing locus’ would be curved in the Figure 1 log-log plot.
4.2 Effect of the ionizing Seyfert spectrum
The mixing fraction is degenerate with the parameter corresponding to the hardness of the Seyfert radiation field, . Increasing either quantity has the effect of increasing the effective ionization of a ‘mixed’ model spectrum. Understanding the effect of allows us to quantify typical values as a function of the position of SDSS galaxies on the optical diagnostic diagram.
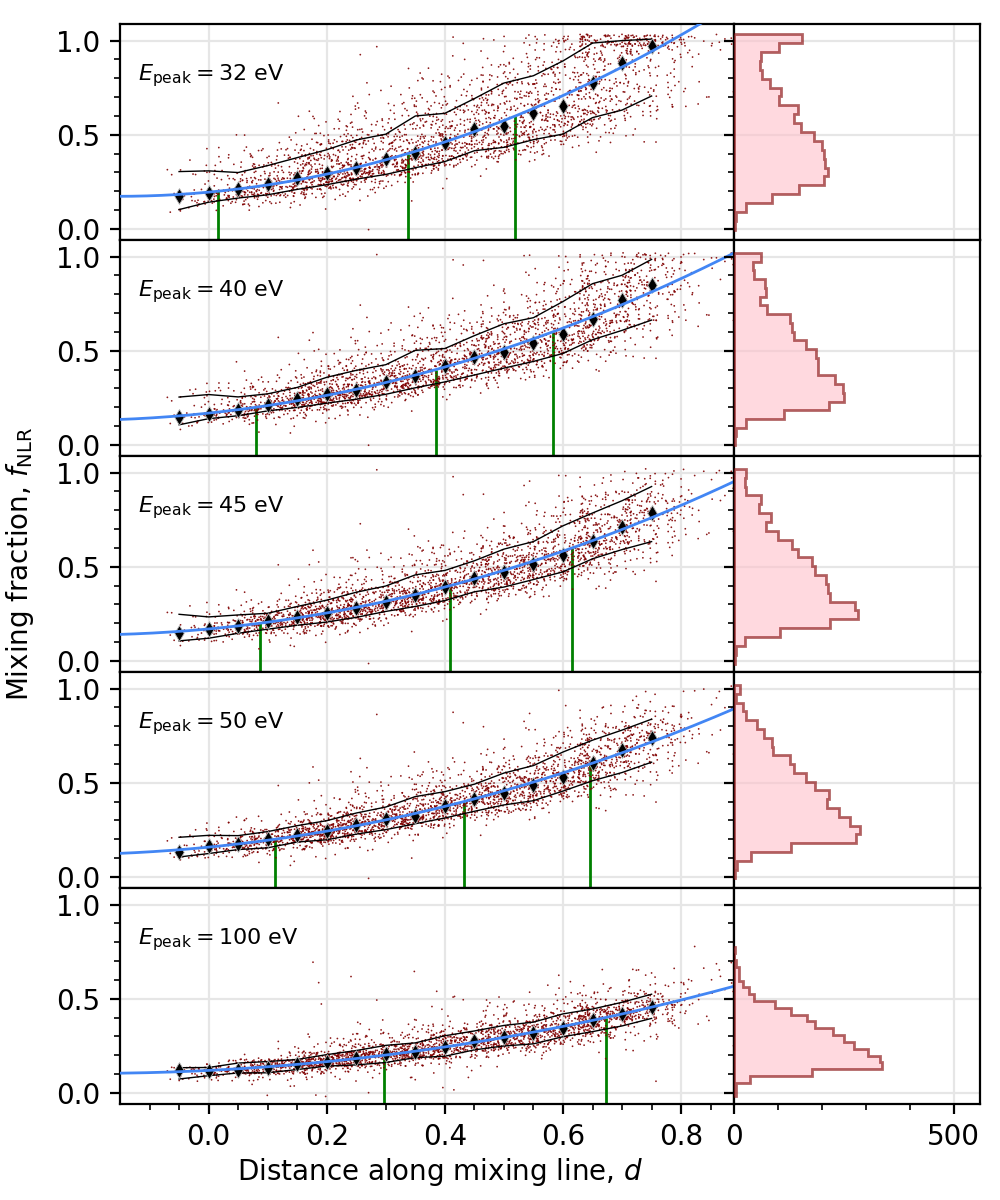
Figure 2 shows the inferred mixing fraction versus projected distance along the mixing line , for a series of values. The point was chosen to coincide with the intersection of the red mixing line and the solid black line (extreme starburst line of Kewley et al., 2001a) in Figure 1. For eV the high- data is clustered at , presumably because the observed spectra have a higher ionization than the models in the relevant part of the parameter space, resulting in the inferred being artificially elevated. Conversely, at the other extreme of eV (improbably high considering the ionization potentials of species observed in typical NLRs), all galaxies have a relatively low inferred value. Results do not change significantly for in the range eV, and we select eV to use in quantifying typical mixing fractions on the mixing sequence.
The scatter in may be associated with variations in the three other parameters, which would allow a range of values to correspond to a single value. However, a major contribution to the scatter is likely to be variation in the intrinsic values of the AGN population. We expect to increase with the Eddington ratio , and the SDSS Seyfert distribution is known to have a non-trivial width (e.g. Kewley et al., 2006; Kauffmann & Heckman, 2009). Variation in should cause more scatter at high , and indeed the scatter does noticeably increase with (and ) in all panels of Figure 2.
4.3 Measuring typical mixing fractions
We now consider the typical mixing fractions as a function of location on the BPT diagram. Figure 3 shows an [N II] optical diagnostic diagram, illustrating the derived lines of ‘median mixing fraction’. These green mixing fraction lines correspond to the green vertical lines in the eV panel of Figure 2. In Figure 3 these lines are drawn perpendicular to the red mixing line, and have a gradient of . The intercept (where ) for each line is 0.341, 0.676, and 0.893 for , 0.4 and 0.6 respectively.
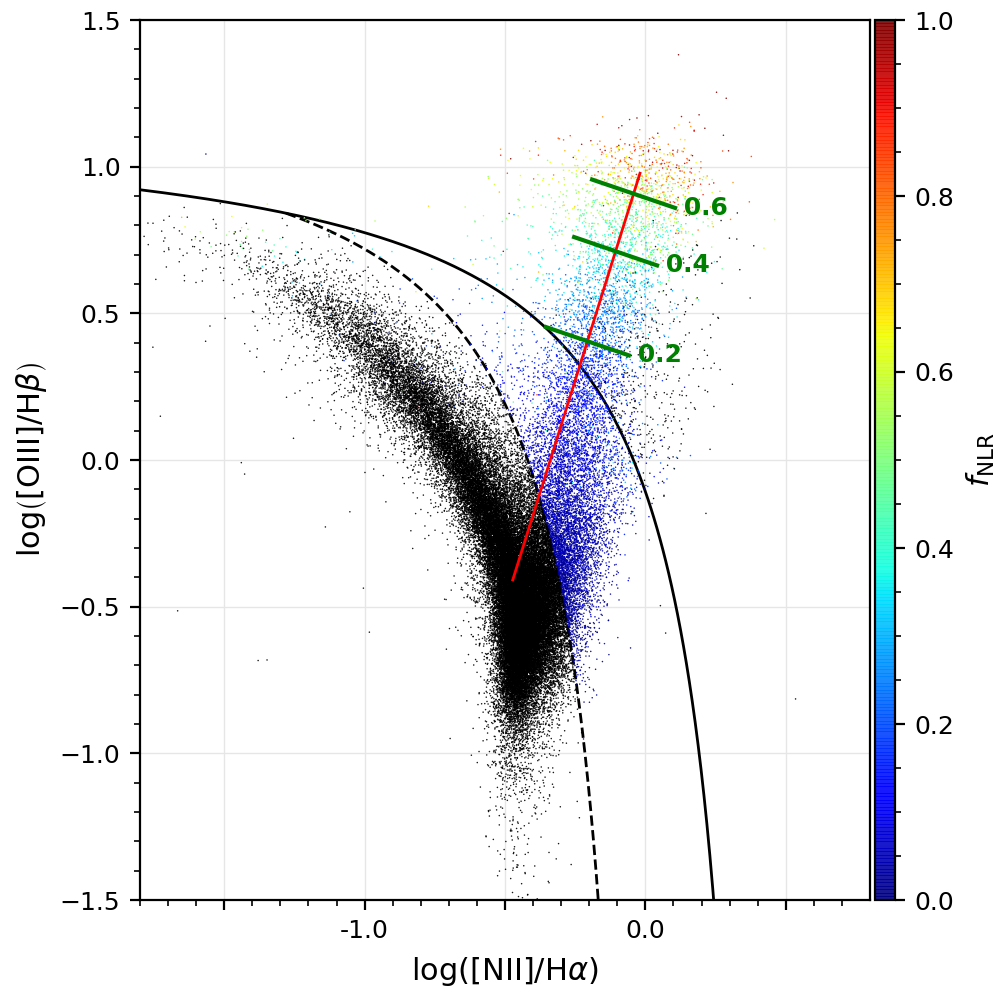
A key result evident in Figures 2 and 3 is that for the majority of Seyfert-classified SDSS spectra, the majority of the Balmer emission arises in H II regions, and not in the NLRs. Only spectra with [O III]/H typically have the majority of the Balmer flux arising in the Seyfert NLRs. These results hold true for all in the range eV.
5 Discussion
We have clearly demonstrated that modeling of Seyfert emission in the SDSS sample must take H II-region contamination into account. Cuts on BPT classifications may remove AGN spectra with a high degree of H II contamination (e.g. Maragkoudakis et al., 2014), but our results show that a large fraction of the remaining spectra are significantly contaminated. A small proportion of LINER galaxies may remain in our Seyfert sample due to the approximate nature of the Seyfert-LINER separation (Kewley et al., 2006). However, these interloping LINERs are unlikely to affect the results (especially considering that ionization parameter varies in our models).
Table 1 shows the relative contributions of NLR emission and H II region emission to line fluxes in mixed model spectra. The [O III] emission is dominated by NLR clouds even at low , but the proportional NLR flux contribution is consistently below for [N II] and [S II]. Evidently [O III] is a highly sensitive tracer of AGN contamination in H II spectra. Conversely, for other lines, the Seyfert-classified spectra may easily suffer significant contamination from H II-region emission. The data in Table 1 appears to be consistent with Figure 3 of Kauffmann & Heckman (2009), who also calculate likely H II region contributions to the [O III] flux.
| H | [OII] | [OIII]5007 | [OI]6300 | [NII]6583 | [SII] | |
|---|---|---|---|---|---|---|
| 0.0 | 0.0 | 0.000 | 0.000 | 0.000 | 0.000 | 0.000 |
| 0.1 | 0.1 | 0.213 | 0.952 | 0.403 | 0.092 | 0.093 |
| 0.2 | 0.2 | 0.378 | 0.978 | 0.603 | 0.186 | 0.188 |
| 0.4 | 0.4 | 0.618 | 0.992 | 0.802 | 0.379 | 0.381 |
| 0.6 | 0.6 | 0.785 | 0.996 | 0.901 | 0.579 | 0.581 |
| 0.8 | 0.8 | 0.907 | 0.999 | 0.960 | 0.786 | 0.787 |
| 1.0 | 1.0 | 1.000 | 1.000 | 1.000 | 1.000 | 1.000 |
It was necessary when constructing the mixing grid to fix (Section 3), and we have tested the sensitivity of our results to this assumption by varying the fixed value. The analysis presented in Figure 2 and Figure 3 was performed for the three values , , and with eV. In this experiment the lines of median values of 0.2, 0.4 and 0.6 all changed by at most 0.07 dex in [O III]/H. Hence, we conclude that our results are insensitive to , despite the low values.
6 Conclusions
Mixing between H II region and AGN emission in SDSS galaxies is investigated by explicitly fitting ‘mixing’ models to the data for the first time. Our conclusions are as follows:
-
1.
We demonstrate that most Seyfert-classified spectra in SDSS have the majority of their Balmer line flux originating in H II regions within the fixed fiber aperture, rather than in the NLR itself
-
2.
We show that our results are insensitive to the hardness of the assumed Seyfert ionizing continuum, and find that ionizing spectra peaking at energies of eV result in the most plausible distributions of inferred mixing fractions
-
3.
We provide equations of lines that quantify median ‘mixing levels’ on the [N II] BPT diagram
-
4.
We quantify the contributions to key emission-line fluxes from the model H II and NLR spectra
References
- Abazajian et al. (2009) 3 Abazajian, K. N., Adelman-McCarthy, J. K., Agüeros, M. A., et al. 2009, ApJS, 182, 543
- Baldwin et al. (1981) Baldwin, J. A., Phillips, M. M., & Terlevich, R. 1981, PASP, 93, 5
- Bär et al. (2017) Bär, R. E., Weigel, A. K., Sartori, L. F., et al. 2017, MNRAS, 466, 2879
- Chen et al. (2013) Chen, C.-T. J., Hickox, R. C., Alberts, S., et al. 2013, ApJ, 773, 3
- Constantin et al. (2008) Constantin, A., Hoyle, F., & Vogeley, M. S. 2008, ApJ, 673, 715
- Davies et al. (2014a) Davies, R. L., Kewley, L. J., Ho, I.-T., & Dopita, M. A. 2014a, MNRAS, 444, 3961
- Davies et al. (2014b) Davies, R. L., Rich, J. A., Kewley, L. J., & Dopita, M. A. 2014b, MNRAS, 439, 3835
- Dopita et al. (2014) Dopita, M. A., Scharwächter, J., Shastri, P., et al. 2014, Astronomy & Astrophysics, 566, A41. http://adsabs.harvard.edu/abs/2014A%26A...566A..41D
- Greene & Ho (2005) Greene, J. E., & Ho, L. C. 2005, ApJ, 627, 721
- Greene & Ho (2007) —. 2007, ApJ, 667, 131
- Jones et al. (2016) Jones, M. L., Hickox, R. C., Black, C. S., et al. 2016, ApJ, 826, 12
- Kauffmann & Heckman (2009) Kauffmann, G., & Heckman, T. M. 2009, MNRAS, 397, 135
- Kauffmann et al. (2008) Kauffmann, G., Heckman, T. M., & Best, P. N. 2008, MNRAS, 384, 953
- Kauffmann et al. (2003) Kauffmann, G., Heckman, T. M., Tremonti, C., et al. 2003, MNRAS, 346, 1055
- Kewley et al. (2001a) Kewley, L. J., Dopita, M. A., Sutherland, R. S., Heisler, C. A., & Trevena, J. 2001a, ApJ, 556, 121
- Kewley et al. (2006) Kewley, L. J., Groves, B., Kauffmann, G., & Heckman, T. 2006, MNRAS, 372, 961
- Kewley et al. (2001b) Kewley, L. J., Heisler, C. A., Dopita, M. A., & Lumsden, S. 2001b, ApJS, 132, 37
- Kewley et al. (2005) Kewley, L. J., Jansen, R. A., & Geller, M. J. 2005, PASP, 117, 227
- Khabiboulline et al. (2014) Khabiboulline, E. T., Steinhardt, C. L., Silverman, J. D., et al. 2014, ApJ, 795, 62
- Koss et al. (2011) Koss, M., Mushotzky, R., Veilleux, S., et al. 2011, ApJ, 739, 57
- Lagos et al. (2011) Lagos, C. D. P., Padilla, N. D., Strauss, M. A., Cora, S. A., & Hao, L. 2011, MNRAS, 414, 2148
- Maragkoudakis et al. (2014) Maragkoudakis, A., Zezas, A., Ashby, M. L. N., & Willner, S. P. 2014, MNRAS, 441, 2296
- Mateos et al. (2013) Mateos, S., Alonso-Herrero, A., Carrera, F. J., et al. 2013, MNRAS, 434, 941
- Miller et al. (2003) Miller, C. J., Nichol, R. C., Gómez, P. L., Hopkins, A. M., & Bernardi, M. 2003, ApJ, 597, 142
- Paliya et al. (2018) Paliya, V. S., Ajello, M., Rakshit, S., et al. 2018, ApJ, 853, L2
- Reines & Volonteri (2015) Reines, A. E., & Volonteri, M. 2015, ApJ, 813, 82
- Shirazi & Brinchmann (2012) Shirazi, M., & Brinchmann, J. 2012, MNRAS, 421, 1043
- Sutherland & Dopita (2017) Sutherland, R. S., & Dopita, M. A. 2017, ApJS, 229, 34
- Thomas et al. (2018) Thomas, A. D., Dopita, M. A., Kewley, L. J., et al. 2018, ApJ, 856, 89
- Thomas et al. (2016) Thomas, A. D., Groves, B. A., Sutherland, R. S., et al. 2016, ApJ, 833, 266
- Tremonti et al. (2004) Tremonti, C. A., Heckman, T. M., Kauffmann, G., et al. 2004, ApJ, 613, 898
- Veilleux & Osterbrock (1987) Veilleux, S., & Osterbrock, D. E. 1987, ApJS, 63, 295
- von der Linden et al. (2010) von der Linden, A., Wild, V., Kauffmann, G., White, S. D. M., & Weinmann, S. 2010, MNRAS, 404, 1231
- Wild et al. (2010) Wild, V., Heckman, T., & Charlot, S. 2010, MNRAS, 405, 933
- York et al. (2000) York, D. G., Adelman, J., Anderson, Jr., J. E., et al. 2000, AJ, 120, 1579