The Carnegie-Irvine Galaxy Survey. \@slowromancapvii@. Constraints on the Origin of S0 Galaxies from Their Photometric Structure
Abstract
Using high-quality optical images from the Carnegie-Irvine Galaxy Survey, we perform multi-component decompositions of S0 galaxies to derive accurate structural parameters to constrain physical origin. Many S0s do not host prominent bulges. S0 galaxies have a broad distribution of bulge-to-total ratios and Sérsic indices , with average values of and , qualitatively consistent with the notion that S0s define a parallel sequence with and may have evolved from spiral galaxies. This is further reinforced by the incidence of bars and lenses in S0s, which when compared with the statistics in spirals, supports the idea that lenses are demised bars. However, despite their wide range of prominence, the bulges of S0s form a surprisingly sequence on both the Kormendy and fundamental plane relations. There is no evidence for population dichotomy or other indications of differentiation into classical and pseudo bulges. The properties of S0 bulges show little correlation with , . As the bulges of late-type spirals and S0s are intrinsically different, and environmental effects that may account for such evolution appear to be minimal, we conclude that late-type spirals are not plausible progenitors of S0s. The bulges of S0s likely formed at an early epoch, after which secular processes contributed little to their subsequent evolution.
1 Introduction
S0 galaxies were originally proposed by Hubble (1936) as a hypothetical transitional class to bridge the discontinuity between ellipticals and spirals. In later revisions and extensions of the original Hubble classification sequence (e.g., Sandage, 1961; de Vaucouleurs, 1959), S0s came to be recognized as prominent constituents of the galaxy population. As galaxies transitioning from spirals to featureless spheroids, S0s were traditionally thought to possess huge bulges, a preconception indeed borne out by ample empirical evidence (e.g., Burstein, 1979; Kent, 1985; de Souza et al., 2004). Although some early observations indicated otherwise (Spitzer & Baade, 1951; Sandage et al., 1970; van den Bergh, 1976), the notion that S0s can possess small bulges did not become mainstream. Only recently has the concept of a parallel sequence of S0 galaxies (van den Bergh, 1976) resurfaced, first with the work of Cappellari et al. (2011) and then extensively elaborated by Kormendy & Bender (2012). In such a classification scheme, S0s form a parallel sequence to spirals, one that is ordered by their bulge prominence. S0s do not simply represent a transitional stage between spirals and ellipticals.
A major original impetus for the notion of a parallel sequence came from the realization that some S0s have bulges as small as those in late-type spirals. The early observational evidence was somewhat shaky because it was based on qualitative inspection of photographic plates. Systematic investigations using modern CCD photometry have now significantly strengthened the notion that some S0s do indeed contain small bulges (Laurikainen et al., 2005, 2006, 2007, 2010; Kormendy & Bender, 2012). Kinematic studies independently reach similar conclusions (Williams et al., 2009; Cappellari et al., 2011).
Understanding the place of S0 galaxies within the framework of the Hubble sequence is not simply an exercise in classification: it has important implications for our overall picture of galaxy formation and evolution. The revision of the Hubble sequence to the parallel sequence immediately suggests that S0s are red and dead spirals, which, in turn, raises the issue of what physical processes came into play to shut off their star formation. The morphology-density relation and its changes with redshift offer strong support for the morphological transformation of spirals to S0s: the increase of the S0 fraction toward lower redshift counterbalances the accompanying drop in the spiral fraction, while the elliptical population remains nearly constant (e.g., Butcher & Oemler, 1978; Dressler et al., 1997; Fasano et al., 2000; Smith et al., 2005). The morphology-density relation strongly implicates the environment as the main agent responsible for the formation of S0s (e.g., Dressler, 1980; Cappellari et al., 2011). The ubiquity of lenses and the shortage of bars in S0s compared with spirals also support an evolutionary link between these two classes of galaxies (e.g., Kormendy, 1979; Laurikainen et al., 2009; Li et al., 2017).
The transformation process does not lack candidate mechanisms. Spitzer & Baade (1951) first proposed that galaxy collisions in clusters may be responsible for the loss of interstellar medium of spirals. Later, Gunn & Gott (1972) proposed that gas stripping by the intracluster medium produces S0s. The fading scenario, in which spirals evolve to S0s by losing their gas via ram-pressure stripping and then ceasing star formation, has gained growing support from a variety of observational evidence (e.g., Cayatte et al., 1990; Kenney et al., 2004; Aragón-Salamanca et al., 2006; Barr et al., 2007; Chung et al., 2007; Cortese et al., 2007; Chung et al., 2009; Poggianti et al., 2017) and ever more sophisticated numerical simulations (e.g., Abadi et al., 1999; Quilis et al., 2000; Roediger & Brüggen, 2007; Bekki, 2014; Clarke et al., 2017; Ruggiero & Lima Neto, 2017). Although ram-pressure stripping is a viable mechanism to transform spirals into S0s in clusters, it may not be the full story. The existence of S0s in low-density regions suggests that other factors also matter (e.g., Dressler, 1980; Dressler et al., 1997; Fasano et al., 2000; Helsdon & Ponman, 2003; Wilman et al., 2009; Just et al., 2010; Cappellari et al., 2011).
At the same time, there are counterarguments against the spiral-to-S0 fading story. Burstein et al. (2005) found that S0s have higher -band luminosities than early-type spirals, while the fading scenario predicts the opposite. A number of studies noted that the bulges of S0s are systematically larger than the bulges of spirals (e.g., Burstein, 1979; Dressler, 1980; Kent, 1985; de Souza et al., 2004). Although Laurikainen et al. (2005, 2006, 2007, 2010) somewhat alleviated the tension by revealing that S0s, in fact, have a broad distribution of bulge-to-total ratios, they raised other inconsistencies on the basis of the photometric structural properties of their bulges. From another perspective, highlights the discrepancy between S0s and late-type spirals in terms of their stellar angular momentum and concentration (Querejeta et al., 2015b). Numerous alternative pathways for the evolution of S0s have been proposed, including stellar feedback (Faber & Gallagher, 1976), starvation (Larson et al., 1980; Bekki et al., 2001, 2002; Bekki, 2009), galaxy harassment (Moore et al., 1996, 1998, 1999), mergers (Bekki, 1998; Querejeta et al., 2015a; Tapia et al., 2017), and tidal interactions (Icke, 1985; Byrd & Valtonen, 1990; Bekki & Couch, 2011). Moreover, ram-pressure stripping can still operate in groups, albeit in a more gentle manner (Rasmussen et al., 2006; Kawata & Mulchaey, 2008; Rasmussen et al., 2008, 2012). The diversity of environments in which S0 galaxies are found may preclude us from delineating a tidy picture of their formation. But the imprints of environments on S0s could be inferred from their structural growth. For example, an interesting correlation between central star formation in disk galaxies and environments was found by Kannappan et al. (2004). Therefore, it is worthy of effort to look into how environments might have shaped stellar structure of S0s.
In light of the aforementioned studies, we present measurements of a well-defined sample of S0s selected from the Carnegie-Irvine Galaxy Survey (CGS; Ho et al., 2011) in three aspects: their bulge characteristics, their incidence of bars and lenses, and their frequency in various environments. We perform multi-component image decomposition of the sample following the strategy outlined in Gao & Ho (2017) and confirm that S0 bulges exhibit a broad distribution of their parameters. Comparing the bar fraction and lens fraction of CGS S0s with the statistics in spiral galaxies suggests that lenses are demised bars. While these observations support the picture that S0s evolved from spirals, a major challenge is presented by the evident dearth of pseudobulges in S0s. Various implications are discussed.
2 Sample Definition
The CGS sample is defined by mag and , without any reference to morphology, size, or environment. Details of the observations and data reduction are given in Ho et al. (2011) and Li et al. (2011), and will not be repeated here. Here we focus only on the -band data. The majority of the images are of high quality, in terms of field-of-view (), median seeing (), and median surface brightness depth (26.4 mag arcsec-2).
We begin with CGS galaxies that have HyperLeda (Paturel et al., 2003) morphological type index , complementing with CGS galaxies that fall outside this criterion but that are classified as S0s in the Third Reference Catalogue of Bright Galaxies (RC3; de Vaucouleurs et al., 1991). We also include some possible S0s misclassified as ellipticals, as recognized by Huang et al. (2013) from their detailed decompositions. Finally, we remove all galaxies with inclination angle , in accordance with the selection criteria of our training sample in Gao & Ho (2017). The above procedure results in 94 galaxies, which were individually decomposed following the strategy outlined in Section 3. Detailed examination of the decompositions compels us to remove 32 galaxies from the sample, for a variety of reasons: one galaxy is severely contaminated by too many saturated stars; two do not belong to the formal CGS sample; three do not have available -band images; four are edge-on systems with obvious razor-thin disk, whose previously cataloged inclination angles are clearly inaccurate; 10 are irregular/interacting galaxies or merger remnants; six are considered ellipticals; two are actually late-type disks; and four S0s cannot be reliably decomposed. The final sample of 62 S0s with reliable decompositions is presented in Table 1. Note that detailed fits for four of the objects (NGC 1326, 1411, 1533, and 2784) have been presented in Gao & Ho (2017).
3 Decomposition Strategy
Following Gao & Ho (2017), we employ GALFIT111 https://users.obs.carnegiescience.edu/peng/work/galfit/galfit.html (Peng et al., 2002, 2010) to perform two-dimensional (2D) multi-component decomposition of the CGS S0s. GALFIT is a highly flexible tool that provides many analytic functions, which allow construction of extremely complicated models. However, we only make use of a limited set of its features. We refer readers to Peng et al. (2010) and Section 3.2 of Gao & Ho (2017) for detailed descriptions of the radial and azimuthal functions adopted in this study. In brief, we adopt the Sérsic (1968) function for bulges, the modified Ferrer function for bars, and, by default, the exponential function for disks, although this assumption can vary from case to case. This study always adopts a pure ellipse for the azimuthal function. Other technical details involved in the fitting procedure—error images, mask images, and point-spread function (PSF) images—are described in Gao & Ho (2017). The sky is solved simultaneously with the galaxy model during the fitting (see Appendix B.2 of Gao & Ho, 2017).
Based on the optimal strategy for bulge decomposition investigated in Gao & Ho (2017), we are aware of which parts of the galaxy should be modeled or can be neglected, and of the penalties incurred for ignoring certain parts of the galaxy in model construction. Here we prepare only one optimal model for each galaxy, based on recognition of its principal structural components. In addition to bulges and disks, we model bars, disk breaks, nuclear/inner lenses, and inner rings, but do not model nuclear rings/bars separately because we consider them as part of the photometric bulge. Outer lenses/rings have been shown to be not crucial for measuring accurate bulge parameters, and thus will be ignored. As S0s lack spiral arms, they, too, can be neglected. Unless specifically mentioned in Appendix A, we follow the above guidelines to construct surface brightness models for our sample. The best-fit models of the 62 CGS S0s are shown in Figure 1, and the best-fit parameters are summarized in Table 1.
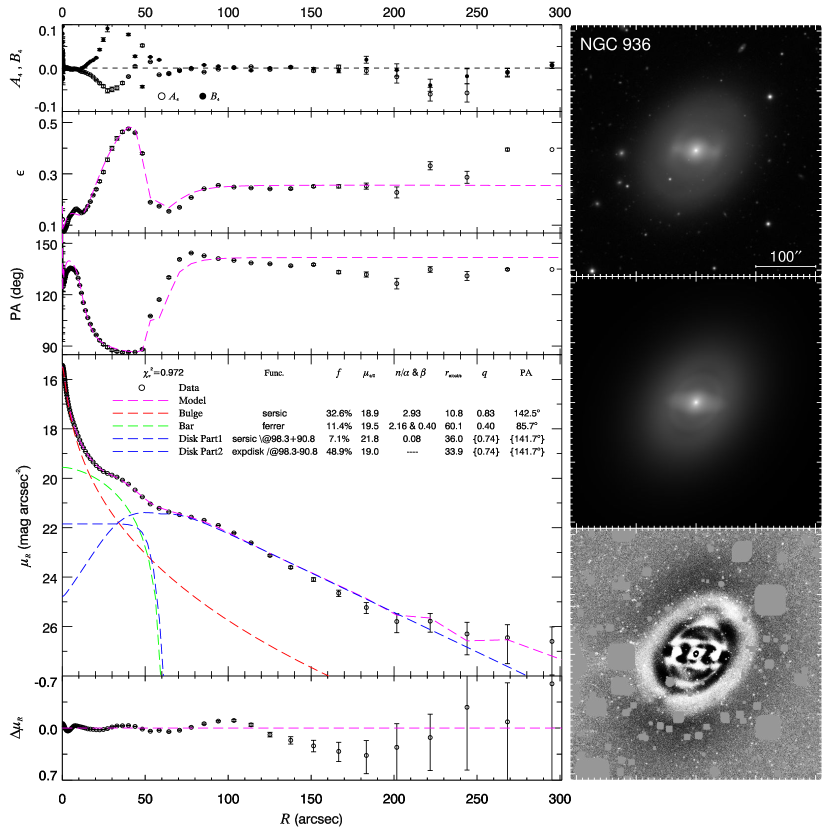
(The complete figure set of 62 images is available in the online journal.)
The error budget of bulge parameters (total magnitude , bulge-to-total ratio , effective surface brightness , Sérsic index , effective radius , and ellipticity ) includes the uncertainties introduced by sky measurements and, more importantly, the uncertainties introduced by model assumptions. We measure the sky-induced uncertainties as variations of the best-fit bulge parameters when perturbing the sky levels around of the best-fit sky levels. An important source of model-induced uncertainty comes from ignoring certain features of the galaxy (e.g., outer lenses and rings). Ignoring these features will induce uncertainties of 0.05 mag, 7.1%, 0.09 mag arcsec-2, 5.8%, 5.3%, and 4.8% for , , , , , and , respectively (Gao & Ho, 2017). Another source of uncertainty stems from the use of different mathematical representations of the same disk surface brightness, which arise when we model disk breaks, lenses, and rings, along with the underlying disk. The typical contribution to the error budget is 0.09 mag, 6.7%, 0.15 mag arcsec-2, 8.0%, 6.9%, and 7.7% for , , , , , and , respectively (Gao & Ho, 2017). The final uncertainties of the bulge parameters in Table 1 represent the quadrature sum of these various sources of uncertainties.
| Name | Scale | Bar/Lens | |||||||||
|---|---|---|---|---|---|---|---|---|---|---|---|
| (mag) | (mag arcsec-2) | () | () | (km s-1) | |||||||
| (1) | (2) | (3) | (4) | (5) | (6) | (7) | (8) | (9) | (10) | ||
| ESO | 221-G026 | 11\@alignment@align.13±0 | 0.534±0.062 | 19.46±0.46 | 5.00±0.65 | 13.48±3.72 | 0.528±0.041 | 3.61 | 135.7±5.1 | ? | |
| ESO | 442-G026 | 12\@alignment@align.21±0 | 0.341±0.024 | 17.71±0.15 | 1.36±0.15 | 3.74±0.26 | 0.175±0.014 | 12.57 | 221.3±19.4 | ? | |
| ESO | 507-G025 | 12\@alignment@align.67±0 | 0.185±0.026 | 18.16±0.17 | 1.71±0.15 | 3.98±0.33 | 0.348±0.028 | 10.53 | 260.2±9.9 | N | |
| IC | 2006 | 11\@alignment@align.94±0 | 0.329±0.101 | 20.05±0.69 | 4.02±0.60 | 9.26±3.54 | 0.100±0.009 | 5.56 | 123.8±2.3 | L | |
| IC | 2035 | 13\@alignment@align.70±0 | 0.109±0.008 | 14.69±0.15 | 0.81±0.07 | 0.57±0.04 | 0.297±0.023 | 4.80 | 106.7±2.3 | B | |
| IC | 4329 | 12\@alignment@align.07±0 | 0.226±0.002 | 20.11±0.11 | 3.22±0.11 | 9.94±0.75 | 0.182±0.010 | 19.18 | 295.9±6.0 | W | |
Note. — Column 1: Galaxy name. Column 2: Total -band magnitude. Column 3: Bulge-to-total ratio. Column 4: Surface brightness at the effective radius. Column 5: Sérsic index. Column 6: Effective radius. Column 7: Ellipticity. Column 8: Scale to convert from arcmin to kpc. Column 9: Central stellar velocity dispersion. Column 10: Flag for the presence or absence of a bar/lens: = definitely barred; W = weakly barred; N = no bar or lens; L = no bar but lens present; ? = uncertain.
(Table 1 is published in its entirety in machine-readable format. A portion is shown here for guidance regarding its form and content.)
4 Results
4.1 The Scaling Relations of Bulges
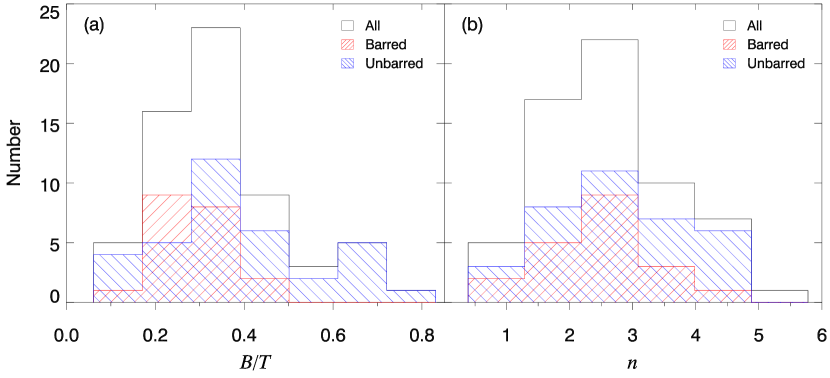
As the structural parameters of the bulge (, , and ) are internally correlated, we only investigate the distribution of and Sérsic indices (Figure 2). The bulges of our sample of S0 galaxies exhibit a wide range of bulge prominence and light concentration. Their mean is 0.34, with a standard deviation of 0.15; their mean is 2.62, with a standard deviation of 1.02. The fraction of S0s that have a bulge prominence comparable to that of typical late-type spirals, , is 6.5%. We confirm the results of the study of Laurikainen et al. (2005) that S0s are less bulge-dominated than previously thought (e.g., from de Souza et al., 2004; see Table 8 in Laurikainen et al., 2005 for a compilation of previous S0 measurements). We should note that the methodology of image decomposition employed by us or by Laurikainen et al. (2005) differs in detail from those of previous studies, both in terms of technique (1D vs. 2D) and choice of surface brightness models (two-component vs. multi-component). The is significantly reduced when bars and other secondary morphological features (e.g., lenses) are properly isolated from the bulge.
Figure 2 examines separately the distributions of bulge parameters for barred and unbarred systems. The barred S0s are less bulge-dominated and show a narrower distribution of (222Note that we express statistics of distributions as meanstandard deviation throughout the text.) compared with the unbarred subsample (). This, again, is in line with the measurements of Laurikainen et al. (2010, 2013). A Kolmogorov-Smirnov test finds that the difference in between the two subsamples is statistically significant, with a probability for the null hypothesis that the two subsamples are drawn from the same parent distribution. In term of Sérsic indices, the differences between the two subsamples are more subtle ( for barred S0s; for unbarred S0s), and not statistically significant ().
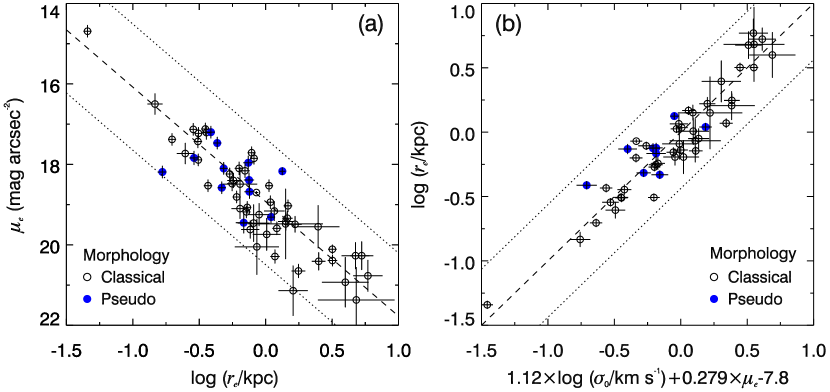
The distribution of structural parameters on the scaling relations of bulges are particularly useful for distinguishing their physical nature (Kormendy & Kennicutt, 2004). We derive the Kormendy (1977) relation of S0 bulges by minimizing the quantity
| (1) |
where and are the coefficients of the Kormendy relation and denote uncertainties. The best-fit relation is (Figure 3a)
| (2) |
with a scatter in of . Similarly, we derive the fundamental plane relation for the bulges with central stellar velocity dispersions () available from Ho et al. (2011), which were assembled from HyperLeda and were originally compiled from various literature. Minimizing the quantity
| (3) |
where , , and are coefficients of the fundamental plane relation , the best-fit relation is (Figure 3b)
| (4) |
The scatter in is .
Both scaling relations are uniformly tight across a large dynamical range in . Although pseudobulges are expected to be outliers in these scaling relations (e.g., Kormendy & Kennicutt, 2004; Gadotti, 2009; Fisher & Drory, 2010), and previous studies indicate that at least some S0s host pseudobulges (Laurikainen et al., 2005, 2006, 2007), we are hard-pressed to identify such a population in our sample, at least on the basis of the Kormendy and fundamental plane relations. To investigate this point further, we attempt to identify pseudobulge candidates in our sample from careful inspection of their images, color maps, color profiles, isophotal analysis, and residual images from the decomposition. We look for fine structures in the bulge region suggestive of a disky nature (e.g., nuclear rings/bars) or signatures of recent star formation (e.g., distinctly blue centers compared with their surroundings). However, the minority of S0 bulges with pseudobulge characteristics (blue symbols in Figure 3) appear indistinguishable from the rest of the majority. We further look into possible dependence of the residuals in the two scaling relations on properties considered to be related to the pseudobulge phenomenon. Motivated by previous studies that suggest that pseudobulges have low Sérsic indices (; Fisher & Drory, 2008) and small bulge-to-total ratios (Kormendy & Ho 2013), we group the sample into several bins of and and plot their residuals with respect to the best-fit Kormendy relation and the fundamental plane (Figure 4). It is obvious that there is no clear systematic dependence of the residuals on bulge properties. We also look for systematic trends with galaxy luminosity (absolute -band magnitude ), but do not find any either. The S0 bulges behave as a uniform population in the Kormendy relation and the fundamental plane relation, despite the fact that they show broad characteristics in terms of and .

4.2 Bars and Lenses
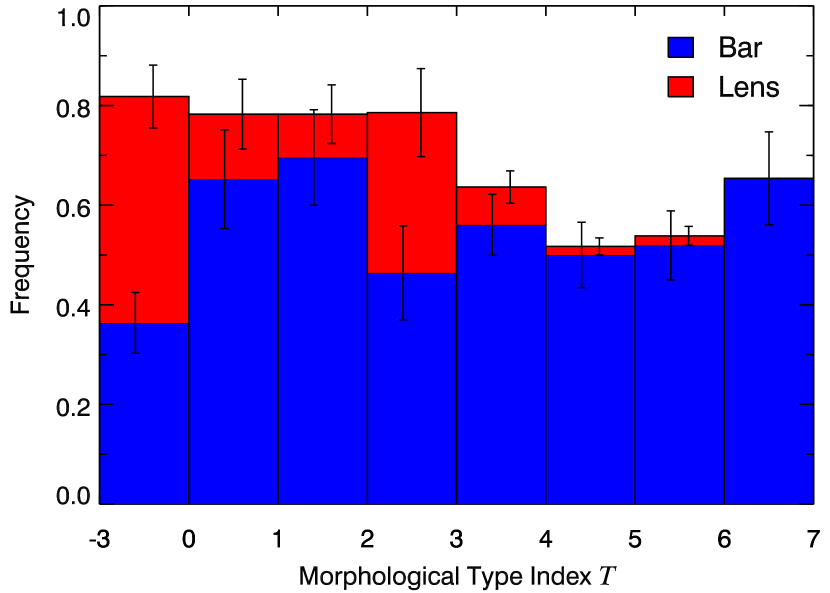
Being an exclusively disk phenomenon, bars potentially provide another link to relate S0s to spirals. A simple fading scenario, however, probably cannot fully account for the evolution of spirals into S0s, for S0s are known to possess fewer bars but more lenses than spirals (Laurikainen et al., 2009). Several lines of evidence, including their similarity in size and stellar content, led Kormendy (1979) to propose that lenses are dissolved bars. Later theoretical developments showed that during the course of bar-driven secular evolution gas-rich galaxies can build up sufficiently massive central concentrations that can weaken and even dissolve the bar (e.g., Sellwood & Wilkinson, 1993; Buta & Combes, 1996; Combes, 1996; Kormendy & Kennicutt, 2004; Shen & Sellwood, 2004). According to Kruk et al. (2018), the host galaxies of lenses have similar properties as those hosting bars. If lenses are indeed evolved bars, they may help to bridge the gap between S0 and spiral statistics. To test this scenario, we measure the bar fraction and lens fraction of the CGS S0s, and compare them with the bar fractions of CGS spirals. The identification of bars and lenses for the S0s are given in Table 1. The CGS S0 sample contains a bar fraction of and a lens fraction of . Thus, the combined fraction of S0 galaxies hosting either a bar or a lens is . We also quantify the bar fraction of non-edge-on () CGS spirals (morphological type index ) by inspecting their images, isophotal properties, and structure maps. Figure 5 shows the bar and lens333 fraction as a function of Hubble type. The bar fraction among S0s is significantly lower than that of spirals (), but their lens fraction is much larger than that of spirals (). Interestingly, once lenses are taken into consideration, the statistics of S0s become compatible with those of early-type spirals (Sa–Sb). It is worth noting that the bar+lens fraction of S0s is considerably larger than that of late-type spirals ().
The bar fraction of S0s quoted here is lower than that given by Laurikainen et al. (2009; ) or Li et al. (2017; ), the latter based on CGS itself. We attribute these differences to our conservative identification of barred galaxies—only definitive cases are classified as barred. For example, the buckled bars in Li et al. (2017) might be classified as lenses in this study, because they are less flattened compared with those that are not buckled. On the other hand, possibly missing weak bars would be included among the statistics for lenses, such that the bar+lens fraction should be a more robust indicator of large-scale nonaxisymmetric structure.
4.3 Environments
Most (83%) of our S0s reside in groups. In the context of the entire CGS sample, the frequencies of S0s in the field, groups, and are , , and , respectively. Note that the
It is almost unavoidable to think about S0s in the context of environments. As mentioned in Section 1, many studies suggest that environmental processes play an important role in the course of S0 production. Ho et al. (2011) provide two quantitative indicators of local environment for CGS: (1) the tidal parameter
| (5) |
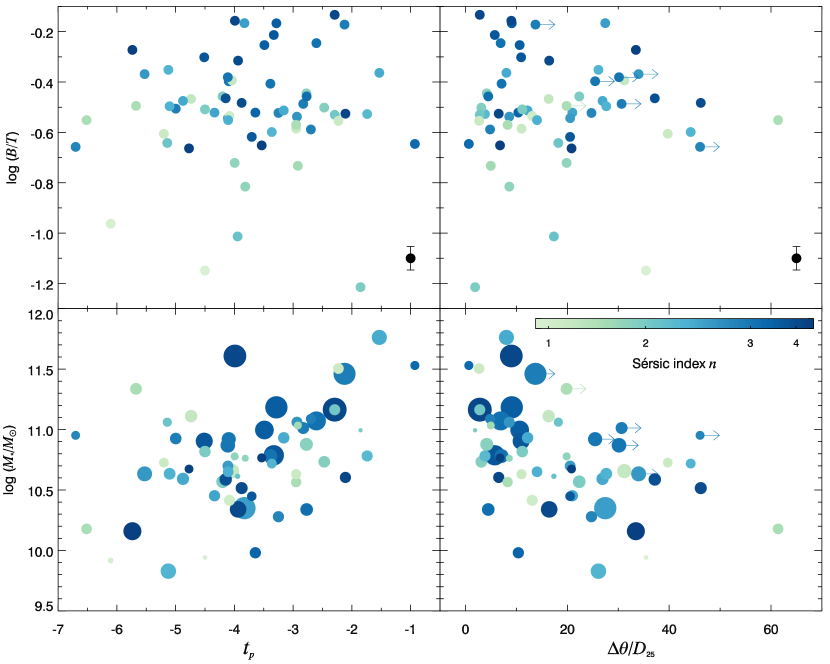
where and are the mass and size of the galaxy in question, and and are the mass and projected separation of neighbor ; (2) the projected angular separation, , in units of the optical -band diameter , to the nearest neighboring galaxy having an apparent magnitude brighter than mag. Both parameters are calculated for neighbors within a radius of 750 kpc and with systemic velocity within km s-1. The top row of Figure 6 shows the dependence of and on these measures of local environment. Although the correlations are statistically weak, there is a mild tendency for S0s with large or to reside preferentially in denser environments. Namely, for S0s with , 89% of them have ; for S0s with , 75% of them have . Similarly, 78% of S0s with have , and 63% of S0s with have .
The interpretation of these trends, however, is complicated by the known strong dependence of stellar mass on environment. The most massive galaxies preferentially reside in dense environments (Calvi et al., 2013), as confirmed in the bottom two panels of Figure 6. The stellar masses were derived from total magnitudes from Ho et al. (2011) and mass-to-light ratios following Equation (9) in Kormendy & Ho (2013), utilizing colors from CGS (Li et al., 2011). We color-code the symbols according to their bulge and adjust the symbol size based on . At a fixed narrow range in (a horizontal cut), we find no compelling evidence for systematic variation of or with . Therefore, we conclude that the trends between bulge properties and .
5 Implications
5.1 The Surprising Homogeneity of Bulges in S0s
As with Laurikainen et al. (2005), we find that the bulges of S0s exhibit a broad distribution of and , in qualitative agreement with the notion that S0 galaxies form a parallel sequence with spiral galaxies. Are S0s simply defunct spirals? Closer inspection exposes some tensions with this proposition. In particular, while the more massive bulges of bulge-dominated S0s do bear a close resemblance to the bulges of early-type spirals, the characteristically smaller bulges of lower mass S0s do not obey the same scaling relations as the bulges of late-type spirals (Laurikainen et al., 2010). The bulges of late-type spirals—often of the pseudobulge variety—appear as low- outliers in the Kormendy relation, whereas the comparably sized bulges of S0s do not (see their Figure 2). If late-type spirals were to evolve to become late-type (low-) S0s, they would have to make their bulges denser (higher ) and more compact (smaller ) to conform to the Kormendy relation of S0 galaxies. No simple fading scenario can transform the population of small (pseudo) bulges in late-type spirals to the bulges currently residing in low-mass S0s. Our present analysis arrives at a similar conclusion. While we have not yet completed the decomposition of the full parent sample of CGS galaxies to perform a proper comparison between the bulges of S0s and the bulges of spirals analyzed in the same manner, the Kormendy relation shown in Figure 3a implies that the bulges of S0s constitute a homogeneous population, one that leaves little room for a second population. This conclusion stands in sharp contrast to previous work that supports the existence of pseudobulges in S0s (Laurikainen et al., 2005, 2006, 2007). They used photometric () and kinematic features (rotation support) to identify pseudobulges. If we adopt a similar approach to identify pseudobulges using the criterion , we would designate as pseudobulges. Barway et al. (2007, 2009) and Vaghmare et al. (2013) classify pseudobulges based on distributions of bulge parameters in various scaling relations (e.g., the bulge-disk correlation, the Kormendy relation, the photometric plane). They conclude that pseudobulges are prevalent in galaxies with absolute -band magnitudes fainter than . As the majority (76%) of the CGS S0s lie below this critical luminosity threshold, many should qualify as pseudobulge hosts. However, no such population of pseudobulges stands out in our scaling relations.
Part of the difficulty lies in the fact that no single observational criterion uniquely defines the pseudobulge phenomenon (see Supplemental Information in Kormendy & Ho, 2013). In the current literature, the most widely adopted criterion for recognizing pseudobulges is a low Sérsic index (; Fisher & Drory, 2008), but for our present sample, despite our enormous effort to quantify measurement uncertainties (Gao & Ho, 2017), the Sérsic index does not appear to provide much discriminating power. Nearly one-third of our sample have , and yet none of these objects, which would ordinarily be regarded as pseudobulges, stands out in any noticeable manner in either the Kormendy or the fundamental plane relations (Figures 3 and 4). Not all galaxies with small have pseudobulges (Kormendy & Ho, 2013), but essentially all pseudobulges have (Gadotti, 2009; Kormendy, 2016). This value coincides with the mean of our sample, and we expect that at least some of these disk-dominated galaxies to contain pseudobulges. This echoes similar conclusions reached by Costantin et al. (2017) for a small sample of late-type spirals. As discussed in Section 4.1, the subset of bulges with disky morphology (blue symbols in Figure 3) is also unremarkable from the rest of the sample lacking disky features. Closer examination of these 12 pseudobulge candidates reveals that in all but three (NGC 1386, NGC 4802, NGC 4984) the disky features are embedded in a structure very much resembling a classical bulge once the nuclear substructure is properly considered in the image decomposition. A good example is NGC 1326. Gao & Ho (2017) show that properly masking the nuclear ring in this galaxy boosts its bulge Sérsic index from 1.29 to 2.01. Thus, morphological features such as disks do not reliably signify the overall photometric structure of the bulge (see also Fisher et al., 2009).
5.2 Formation Mechanisms of S0s
If S0s arise from the simple fading of spirals, the abundant pseudobulges of late-type spirals should have been preserved among lower mass S0s of relatively moderate to low . This population of pseudobulges appears conspicuously missing in S0s. To reconcile with the scenario that S0s derive from faded spirals, some additional processes must operate to alter the structure of their bulges so that they become denser (higher ) and more compact (smaller ), in order to conform to the fundamental plane relations (Figure 3). Candidate physical mechanisms include tidal interactions, minor mergers, and galaxy harassment, which may contribute to bulge growth via non-secular processes (e.g., nuclear starbursts and dissipationless mergers with satellites) that, at the same time, can erase the disky origin of the bulges. Whether or not this can actually be realized needs to be verified with numerical simulations.
However, if spirals transform to S0s via this pathway, we would expect the bulge properties of S0s to show some dependence on . Figure 6 argues against this possibility, . An alternative, more radical possibility is that pseudobulges simply never existed in S0s, that they host exclusively classical bulges. Most S0s are not faded spirals, and their bulges formed from a fundamentally different channel, at an earlier epoch. Bulges in early-type disk galaxies (such as S0s) may have been in place since (Graham et al., 2015), when clumps formed out of turbulent disks migrate inward and merge to contribute to bulge growth (e.g., Genzel et al., 2008; Bournaud, 2016; Tadaki et al., 2017), although the contribution from mergers to bulge buildup may still have been substantial (e.g, Toomre, 1977; Hopkins et al., 2010). Disky features created via later secular evolution would not be able to alter significantly the physical properties of the preexisting bulges.
This scenario of bulge formation and galaxy evolution is still incomplete. Outstanding questions remain. How did the early-formed compact bulges of S0s grow their disks, and how did their classical bulges remain so pristine against subsequent secular evolution of the disks? How were the thin and thick disks observed at assembled? Are the ubiquitous thick disks descendants of clumpy disks (e.g., Elmegreen & Elmegreen, 2006; Bournaud et al., 2009)? If bulges can naturally arise out of the clumpy disks without mergers, why did present-day late-type spirals and pure disk galaxies (e.g., Kormendy & Kennicutt, 2004; Sachdeva & Saha, 2016) fail to assemble noticeable classical bulges at that epoch? These issues deserve further investigation but are certainly beyond the scope of our study.
To summarize this and the preceding section: our photometric study of S0 bulges casts doubt on the idea that present-day spirals are the progenitors of S0 galaxies. Our argument is based mainly on the absence of pseudobulges in S0s, as judged by the Kormendy and fundamental plane relations of their bulges. The evidence is most striking for less massive, more disk-dominated systems, where pseudobulges usually dominate, but we cannot preclude the possibility that the phenomenon extends to the entire S0 class. Querejeta et al. (2015b) have reached similar conclusions on the basis of stellar angular momentum and concentration measurements from the CALIFA survey.
5.3 Lenses May Be Dissolved Bars
The bar fraction of the CGS S0s is significantly lower than that of spirals. However, combining the statistics of bars and lenses in S0s greatly reduces the difference. The bar+lens fraction of S0s (81%) agrees well with the bar fraction of spirals of early to intermediate type, but is considerably larger than that of late-type spirals (). This independently supports our suggestion that late-type spirals are not plausible progenitors of S0s.
The dearth of bars in S0s can be understood as the consequence of bar-driven secular evolution, during which bars self-destroy after the build-up of a sufficiently large central mass condensation. Lenses may be the evolved remnants of bars. In accordance with this expectation, observations show that bars in massive early-type disks tend to be more buckled (Li et al., 2017) and exhibit weaker bar torques (Laurikainen et al., 2007). If the assumption that lenses in S0s represent defunct bars is true, then major mergers could not have played a major role in their recent evolution, lest the slow, secular processes of bar evolution—an inherently disk phenomenon—be disrupted. Of course, the very existence of a prominent large-scale disk in S0s, too, precludes the possibility of much recent dynamical violence. We acknowledge the possibility that stellar disks can be rebuilt from gas-rich mergers (e.g., Wang et al., 2015; Athanassoula et al., 2016; Sparre & Springel, 2017), but even if this were true, the merger event does not directly participate in the transformation of spirals to S0s but rather predates it.
The evolutionary link between bars and lenses, it should be stressed, is in no way settled. Athanassoula (1983) suggested that lenses can arise from disk instabilities in a similar way as bars do, with the initial velocity dispersion of the disk being a main determinant in whether a bar or a lens appears. Bosma (1983) proposed that lenses form as a result of truncation of star formation. Stable bars generally form easily in numerical simulations, stable, but few studies can track the entire process of a bar evolving to a lens (but see Bournaud & Combes, 2002). Most of observational evidence relating bars to lenses (e.g., Kormendy, 1979; Laurikainen et al., 2009; Kruk et al., 2018) is circumstantial, including ours. More effort is needed to complete this picture.
5.4 Preprocessing of S0s in Groups
Nevertheless, studies apart from ours report S0 fractions in groups as large as those in clusters, both at (Helsdon & Ponman, 2003; Wilman et al., 2009) and at (Wilman et al., 2009). S0 fractions evolve more rapidly in groups (Just et al., 2010), and it is likely that a substantial fraction of S0s completed their morphological transformation before they enter clusters.
What physical mechanisms are responsible for producing S0s in groups? A major difference between group environment and cluster environment is that galaxies in groups are more likely to merge and are less influenced by the intergalactic medium. The popularly discussed process of ram-pressure stripping should still operate in groups to some extent, but whether the intragroup medium is dense enough to strip significant amounts of disk gas is in question (e.g., Rasmussen et al., 2006). Transformation of spirals into S0s by major mergers seems unlikely, as discussed in Section 5.3. By contrast, minor mergers may be a plausible candidate to accelerate gas consumption and feed central black hole accretion (Kaviraj, 2014), either by triggering disk instabilities or by accretion of counter-rotating gas that facilitates gas inflow. However, truncation of gas resupply is needed to keep the galaxy quenched. Ram-pressure stripping of the hot halo gas has been shown to be possible even in small groups, thus providing a possible explanation (Bekki, 2009).
Although Figure 6 suggests that environmental processes do not play a significant role in building the bulges of S0 galaxies, they might affect their disks (e.g., Cayatte et al., 1990). Galaxy disks come in three types, depending on the shape of their radial profile (Pohlen & Trujillo, 2006; Erwin et al., 2008): Type I disks have a single, pure exponential profile; Type II disks have a main exponential profile that downturns to a steeper profile at large radii; Type III disks show an upturn at outer radii. Li et al. (2011) found that the fraction of Type \@slowromancapi@ disk profiles is nearly constant across the Hubble sequence, while the disks of early-type galaxies have a deficit of Type \@slowromancapii@ profiles but an excess of the Type \@slowromancapiii@ variety compared with late-type systems. The disk profiles of S0s depend on environment: Virgo cluster S0s lack Type \@slowromancapii@ disks but have more Type \@slowromancapi@ disks compared with field S0s (Erwin et al., 2012). These trends imply that the formation of S0s may involve transformation of their disks through various environmental processes (e.g., Clarke et al., 2017). We will address this issue in a companion paper (H. Gao et al. 2018, in preparation).
While this section mainly focuses on group-related physical processes, we do not intend to exclude the possibility that S0s can be produced in other environments. Most of the above discussion applies to clusters as well. For instance, stronger ram-pressure stripping and high-speed encounters make galaxies more vulnerable to tidal interactions. Minor mergers and tidal interactions, albeit less efficient in low-density environments, can also account for the production of the minority of S0s observed in the field.
6 Summary
To shed light on the formation mechanism of S0 galaxies, we present a set of homogeneous measurements of the optical structural parameters of the bulges of a well-defined sample of 62 S0 galaxies selected from CGS, based on high-quality, detailed two-dimensional image decomposition. We also quantify their frequency of bars and lenses, as well as their environments. The bulges of S0 galaxies show a broad distribution of bulge-to-disk ratios (; ) and Sérsic indices (; ), qualitatively consistent with the notion that S0s define a parallel sequence similar to spiral galaxies. However, unlike spirals, the S0s in our sample show little evidence for pseudobulges. The bulges define a uniform, homogeneous sequence on the Kormendy and fundamental plane relations. S0s have fewer bars but more lenses than spirals, suggesting that lenses may be dissolved bars. If so, this limits the role that major mergers could have played in the recent evolution of S0s. S0s likely were preprocessed and completed their transformation in groups.
Appendix A Notes on Individual Galaxies
ESO 221-G026: The galaxy is classified as an elliptical in both HyperLeda and RC3, but Huang et al. (2013) discovered some substructures in it. The galaxy is likely to be an edge-on system with a thin and a thick disk, which we provisionally denote as a lens and a disk in its decomposition (see Figure 1.1). Since its bar/lens identification is not reliable (flagged as “?” in Table 1), we do not take it into account when calculating bar/lens fraction.
ESO 442-G026: The galaxy is likely to be an edge-on system with a thin and a thick disk, which we provisionally denote as a lens and a disk in its decomposition (see Figure 1.2). Since its bar/lens identification is not reliable (flagged as “?” in Table 1), we do not take it into account when calculating bar/lens fraction.
ESO 507-G025: The galaxy is classified as an elliptical in HyperLeda but as an S0 in RC3. We recognize a blue and dusty region around the galaxy center (), and model it as an extra disk component. The dust lanes are masked during the fitting.
IC 2006: The galaxy is classified as an elliptical in HyperLeda but as an S0 in RC3, and Huang et al. (2013) discovered some substructures in it. It has a nuclear lens and an inner lens.
IC 2035: In addition to an extremely small bulge, the galaxy hosts a short bar, two lenses, and an underlying disk that exhibits different orientation. The inner lens is difficult to model unless the outer lens is modeled simultaneously.
IC 4329: The galaxy is weakly barred. There is no disk break associated with the weak bar. We need to fix some parameters of the bar component to ensure a reasonable fitting.
IC 4991: A ring-like pattern shows up on the residual image. As we are not able to identify a realistic ring structure and are unsure about its physical nature, we attribute this pattern to artifacts and do not model it.
IC 5267: The galaxy has an inner disk whose surface brightness profile is reminiscent of a lens. An outer ring is visible on the residual image. The dust lanes across the bulge is masked during the fitting.
NGC 254: The galaxy has an inner lens and an outer ring. Inside , we find fine structures indicative of the presence of a nuclear ring and a nuclear bar. This galaxy was used in Gao & Ho (2017) to illustrate that the outer lenses/rings can be ignored for the purposes of bulge decomposition. Here we present the full details of its decomposition, with the outer ring included in the model.
NGC 584: The galaxy is classified as an elliptical in both HyperLeda and RC3, but is recognized as an S0 in Huang et al. (2013). It has a nuclear lens and an inner lens.
NGC 936: The galaxy has a bar that is enclosed by an inner ring. Its structural layout is similar to NGC 1533.
NGC 1201: The galaxy contains an inner lens and an outer lens. But unlike normal cases with two lenses of different sizes, the inner lens fills the outer lens in one dimension in this case. Therefore, we also model the outer lens to avoid potential bias of bulge parameters. A possible outer ring is visible on the residual image. There is a nuclear bar with a size of and a PA .
NGC 1302: This is a barred galaxy with an inner ring and an outer ring. This galaxy was used in Gao & Ho (2017) to illustrate that the outer lenses/rings can be ignored for the purposes of bulge decomposition. Here we present the full details of its decomposition, with the outer ring included in the model.
NGC 1326: The galaxy has a bar, a nuclear ring, an inner ring, and an outer ring. It is part of the training sample presented in Gao & Ho (2017). Here we show the decomposition results that include the inner and outer ring, with the nuclear ring unmasked (Model3 in their Table 8). Note that the uncertainties are different from those presented in their Table 8, since we include the model-induced uncertainties in this study.
NGC 1380: The galaxy is likely to be an edge-on system with a thin and a thick disk, which we provisionally denote as a lens and a disk (see Figure 1.15). Since its bar/lens identification is not reliable (flagged as “?” in Table 1), we do not take it into account when calculating the bar/lens fraction. The “lens” component is not perfectly modeled by the Sérsic function. The dust lane running through the bulge is masked.
NGC 1386: The galaxy has a Type \@slowromancapii@ disk, on which spiral dust lanes are visible. We tried to mask the majority of the dust lanes. The bulge is distinctly blue compared to the disk.
NGC 1387: The galaxy is barred and its disk is broken at the bar radius. The nuclear ring is readily recognizable in the residual pattern and the color map.
NGC 1400: The galaxy is classified as an elliptical in HyperLeda but as an S0 in RC3. We recognize a lens at . The dust lanes are masked during the fitting.
NGC 1411: The galaxy has a nuclear lens and an inner lens. It is part of the training sample presented in Gao & Ho (2017). Here we show the decomposition results of the model that includes the two lenses (Model3 in their Table 2). Note that the uncertainties are different from those presented in their Table 2, since we include the model-induced uncertainties in this study.
NGC 1527: The galaxy has an inner lens and a weak outer lens.
NGC 1533: The galaxy is barred and its disk is broken roughly at the bar radius. A ring-like pattern in the central 10″ implies the presence of a barlens—face-on version of a boxy/peanut bulge. This galaxy is part of the training sample presented in Gao & Ho (2017). Here we show the decomposition results of Model2 in their Table 7. Note that the uncertainties are different from those presented in their Table 7, since we include the model-induced uncertainties in this study.
NGC 1537: The galaxy is classified as an elliptical in HyperLeda but as a weakly barred S0 in RC3. We recognize it as an S0 that has a nuclear lens and an inner lens.
NGC 1543: The galaxy has a nuclear bar, a large-scale bar, an inner lens/ring, and an outer ring.
NGC 1553: The galaxy has a nuclear lens and an inner lens/ring. Thus, its model construction is similar to that of NGC 1411.
NGC 1574: A bright foreground star is sitting on top of the galaxy disk. The galaxy has a bar that is embedded in a lens. An outer ring is only visible on the residual image.
NGC 1726: There are dust lanes near the galaxy center, and we mask them during the fitting.
NGC 1947: There are many field stars throughout the image and dust lanes across the bulge.
NGC 2217: The galaxy has a bar, an inner and an outer ring. The model includes all these features, because it is difficult to achieve reasonable fits to the bar and the inner ring without the outer ring in the model. A nuclear ring with a size of is visible in the residual pattern.
NGC 2640: The galaxy is weakly barred, and the disk is broken at the bar radius. A large number of foreground stars are projected on top of the galaxy.
NGC 2695: The galaxy has an inner lens.
NGC 2698: The galaxy is likely to be an edge-on system with a thin and a thick disk, which we provisionally denote as a lens and a disk in its decomposition (see Figure 1.31). Since its bar/lens identification is not reliable (flagged as “?” in Table 1), we do not take it into account when calculating bar/lens fraction.
NGC 2781: The galaxy has a nuclear ring, an inner lens/ring, and an outer ring. We do not find any signature of a bar.
NGC 2784: The galaxy has an inner lens and an outer lens. It is part of the training sample presented in Gao & Ho (2017). Here we show the decomposition results of Model3 in their Table 3. Note that the uncertainties are different from those presented in their Table 3, since we include the model-induced uncertainties in this study.
NGC 2983: The galaxy is barred, and its disk is broken at the bar radius. Its model construction is similar to NGC 1533.
NGC 3056: The galaxy has an inner lens/ring. The residual pattern seems to suggest the presence of a nuclear lens, but we do not find significant signatures of substructures inside from inspection of its image and isophotal analysis. So we do not pursue further refinements of the model.
NGC 3100: The galaxy has two lenses, but their configuration is unlike that of a typical inner-outer lens configuration. One lens fills the other in one dimension; therefore, we model the two lenses together. There are dust lanes near the bulge, which we mask during the fitting.
NGC 3108: This is an interesting case: a huge classical bulge is assembling a diffuse disk around itself (Hau et al., 2008).
NGC 3271: Fortunately we do not need to deal with the disk break associated with the bar, as the bulge is well embedded in the thick bar. The circular dust lane at the galaxy center is masked during the fitting. We find fine structures that suggest the presence of a nuclear bar roughly aligned with the large-scale bar.
NGC 3892: This barred galaxy has an inner ring and an outer ring. In addition, we need to include a compact nucleus, which is modeled with a PSF component, or else the Sérsic index of the bulge would be unrealistically large.
NGC 3904: The galaxy is classified as an elliptical in both HyperLeda and RC3, but is recognized as a possible S0 in Huang et al. (2013). It has two lenses, one filling the other in one dimension. We model both lenses simultaneously.
NGC 4024: The galaxy is barred, and its disk break at the bar radius is weak. Its model construction is similar to NGC 1533.
NGC 4033: The galaxy is classified as an elliptical in both HyperLeda and RC3, but is recognized as a possible S0 in Huang et al. (2013). It has a nuclear lens.
NGC 4373A: The galaxy is likely to be an edge-on system with a thin and a thick disk, which we provisionally denote as a lens and a disk in its decomposition (see Figure 1.43). Since its bar/lens identification is not reliable (flagged as “?” in Table 1), we do not take it into account when calculating bar/lens fraction. The dust lane running through the bulge is masked during the fitting.
NGC 4546: The galaxy is likely to be an edge-on system with a thin and a thick disk, which we provisionally denote as a lens and a disk in its decomposition (see Figure 1.44). Since its bar/lens identification is not reliable (flagged as “?” in Table 1), we do not take it into account when calculating bar/lens fraction.
NGC 4684: We attribute the lens-like structure with a size of as the bulge. Otherwise, the galaxy would have . The compact nucleus is modeled as a PSF component. The central dust lane is masked during the fitting.
NGC 4697: The galaxy is classified as an elliptical in both HyperLeda and RC3, but is recognized as an S0 in Huang et al. (2013). The galaxy is likely to be an edge-on system with a thin and a thick disk, which we provisionally denote as a lens and a disk in its decomposition (see Figure 1.46). Since its bar/lens identification is not reliable (flagged as “?” in Table 1), we do not take it into account when calculating bar/lens fraction.
NGC 4802: The galaxy hosts a dusty but overall blue bulge, which is indicative of ongoing star formation. In addition, we recognize a nuclear lens and an inner lens. We mask the dust lanes around the bulge. The compact nucleus is modeled using a PSF component.
NGC 4825: The galaxy is classified as an elliptical in HyperLeda but as an S0 in RC3. The central dust lane running through the bulge is masked during the fitting.
NGC 4856: The galaxy is relatively edge-on, but its bar is still readily recognized. Its disk is broken at the bar radius.
NGC 4984: The galaxy has an inner lens and an outer ring. The bulge is distinctly blue compared with the lens and the disk. This galaxy was used in Gao & Ho (2017) to illustrate that the outer lenses/rings can be ignored for the purposes of bulge decomposition. Here we present the full details of its decomposition, with the outer ring included in the model.
NGC 5026: The galaxy has a bar that is enclosed by an inner ring. An outer ring is visible on the residual image.
NGC 5266: We mask the central circular dust lanes along the minor axis of the galaxy.
NGC 5333: The galaxy has a nuclear lens and an inner lens.
NGC 6673: The galaxy is classified as an elliptical in HyperLeda but as an S0 in RC3, and is recognized as a possible S0 in Huang et al. (2013). It has a nuclear lens and an inner lens.
NGC 6684: The galaxy has a bar, an inner ring, and an outer ring/lens. A nuclear bar embedded in the bulge is roughly perpendicular to the large-scale bar.
NGC 6893: The galaxy has an inner lens and an outer lens. This galaxy was used in Gao & Ho (2017) to illustrate that the outer lenses/rings can be ignored for the purposes of bulge decomposition. Here we present the full details of its decomposition, with the outer included in the model.
NGC 6942: The galaxy is barred and shows a disk break at . Spiral patterns are visible on the residual image, but they are quite weak and can be ignored.
NGC 7049: The galaxy has a lens. The circular dust lane around the bulge is masked during the fitting.
NGC 7079: The galaxy has a bar and shows a disk break at .
NGC 7144: The galaxy is classified as an elliptical in both HyperLeda and RC3, but is recognized as an S0 in Huang et al. (2013). It has a nuclear lens and an inner lens.
NGC 7192: The galaxy is classified as an elliptical in both HyperLeda and RC3, but is recognized as an S0 in Huang et al. (2013). It has a nuclear lens and an inner lens.
NGC 7377: The galaxy has a nuclear lens and an inner lens. The dust lanes are masked during the fitting.
References
- Abadi et al. (1999) Abadi, M. G., Moore, B., & Bower, R. G. 1999, MNRAS, 308, 947
- Aragón-Salamanca et al. (2006) Aragón-Salamanca, A., Bedregal, A. G., & Merrifield, M. R. 2006, A&A, 458, 101
- Athanassoula (1983) Athanassoula, E. 1983, in IAU Symp. 100, Internal Kinematics and Dynamics of Galaxies, ed. E. Athanassoula (Dordrecht: Reidel), 243
- Athanassoula et al. (2016) Athanassoula, E., Rodionov, S. A., Peschken, N., & Lambert, J. C. 2016, ApJ, 821, 90
- Barr et al. (2007) Barr, J. M., Bedregal, A. G., Aragón-Salamanca, A., Merrifield, M. R., & Bamford, S. P. 2007, A&A, 470, 173
- Barway et al. (2007) Barway, S., Kembhavi, A., Wadadekar, Y., Ravikumar, C. D., & Mayya, Y. D. 2007, ApJ, 661, L37
- Barway et al. (2009) Barway, S., Wadadekar, Y., Kembhavi, A. K., & Mayya, Y. D. 2009, MNRAS, 394, 1991
- Bekki (1998) Bekki, K. 1998, ApJ, 502, L133
- Bekki (2009) Bekki, K. 2009, MNRAS, 399, 2221
- Bekki (2014) Bekki, K. 2014, MNRAS, 438, 444
- Bekki & Couch (2011) Bekki, K., & Couch, W. J. 2011, MNRAS, 415, 1783
- Bekki et al. (2001) Bekki, K., Couch, W. J., & Shioya, Y. 2001, PASJ, 53, 395
- Bekki et al. (2002) Bekki, K., Couch, W. J., & Shioya, Y. 2002, ApJ, 577, 651
- Bosma (1983) Bosma, A. 1983, in IAU Symp. 100, Internal Kinematics and Dynamics of Galaxies, ed. E. Athanassoula (Dordrecht: Reidel), 253
- Bournaud (2016) Bournaud, F. 2016, in Galactic Bulges, ed. E. Laurikainen, R. Peletier, & D. Gadotti (New York: Springer), 355
- Bournaud & Combes (2002) Bournaud, F., & Combes, F. 2002, A&A, 392, 83
- Bournaud et al. (2009) Bournaud, F., Elmegreen, B. G., & Martig, M. 2009, ApJ, 707, L1
- Burstein (1979) Burstein, D. 1979, ApJ, 234, 435
- Burstein et al. (2005) Burstein, D., Ho, L. C., Huchra, J. P., & Macri, L. M. 2005, ApJ, 621, 246
- Buta & Combes (1996) Buta, R., & Combes, F. 1996, Fund. Cosmic Phys., 17, 95
- Butcher & Oemler (1978) Butcher, H., & Oemler, Jr., A. 1978, ApJ, 219, 18
- Byrd & Valtonen (1990) Byrd, G., & Valtonen, M. 1990, ApJ, 350, 89
- Calvi et al. (2013) Calvi, R., Poggianti, B. M., Vulcani, B., & Fasano, G. 2013, MNRAS, 432, 3141
- Cappellari et al. (2011) Cappellari, M., Emsellem, E., Krajnović, D., et al. 2011, MNRAS, 416, 1680
- Cayatte et al. (1990) Cayatte, V., van Gorkom, J. H., Balkowski, C., & Kotanyi, C. 1990, AJ, 100, 604
- Chung et al. (2009) Chung, A., van Gorkom, J. H., Kenney, J. D. P., Crowl, H., & Vollmer, B. 2009, AJ, 138, 1741
- Chung et al. (2007) Chung, A., van Gorkom, J. H., Kenney, J. D. P., & Vollmer, B. 2007, ApJ, 659, L115
- Clarke et al. (2017) Clarke, A. J., Debattista, V. P., Roškar, R., & Quinn, T. 2017, MNRAS, 465, L79
- Combes (1996) Combes, F. 1996, in ASP Conf. Ser. 91, IAU Colloq. 157: Barred Galaxies, ed. R. Buta, D. A. Crocker, & B. G. Elmegreen (San Francisco, CA: ASP), 286
- Cortese et al. (2007) Cortese, L., Marcillac, D., Richard, J., et al. 2007, MNRAS, 376, 157
- Costantin et al. (2017) Costantin, L., Méndez-Abreu, J., Corsini, E. M., et al. 2017, A&A, 601, A84
- de Souza et al. (2004) de Souza, R. E., Gadotti, D. A., & dos Anjos, S. 2004, ApJS, 153, 411
- de Vaucouleurs (1959) de Vaucouleurs, G. 1959, HDP, 53, 275
- de Vaucouleurs et al. (1991) de Vaucouleurs, G., de Vaucouleurs, A., Corwin, Jr., H. G., et al. 1991, Third Reference Catalogue of Bright Galaxies (New York: Springer)
- Dressler (1980) Dressler, A. 1980, ApJ, 236, 351
- Dressler et al. (1997) Dressler, A., Oemler, Jr., A., Couch, W. J., et al. 1997, ApJ, 490, 577
- Elmegreen & Elmegreen (2006) Elmegreen, B. G., & Elmegreen, D. M. 2006, ApJ, 650, 644
- Erwin et al. (2012) Erwin, P., Gutiérrez, L., & Beckman, J. E. 2012, ApJ, 744, L11
- Erwin et al. (2008) Erwin, P., Pohlen, M., & Beckman, J. E. 2008, AJ, 135, 20
- Faber & Gallagher (1976) Faber, S. M., & Gallagher, J. S. 1976, ApJ, 204, 365
- Fasano et al. (2000) Fasano, G., Poggianti, B. M., Couch, W. J., et al. 2000, ApJ, 542, 673
- Fisher & Drory (2008) Fisher, D. B., & Drory, N. 2008, AJ, 136, 773
- Fisher & Drory (2010) Fisher, D. B., & Drory, N. 2010, ApJ, 716, 942
- Fisher et al. (2009) Fisher, D. B., Drory, N., & Fabricius, M. H. 2009, ApJ, 697, 630
- Gadotti (2009) Gadotti, D. A. 2009, MNRAS, 393, 1531
- Gao & Ho (2017) Gao, H., & Ho, L. C. 2017, ApJ, 845, 114
- Genzel et al. (2008) Genzel, R., Burkert, A., Bouché, N., et al. 2008, ApJ, 687, 59
- Graham et al. (2015) Graham, A. W., Dullo, B. T., & Savorgnan, G. A. D. 2015, ApJ, 804, 32
- Gunn & Gott (1972) Gunn, J. E., & Gott, III, J. R. 1972, ApJ, 176, 1
- Hau et al. (2008) Hau, G. K. T., Bower, R. G., Kilborn, V., et al. 2008, MNRAS, 385, 1965
- Helsdon & Ponman (2003) Helsdon, S. F., & Ponman, T. J. 2003, MNRAS, 339, L29
- Ho et al. (2011) Ho, L. C., Li, Z.-Y., Barth, A. J., Seigar, M. S., & Peng, C. Y. 2011, ApJS, 197, 21
- Hopkins et al. (2010) Hopkins, P. F., Bundy, K., Croton, D., et al. 2010, ApJ, 715, 202
- Huang et al. (2013) Huang, S., Ho, L. C., Peng, C. Y., Li, Z.-Y., & Barth, A. J. 2013, ApJ, 766, 47
- Hubble (1936) Hubble, E. P. 1936, Realm of the Nebulae (New Haven: Yale Univ. Press)
- Icke (1985) Icke, V. 1985, A&A, 144, 115
- Just et al. (2010) Just, D. W., Zaritsky, D., Sand, D. J., Desai, V., & Rudnick, G. 2010, ApJ, 711, 192
- Kannappan et al. (2004) Kannappan, S. J., Jansen, R. A., & Barton, E. J. 2004, AJ, 127, 1371
- Kaviraj (2014) Kaviraj, S. 2014, MNRAS, 440, 2944
- Kawata & Mulchaey (2008) Kawata, D., & Mulchaey, J. S. 2008, ApJ, 672, L103
- Kenney et al. (2004) Kenney, J. D. P., van Gorkom, J. H., & Vollmer, B. 2004, AJ, 127, 3361
- Kent (1985) Kent, S. M. 1985, ApJS, 59, 115
- Kormendy (1977) Kormendy, J. 1977, ApJ, 218, 333
- Kormendy (1979) Kormendy, J. 1979, ApJ, 227, 714
- Kormendy (2016) Kormendy, J. 2016, in Galactic Bulges, ed. E. Laurikainen, R. Peletier, & D. Gadotti (New York: Springer), 431
- Kormendy & Bender (2012) Kormendy, J., & Bender, R. 2012, ApJS, 198, 2
- Kormendy & Ho (2013) Kormendy, J., & Ho, L. C. 2013, ARA&A, 51, 511
- Kormendy & Illingworth (1982) Kormendy, J., & Illingworth, G. 1982, ApJ, 256, 460
- Kormendy & Kennicutt (2004) Kormendy, J., & Kennicutt, Jr., R. C. 2004, ARA&A, 42, 603
- Kruk et al. (2018) Kruk, S. J., Lintott, C. J., Bamford, S. P., et al. 2018, MNRAS, 473, 4731
- Larson et al. (1980) Larson, R. B., Tinsley, B. M., & Caldwell, C. N. 1980, ApJ, 237, 692
- Laurikainen et al. (2013) Laurikainen, E., Salo, H., Athanassoula, E., et al. 2013, MNRAS, 430, 3489
- Laurikainen et al. (2005) Laurikainen, E., Salo, H., & Buta, R. 2005, MNRAS, 362, 1319
- Laurikainen et al. (2006) Laurikainen, E., Salo, H., Buta, R., et al. 2006, AJ, 132, 2634
- Laurikainen et al. (2007) Laurikainen, E., Salo, H., Buta, R., & Knapen, J. H. 2007, MNRAS, 381, 401
- Laurikainen et al. (2009) Laurikainen, E., Salo, H., Buta, R., & Knapen, J. H. 2009, ApJ, 692, L34
- Laurikainen et al. (2010) Laurikainen, E., Salo, H., Buta, R., Knapen, J. H., & Comerón, S. 2010, MNRAS, 405, 1089
- Li et al. (2017) Li, Z.-Y., Ho, L. C., & Barth, A. J. 2017, ApJ, 845, 87
- Li et al. (2011) Li, Z.-Y., Ho, L. C., Barth, A. J., & Peng, C. Y. 2011, ApJS, 197, 22
- Moore et al. (1996) Moore, B., Katz, N., Lake, G., Dressler, A., & Oemler, A. 1996, Nature, 379, 613
- Moore et al. (1998) Moore, B., Lake, G., & Katz, N. 1998, ApJ, 495, 139
- Moore et al. (1999) Moore, B., Lake, G., Quinn, T., & Stadel, J. 1999, MNRAS, 304, 465
- Neumann et al. (2017) Neumann, J., Wisotzki, L., Choudhury, O. S., et al. 2017, A&A, 604, A30
- Paturel et al. (2003) Paturel, G., Petit, C., Prugniel, P., et al. 2003, A&A, 412, 45
- Peng et al. (2002) Peng, C. Y., Ho, L. C., Impey, C. D., & Rix, H.-W. 2002, AJ, 124, 266
- Peng et al. (2010) Peng, C. Y., Ho, L. C., Impey, C. D., & Rix, H.-W. 2010, AJ, 139, 2097
- Poggianti et al. (2017) Poggianti, B. M., Moretti, A., Gullieuszik, M., et al. 2017, ApJ, 844, 48
- Pohlen & Trujillo (2006) Pohlen, M., & Trujillo, I. 2006, A&A, 454, 759
- Querejeta et al. (2015a) Querejeta, M., Eliche-Moral, M. C., Tapia, T., et al. 2015a, A&A, 573, A78
- Querejeta et al. (2015b) Querejeta, M., Eliche-Moral, M. C., Tapia, T., et al. 2015b, A&A, 579, L2
- Quilis et al. (2000) Quilis, V., Moore, B., & Bower, R. 2000, Science, 288, 1617
- Rasmussen et al. (2006) Rasmussen, J., Ponman, T. J., & Mulchaey, J. S. 2006, MNRAS, 370, 453
- Rasmussen et al. (2008) Rasmussen, J., Ponman, T. J., Verdes-Montenegro, L., Yun, M. S., & Borthakur, S. 2008, MNRAS, 388, 1245
- Rasmussen et al. (2012) Rasmussen, J., Bai, X.-N., Mulchaey, J. S., et al. 2012, ApJ, 747, 31
- Roediger & Brüggen (2007) Roediger, E., & Brüggen, M. 2007, MNRAS, 380, 1399
- Ruggiero & Lima Neto (2017) Ruggiero, R., & Lima Neto, G. B. 2017, MNRAS, 468, 4107
- Sachdeva & Saha (2016) Sachdeva, S., & Saha, K. 2016, ApJ, 820, L4
- Sánchez et al. (2012) Sánchez, S. F., Kennicutt, R. C., Gil de Paz, A., et al. 2012, A&A, 538, A8
- Sandage (1961) Sandage, A. 1961, The Hubble Atlas of Galaxies (Washington, DC: Carnegie Institution of Washington)
- Sandage et al. (1970) Sandage, A., Freeman, K. C., & Stokes, N. R. 1970, ApJ, 160, 831
- Sellwood & Wilkinson (1993) Sellwood, J. A., & Wilkinson, A. 1993, RPPh, 56, 173
- Sérsic (1968) Sérsic, J. L. 1968, Atlas de Galaxias Australes (Córdoba: Obs. Astron., Univ. Nac. Córdoba)
- Shen & Sellwood (2004) Shen, J., & Sellwood, J. A. 2004, ApJ, 604, 614
- Smith et al. (2005) Smith, G. P., Treu, T., Ellis, R. S., Moran, S. M., & Dressler, A. 2005, ApJ, 620, 78
- Sparre & Springel (2017) Sparre, M., & Springel, V. 2017, MNRAS, 470, 3946
- Spitzer & Baade (1951) Spitzer, Jr., L., & Baade, W. 1951, ApJ, 113, 413
- Tadaki et al. (2017) Tadaki, K.-i., Genzel, R., Kodama, T., et al. 2017, ApJ, 834, 135
- Tapia et al. (2017) Tapia, T., Eliche-Moral, M. C., Aceves, H., et al. 2017, A&A, 604, A105
- Toomre (1977) Toomre, A. 1977, in Evolution of Galaxies and Stellar Populations, ed. B. M. Tinsley & R. B. Larson (New Haven: Yale Univ. Obs.), 401
- Vaghmare et al. (2013) Vaghmare, K., Barway, S., & Kembhavi, A. 2013, ApJ, 767, L33
- van den Bergh (1976) van den Bergh, S. 1976, ApJ, 206, 883
- Wang et al. (2015) Wang, J., Hammer, F., Puech, M., Yang, Y., & Flores, H. 2015, MNRAS, 452, 3551
- Williams et al. (2009) Williams, M. J., Bureau, M., & Cappellari, M. 2009, MNRAS, 400, 1665
- Wilman et al. (2009) Wilman, D. J., Oemler, Jr., A., Mulchaey, J. S., et al. 2009, ApJ, 692, 298