Peculiar Spin Frequency and Radio Profile Evolution of PSR J11196127 Following Magnetar-like X-ray Bursts
Abstract
We present the spin frequency and profile evolution of the radio pulsar J11196127 following magnetar-like X-ray bursts from the system in 2016 July. Using data from the Parkes radio telescope, we observe a smooth and fast spin-down process subsequent to the X-ray bursts resulting in a net change in the pulsar rotational frequency of Hz. During the transition, a net spin-down rate increase of Hz s-1 is observed, followed by a return of to its original value. In addition, the radio pulsations disappeared after the X-ray bursts and reappeared about two weeks later with the flux density at 1.4 GHz increased by a factor of five. The flux density then decreased and undershot the normal flux density followed by a slow recovery back to normal. The pulsar’s integrated profile underwent dramatic and short-term changes in total intensity, polarization and position angle. Despite the complex evolution, we observe correlations between the spin-down rate, pulse profile shape and radio flux density. Strong single pulses have been detected after the X-ray bursts with their energy distributions evolving with time. The peculiar but smooth spin frequency evolution of PSR J11196127 accompanied by systematic pulse profile and flux density changes are most likely to be a result of either reconfiguration of the surface magnetic fields or particle winds triggered by the X-ray bursts. The recovery of spin-down rate and pulse profile to normal provides us the best case to study the connection between high magnetic-field pulsars and magnetars.
keywords:
pulsars: general1 Introduction
Of the more than 2600 pulsars now known, the so-called magnetars form a small sub-class with only 29 members111See http://www.physics.mcgill.ca/ pulsar/magnetar/main.html (Olausen & Kaspi, 2014) (see e.g., Kaspi & Beloborodov, 2017; Esposito et al., 2018, for reviews). Typically, these pulsars have long rotation periods and very high spin-down rates, hence high inferred surface magnetic fields above a few G. Magnetars are characterised by X-ray outbursts whose luminosity exceeds the spin-down luminosity and are therefore likely to be powered by the ultra-high magnetic fields. In addition, some magnetars have been detected as transient pulsating radio sources, showing several differences from the normal radio pulsars, including extreme variability in their flux densities, pulse profiles and spin-down rates (e.g., Camilo et al., 2006, 2007a, 2007b, 2008; Levin et al., 2012).
If energetic burst activities of magnetars are powered by their magnetic fields, and given that similar behaviour has been seen in sources with inferred magnetic fields in the range of ordinary radio pulsars (such as SGR 0418+5729 and Swift J1822.31606; Rea et al., 2010, 2012), it is then conceivable that radio pulsars with high inferred surface dipole magnetic fields (hereafter high- pulsars) could exhibit magnetar-like activity (Kaspi & McLaughlin, 2005; Ng & Kaspi, 2011). Studies have also been carried out to unify the observational diversity of magnetars, high-B radio pulsars, and isolated nearby neutron stars via magneto-thermal evolution models (e.g., Viganò et al., 2013). Previously, only one high-, rotation-powered pulsar, PSR J18460258, has been observed to transition to a magnetar-like phase (Gavriil et al., 2008). While several short magnetar-like bursts and a sudden spin-up glitch followed by a strong over-recovery were detected (Kuiper & Hermsen, 2009; Livingstone et al., 2010, 2011), no radio activities have been observed. More observational evidences of high- radio pulsars in the transitional phase are therefore important for us to understand their connection to magnetars, and to unify these two populations of isolated neutron stars.
PSR J11196127 is a high-, rotation-powered radio pulsar discovered in the Parkes multibeam pulsar survey (Camilo et al., 2000); the pulsar’s basic timing parameters are listed in Table 1. It has been regularly observed at the Parkes radio telescope as a part of a monitoring program of energetic pulsars (Weltevrede et al., 2010; Abdo et al., 2013) and two unusual glitches have been detected in the pulsar described in full by Weltevrede et al. (2011) and Antonopoulou et al. (2015). In addition, Weltevrede et al. (2011) also detected extremely rare intermittent pulse components following the glitch. Antonopoulou et al. (2015) measured a braking index of , indicating that in the plane the pulsar appears to be moving towards the magnetar population. They also found marginal evidence for a permanent change in the braking index following a glitch.
Magnetar-like X-ray bursts from PSR J11196127 were detected by the Fermi/Gamma-ray Burst Monitor on 2016 July 27 (Younes et al., 2016) and by the Swift/Burst Alert Telescope on July 28 (Kennea et al., 2016). This made PSR J11196127 the first rotation-powered, radio pulsar to show magnetar-like activities. Following the X-ray bursts, the persistent X-ray flux of PSR J11196127 increased by a factor of 160, and the pulsar underwent a large glitch (Archibald et al., 2016). Extensive searches in both Fermi and Swift data for lower luminosity bursts uncovered 10 additional bursts from the source (Göğüş et al., 2016). Additionally, its pulsed radio emission at GHz was quenched following the bursts (Burgay et al., 2016a), and only reappeared some two weeks later (Burgay et al., 2016b). Higher radio frequency observations confirmed the initial disappearance of the radio emission and its prompt reactivation and also showed pulse profile evolution over several months of observation (Majid et al., 2017). Simultaneous observations at X-ray, with XMM-Newton and NuSTAR, and at radio frequencies with the Parkes radio telescope, showed that the rotationally powered radio emission shut off multiple times, in coincident with the occurrence of X-ray bursts (Archibald et al., 2017). Three months after the bursts, the pulsar was still brighter in the X-rays by a factor of 22 in comparison with its quiescence and the X-ray images revealed a nebula brighter than in the pre-burst Chandra observations (Blumer et al., 2017).
In this paper, we present observations of the spin frequency and radio profile evolution of PSR J11196127 after the X-ray outburst using data taken with the Parkes radio telescope. The peculiar spin frequency evolution of PSR J11196127 together with its magnetar-like activities, provide us an opportunity to study the relation/transition between high- pulsars and magnetars and to understand the origin of X-ray bursts and the evolution of magnetic fields. In Section 2 we describe the observations and the data reduction. In Section 3 we present the results on spin frequency evolution, flux density, polarization pulse profiles and single pulses. Discussions and a summary are given in Section 4 and 5.
2 Observations and Data Reduction
PSR J11196127 is observed regularly using the Parkes radio telescope under the auspices of program P574, with an approximate observing cadence of four weeks. Data taken prior to 2014 are described in Antonopoulou et al. (2015). In this paper we use observations taken since 2015222When investigating the spin frequency evolution we included spin frequency measurements back to 2013., which were primarily carried out in the band centred at 1369 MHz using the central beam of the 20 cm multibeam receiver. From February to October 2016 the H-OH receiver centred at 1465 MHz was used.
Triggered by the X-ray bursts on 2016 July 27, PSR J11196127 was extensively observed in 2016 July, August and September using the Parkes radio telescope as a part of proposal P626 (PI: M. Burgay). Two observing modes, fold-mode and search-mode, were used for the follow-up observations. For fold-mode, data were folded modulo the pulse period with 1024 phase bins in each of 1024 frequency channels, integrated for 30 s and written to disk. For search-mode, data were recorded with 4-bit-sampling every 256 s in each of 512 frequency channels. For both modes, full Stokes information was recorded. The observing frequency, bandwidth and integration time are presented in Table 2.
| Epoch (MJD) | 57935.25 |
|---|---|
| Spin frequency () | 2.438745737(4) Hz |
| Spin-frequency derivative () | Hz s-1 |
| Spin-frequency second derivative () | Hz s-2 |
| MJD range | 5779558208 |
For the fold-mode observations, the data processing procedure follows that described in Kerr et al. (2018). We removed 5 per cent of the bandpass at each edge to mitigate RFI and aliasing and excised data affected by narrow-band and impulsive radio-frequency interference for each sub-integration. To measure the differential gains between the signal paths of the two voltage probes, once an hour we observe a pulsed noise signal injected into the signal path prior to the first-stage low-noise amplifiers. The noise signal also provides a reference brightness for each observation. To correct for the absolute gain of the system, we make use of observations of the radio galaxy 3C 218 (Hydra A); by using on- and off-source pointings, we can measure the apparent brightness of the noise diode as a function of radio frequency. A dispersion measure (DM) of 704.8 cm-3 pc (Petroff et al., 2013) and a rotation measure (RM) of 853 rad m-2 (Johnston & Weisberg, 2006) were used in the data processing. All data reduction made use of the Psrchive (Hotan et al., 2004) software package.
3 Results
3.1 Spin frequency evolution
There are a number of difficulties in solving for the evolution of the pulsar’s spin parameters after the X-ray bursts. Firstly, the profile underwent changes (see Section 3.3) for which no absolute reference point can be used to determine pulse time of arrivals. Secondly, standard pulsar timing software does not cope well with the strong and rapid evolution of both and seen here. We have therefore not attempted a phase-coherent fit over this time interval. Rather, we form an analytic template for each observation and then measure by fitting pulse time of arrivals of individual sub-integrations across the observation duration.
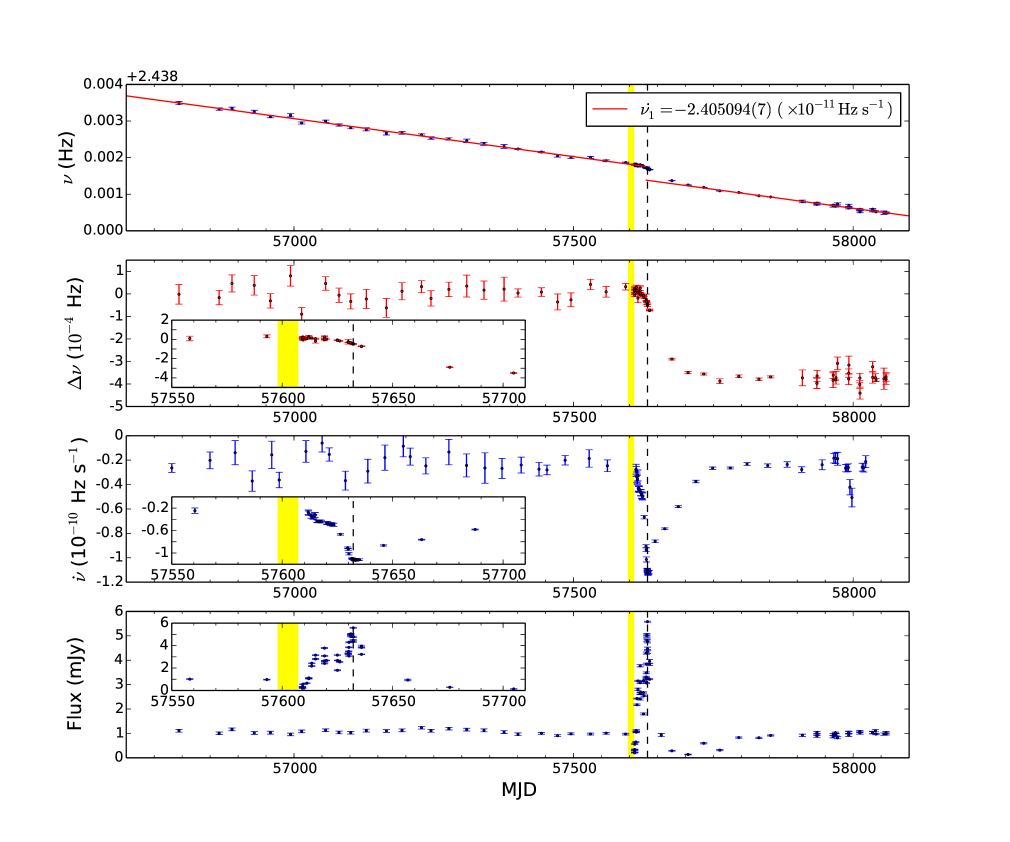
In the top panel of Fig. 1, we show as a function of time with the measured by Antonopoulou et al. (2015) shown as a red line and the X-ray outburst shown as the yellow region. Before the X-ray bursts, agrees with the previous measurement. However, after the X-ray bursts, starts to decrease rapidly as shown in the second panel of Fig. 1 (created after removing the slope due to ). Archibald et al. (2016) reported a large glitch at ( s-1), but because of the absence of radio emission during that period of time, we cannot confirm the glitch and did not observe significant discrete changes of . On the contrary, after the reactivation of radio emission we observed a relatively fast and smooth decrease in followed by a rapid drop. This is completely at odds with normal glitches, which have the opposite sign change of and happen virtually instantaneously (e.g., Palfreyman et al., 2018). Within a time period of days, we observed a net change in the rotational frequency by Hz.
The strong evolution of is accompanied by rapid changes in . We fitted for by using adjacent measurements of ; during the rapid changes of (MJD between 57600 and 57950), we used a sliding window of 10 days; for the rest of the data set, we used a sliding window of 60 days333We treated measurements before and after the X-ray bursts separately, and therefore before and after the X-ray bursts are independent.. No significant discrete change of was observed after the reactivation of radio emission. The evolution of started with a fast and smooth decrease, peaked at , and then gradually recovered to its original value. Again, this is different from the recovery of following normal glitches and previous glitches observed for this pulsar. What is also interesting is the wiggle during the fast decrease of (becoming more negative), and we will discuss this in Section 4.
A large spin-up glitch has been detected for PSR J18460258 after the onset of magnetar-like behaviour, followed by an unusually large glitch recovery (Livingstone et al., 2010). While the net spin-down of PSR J18460258 after the event () is of the same order as we observed for PSR J11196127, the evolution of is different. We did not see sudden changes in the and for PSR J11196127, and peaks about 30 days after the X-ray bursts before recovering back to normal about 200 days later.
An updated timing solution for the pulsar was obtained after the recovery to the normal state (), these parameters are listed in Table 1.
3.2 Flux density
To measure the flux density, we first formed noise-free standard templates for each observation by fitting scaled von Mises functions (using the Psrchive program paas) to the observed profile after integrating the data over the observing band and observation duration. The Psrchive program psrflux was used to measure the flux density for each observation, which cross-correlates the observed profile with the standard template to obtain the scaling factor and then the averaged flux density. The uncertainty of flux density was estimated using the standard deviation of the baseline fluctuations. In the bottom panel of Fig. 1, we present the measured flux density as a function of time. After the reactivation of radio emission, the flux density increased rapidly and peaked at (black dashed lines) and then started decreasing. Intriguingly, the flux density undershot the normal flux density ( mJy) and dropped to a minimum value of mJy and then slowly recovered back to normal. We note that the peak of flux density roughly lines up with the peak of net spin-frequency derivative. Potential correlation between reduced flux density and increased has been observed in PSR J16224950 (Levin et al., 2012), but it is very different compared with what we have observed for PSR J11196127. More similarly, Camilo et al. (2007b) reported a decrease of flux density and a broadening of the pulse profile components accompanied by a decrease in torque of about 10% over an interval of two weeks for XTE J1810197.
3.3 Profile variations
The polarization characteristics of the pulsar were described in Johnston & Weisberg (2006) and in more detail by Rookyard et al. (2017). In brief, in what we will refer to as the normal state (Profile A), the pulsar shows a single, highly linearly polarized component with a half-width of 19° (Johnston & Kerr, 2018) and a small amount of circular polarization. The position angle (PA) has a shallow negative slope as a function of phase. In the single abnormal observation directly after a large glitch described by Weltevrede et al. (2011), an extra component, also highly linearly polarized, appeared to lead the normal component. Rookyard et al. (2017) considered both these profiles and concluded the angle between the magnetic and rotation axes, , was relatively small.
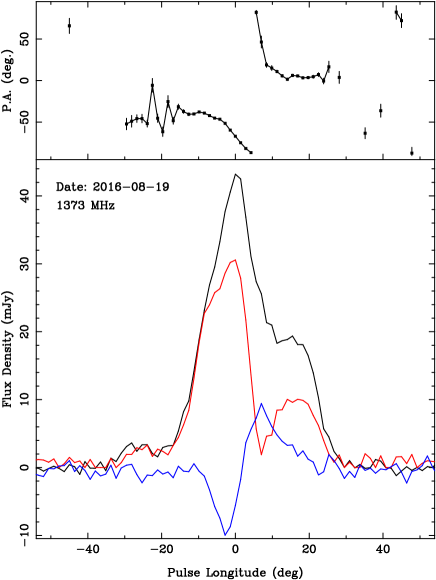
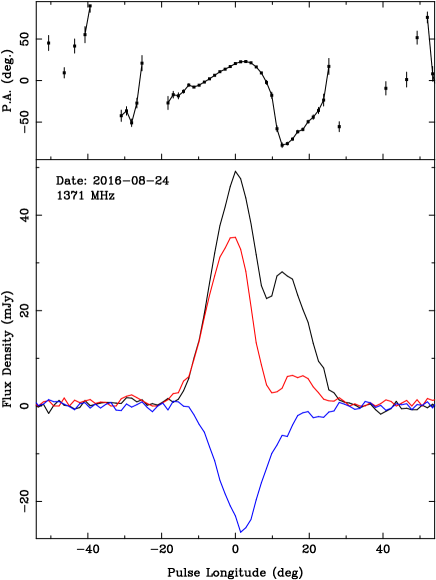
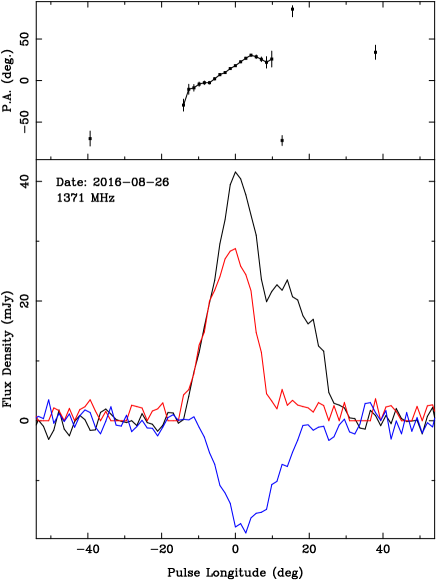
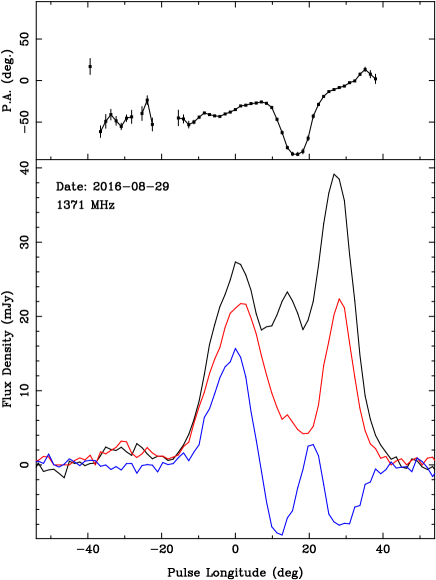
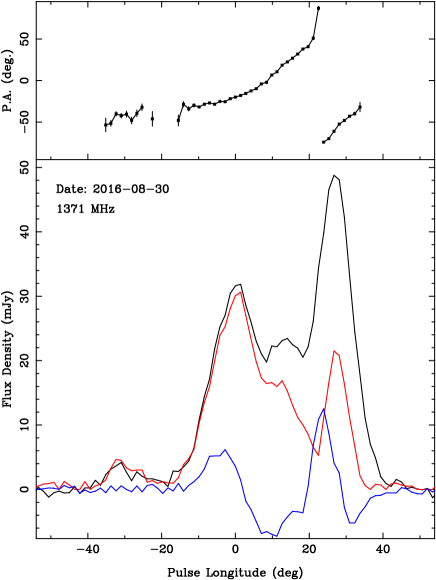
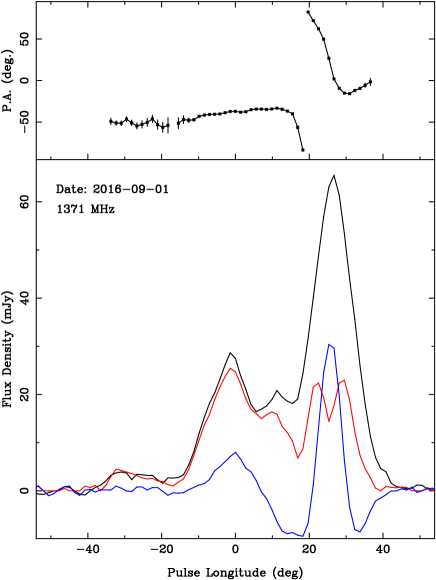
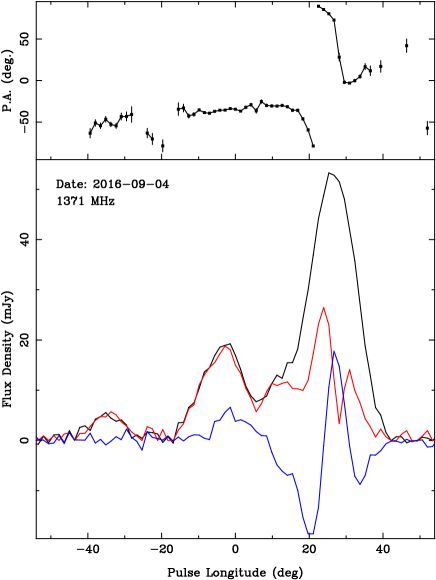
In the observations under consideration here, dramatic changes in the pulse profile and the polarization characteristics were observed between 2016 August 12 and 2016 September 4. Broadly speaking, two alternative profiles are observed. The first, present between 2016 August 12 and 2016 August 26 shows the presence of two components (see Figure 2) which we call Profile B. The first component is highly polarized whereas the second is not. The circular polarization underwent strong transformation within this period as did the PA swing. In particular, the slope of the PA swing changed from negative to positive during this timeframe. The second state occurred between 2016 August 29 and (at least) 2016 September 4. In this state, Profile C, there are 4 components (see Figure 3), a leading small highly polarized component separated in phase from a triple structure with a highly polarized first component followed by two, less polarized components. The relative amplitude of the components changes with time. The circular polarization and the PA swing are again highly variable. As shown above, the pulsar was much brighter during this period, largely due to the third component of the triple structure. There are no observations between 2016 September 4 and September 25 where the pulsar flux density dropped from mJy to mJy, but the pulse profile appears to have returned to its normal profile on September 25.
Several questions arise: how do the profiles align in phase, how do the profiles changes correlate with the changes in and , and what are the causes of the profile changes?
Considering first the profile alignment, we believe the most plausible solution is that shown in Figures 2 and 3, with zero phase defined as the peak of the profile A, the leading component of the profile B and the leading component of profile C as shown. The implication of this is that the normal component remains roughly constant in amplitude through the other changes, and that the trailing, very bright component seen at later times appears to emerge rapidly between August 26 and 29. In addition, this would imply that the extra component seen in Weltevrede et al. (2011) is aligned in phase with the trailing bright component seen at later times here. What is most unexpected about these observations is the extreme changes seen in the PA swing as a function of epoch. No evidence of changes in PA swing has been observed before (Weltevrede et al., 2011). For many pulsars, and for this pulsar in particular, the swing of PA is used to determine the geometry of the star via the rotating vector model (RVM)(e.g., Rookyard et al., 2017). The sign of the slope of the PA swing is used to determine whether the line of sight cuts pole-ward or equator-ward from the magnetic axis (Everett & Weisberg, 2001) and therefore should not change. The PA swing of these observations significantly deviates from RVM-like behaviour, and for the scope of this paper we have not attempted to model the swing of PA. We also note that no significant changes of RM have been observed following the X-ray bursts.
 |
 |
 |
 |
 |
 |
 |
 |
3.4 Single pulses
Bright individual pulses have been observed for J11196127 previously. Weltevrede et al. (2011) detected four strong single pulses at 1.4 GHz on 2007 August 20 and a number of bright single pulses at 3.1 GHz on 2007 July 23. The fact that the strong pulses do not align with the peak of the averaged pulse profile suggests their RRAT-like origins. Intriguingly, a large amplitude glitch occurred directly before these very rare RRAT-like events were observed. This was the first time that a glitch, or the post-glitch recovery process, has been observed to influence the radio emission process of a normal (non-RRAT) pulsar. A starquake model with crustal plate movement has been proposed to explain the changing emission properties coincident with the glitch (Akbal et al., 2015), as well as the unusual glitch recovery (see Antonopoulou et al., 2015).
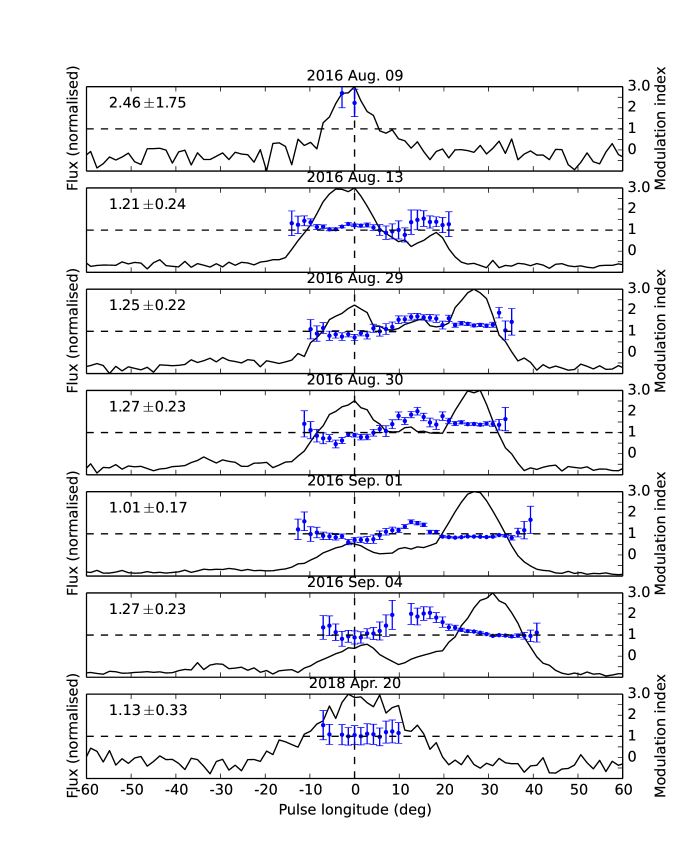
After the X-ray bursts of J11196127, we also detected strong single pulses. Out of ten search-mode observations, we detected strong single pulses with signal-to-noise (S/N) larger than ten in seven observations. In Table 2, we list the number of detections of strong single pulses with for each observation. To better understand the occurrence of single pulses, we produced pulse component averaged flux density distributions of these observations. The psrsalsa software package (Weltevrede, 2016) was used to carry out manual RFI mitigation, to calculate pulse energies, and to fit energy distributions. In the top panel of each subplot in Fig. 4, we show pulse component averaged flux density distributions of observations taken on 2016 August 9, 13 and 30 and on September 1 and 4, all of which show strong single pulses and have integration time long enough for us to study their statistics. In comparison, results of an observation taken during the pulsar’s normal state (2018 April 20) are also shown. Flux density distributions of the main pulse component (centred at a pulse longitude of zero degrees in Figs 2 and 3) and the bright trailing component (centred at a pulse longitude of degrees in Fig 3) are shown as blue and red histogram, respectively. The standard deviation of the noise distribution is shown as a point with horizontal error bar for each pulse component. The observed energy distribution of single pulses is the intrinsic distribution convolved with the noise, and we fitted for the intrinsic energy distribution as described in Weltevrede (2016), assuming a log-normal distribution. In the bottom panel of each subplot in Fig. 4, we show the fitting residuals for each pulse component.
The energy distribution of both the main and the trailing component significantly deviate from a log-normal distribution after the X-ray bursts. For the trailing component, we observed a long high energy tail, and it became more and more significant as the pulsar became brighter and showed a new high energy component on 2016 September 1 before it faded away. For the main component, the energy distributions of observations with Profile C look similar and can be generally fitted by a log-normal distribution, but are clearly different from that of Profile B on 2016 August 13 which deviates from a log-normal distribution. In comparison, for the normal state (e.g., 2018 April 20), the intrinsic energy distribution of single pulses can be well described by a log-normal distribution. Although detailed modelling of the energy distributions is beyond the scope of this paper, our results show that a significantly greater number of energetic pulses were produced after the X-ray bursts and this can not be simply explained by the increase of the averaged flux density. The different pulse energy distributions of two pulse profile components at different epochs provide evidences of changes in the pulsar magnetosphere triggered by the X-ray bursts.
In order to study the variation of intensity from pulse to pulse as a function of pulse longitude, we calculated the modulation index defined as Eq. 1 of Weltevrede et al. (2011) in the spectral domain. In Fig. 5, modulation indices at different pulse phases are shown as blue points with error bars on top of the averaged pulse profiles. The variation of modulation index with pulse longitude shows similar shape for all observations and supports our pulse profile alignment. Averaging over the on-pulse phases, we obtained modulation indices after the X-ray bursts (shown in the upper left corner of each panel of Fig. 5) significantly higher than those observed for most pulsars (e.g., Weltevrede et al., 2006).

| Fold mode | |||||||||
| Date | MJD | Receiver | Frequency | Bandwidth | Integration | Flux | Profile shape | ||
| (MHz) | (MHz) | (s) | (Hz) | (mJy) | |||||
| 2016 May 22 | 57530.23 | HOH | 1465 | 512 | 180 | 2.44000(2) | 0.97(4) | A | |
| 2016 Jun. 19 | 57558.18 | HOH | 1465 | 512 | 180 | 2.43991(2) | 1.01(4) | A | |
| 2016 Jul. 24 | 57593.05 | HOH | 1465 | 512 | 180 | 2.43986(1) | 0.97(4) | A | |
| 2016 Aug. 9 | 57609.14 | HOH | 1369 | 256 | 970 | 2.439801(5) | 0.29(1) | A | |
| 2016 Aug. 9 | 57609.19 | HOH | 1369 | 256 | 940 | 2.439811(6) | 0.34(2) | A | |
| 2016 Aug. 9 | 57609.33 | HOH | 1369 | 256 | 600 | 2.439824(6) | 0.56(2) | A | |
| 2016 Aug. 11 | 57611.21 | HOH | 1369 | 256 | 640 | 2.439803(6) | 0.65(2) | A | |
| 2016 Aug. 12 | 57612.03 | HOH | 1369 | 256 | 460 | 2.439823(9) | 1.05(3) | B | |
| 2016 Aug. 12 | 57612.04 | HOH | 1465 | 512 | 330 | 2.43981(1) | 1.08(2) | B | |
| 2016 Aug. 13 | 57613.37 | HOH | 1369 | 256 | 500 | 2.439803(2) | 2.18(3) | B | |
| 2016 Aug. 15 | 57615.07 | HOH | 1369 | 256 | 150 | 2.43977(2) | 2.80(5) | B | |
| 2016 Aug. 19 | 57619.12 | HOH | 1369 | 256 | 300 | 2.43977(1) | 3.77(5) | B | |
| 2016 Aug. 19 | 57619.16 | HOH | 1465 | 512 | 180 | 2.43979(1) | 2.63(4) | B | |
| 2016 Aug. 19 | 57619.18 | HOH | 1369 | 256 | 780 | 2.439781(3) | 3.08(3) | B | |
| 2016 Aug. 19 | 57619.19 | HOH | 1369 | 256 | 550 | 2.439780(4) | 2.64(3) | B | |
| 2016 Aug. 19 | 57619.20 | HOH | 1369 | 256 | 350 | 2.43980(1) | 2.41(4) | B | |
| 2016 Aug. 19 | 57619.97 | HOH | 1465 | 512 | 1200 | 2.439780(1) | 2.69(2) | B | |
| 2016 Aug. 24 | 57624.98 | HOH | 1369 | 256 | 1200 | 2.439760(1) | 3.15(2) | B | |
| 2016 Aug. 25 | 57625.03 | HOH | 1369 | 256 | 610 | 2.439756(4) | 2.68(3) | B | |
| 2016 Aug. 26 | 57626.02 | HOH | 1369 | 256 | 490 | 2.439748(5) | 2.55(3) | B | |
| 2016 Aug. 29 | 57629.88 | HOH | 1369 | 256 | 1200 | 2.43973(2) | 3.31(3) | C | |
| 2016 Aug. 29 | 57629.91 | HOH | 1369 | 256 | 810 | 2.439724(1) | 3.26(3) | C | |
| 2016 Aug. 30 | 57630.09 | HOH | 1369 | 256 | 1200 | 2.439723(1) | 3.48(4) | C | |
| 2016 Aug. 30 | 57630.17 | HOH | 1369 | 256 | 1200 | 2.439725(1) | 3.84(4) | C | |
| 2016 Aug. 30 | 57630.21 | HOH | 1369 | 256 | 1200 | 2.4397241(8) | 4.29(4) | C | |
| 2016 Aug. 31 | 57631.02 | HOH | 1369 | 256 | 1200 | 2.4397157(8) | 4.83(5) | C | |
| 2016 Aug. 31 | 57631.03 | HOH | 1369 | 256 | 1200 | 2.4397178(8) | 5.05(5) | C | |
| 2016 Aug. 31 | 57631.05 | HOH | 1369 | 256 | 1200 | 2.4397178(8) | 4.99(5) | C | |
| 2016 Sep. 01 | 57632.14 | HOH | 1369 | 256 | 520 | 2.439700(5) | 4.35(8) | C | |
| 2016 Sep. 01 | 57632.15 | HOH | 1369 | 256 | 1200 | 2.4397054(9) | 4.77(6) | C | |
| 2016 Sep. 01 | 57632.17 | HOH | 1369 | 256 | 1550 | 2.439706(1) | 4.46(7) | C | |
| 2016 Sep. 04 | 57635.87 | HOH | 1369 | 256 | 1250 | 2.439670(1) | 3.95(8) | C | |
| 2016 Sep. 04 | 57635.91 | HOH | 1369 | 256 | 400 | 2.439672(4) | 3.83(4) | C | |
| 2016 Sep. 25 | 57656.84 | HOH | 1369 | 256 | 1380 | 2.439520(4) | 0.93(7) | A | |
| 2016 Oct. 14 | 57675.84 | HOH | 1465 | 512 | 1200 | 2.439371(4) | 0.29(1) | A | |
| 2016 Nov. 12 | 57704.75 | HOH | 1465 | 512 | 1200 | 2.439251(5) | 0.14(1) | A | |
| 2016 Dec. 10 | 57732.72 | MB | 1369 | 256 | 1200 | 2.439186(4) | 0.60(2) | A | |
| 2017 Jan. 8 | 57761.60 | MB | 1369 | 256 | 1200 | 2.43909(1) | 0.31(2) | A | |
| 2017 Feb. 11 | 57795.51 | MB | 1369 | 256 | 1200 | 2.439046(6) | 0.83(2) | A | |
| 2017 Mar. 19 | 57831.45 | MB | 1369 | 256 | 1200 | 2.438958(5) | 0.82(2) | A | |
| 2017 Apr. 09 | 57852.37 | MB | 1369 | 256 | 1200 | 2.438925(4) | 0.92(2) | A | |
| 2017 Jun. 05 | 57909.21 | MB | 1369 | 256 | 300 | 2.438803(4) | 0.93(5) | A | |
| Search mode | |||||||||
| Date | MJD | Receiver | Frequency | Bandwidth | Integration | No. of SP | Flux | Pulse shape | |
| (MHz) | (MHz) | (s) | (Hz) | (mJy) | |||||
| 2016 Aug. 9 | 57609.15 | HOH | 1369 | 256 | 2586 | 2.439816(2) | 0 | 0.21(1) | A |
| 2016 Aug. 9 | 57609.34 | HOH | 1369 | 256 | 3355 | 2.439818(3) | 0 | 0.21(1) | A |
| 2016 Aug. 12 | 57612.05 | HOH | 1369 | 256 | 287 | 2.43981(1) | 2 | 1.12(3) | B |
| 2016 Aug. 13 | 57613.38 | HOH | 1369 | 256 | 1303 | 2.439805(1) | 15 | 2.43(2) | B |
| 2016 Aug. 15 | 57615.08 | HOH | 1369 | 256 | 363 | 2.439794(5) | 17 | 3.15(3) | B |
| 2016 Aug. 29 | 57629.90 | HOH | 1369 | 256 | 1123 | 2.4397243(9) | 3 | 3.25(3) | C |
| 2016 Aug. 30 | 57630.19 | HOH | 1369 | 256 | 1433 | 2.4397234(6) | 8 | 3.07(2) | C |
| 2016 Sep. 1 | 57632.19 | HOH | 1369 | 256 | 1866 | 2.4397051(2) | 45 | 5.58(2) | C |
| 2016 Sep. 4 | 57635.89 | HOH | 1369 | 256 | 1783 | 2.4396693(4) | 1 | 3.22(2) | C |
| 2018 Apr. 20 | 58228.61 | MB | 1369 | 256 | 1273 | 2.450800(3) | 0 | 0.92(2) | A |
4 Discussion
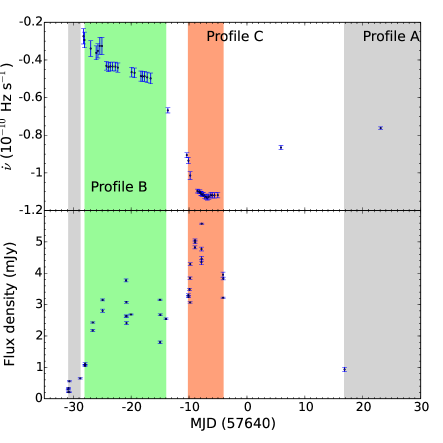
We observe a striking correlation between the profile changes, the flux density variability and the changes in the timing, particularly the value of . In Fig 6, we show the evolution of and flux density as a function of time directly following the X-ray bursts within 65 days. Different pulse profile types are indicated with shaded regions. During the rapid evolution of spin frequency (within the first 30 days), the pulse profile changed twice, on 2016 August 12 () and 29 (), and at both times we observed fast increase of flux density and decrease of (becomes more negative). We also see that for Profile B and Profile C the is significantly different by Hz s-1. However, the pulsar has then reverted to its normal profile () prior to the slow recovery of to its original value.
It therefore seems likely that the torque acting on the pulsar causing the change in is also related to the changing pulse profile. This is seen in other pulsars, more specifically in the mode changing pulsars. Lyne et al. (2010) noticed that pulse profile changes were correlated with changes. In the pulsars they examined, these changes occurred quickly but then persisted for a timescale of months (see also Keith et al., 2013; Brook et al., 2016). In the intermittent pulsar B193124 (Kramer et al., 2006) the changes appear to be caused by plasma loading in the pulsar magnetosphere. We surmise that something similar is happening in this case.
The only other example of a high- pulsar transitioning to a magnetar observed so far is the 2006 magnetar-like outburst of PSR J18460258 (Gavriil et al., 2008). A large but typical glitch recovery has been detected for J18460258 after the glitch triggered by the X-ray bursts (Livingstone et al., 2010). However, after the reactivation of radio radiation of PSR J11196127, we did not observe significant discrete changes of and . On the contrary, a smooth and fast spin-down process with a net spin-down rate change of Hz s-1 has been observed, which is much larger than that of PSR J18460258 ( Hz s-1) and is clearly different from normal glitch recoveries. Coti Zelati et al. (2018) present the results of a systematic study of all magnetar X-ray outbursts observed to date and show that the total outburst energy of J11196127 ( erg) is larger than that of J18460258 ( erg). On the other hand, as discussed by Archibald et al. (2016), the X-ray spectra of J11196127 in quiescence and during the outburst show different spectral shape and evolution compared with that of J18460258. The differences between the behaviour of J11196127 and J18460258 suggest that the peculiar spin frequency evolution of J11196127 reveal processes not well understood during the transition from a high- radio pulsar to a magnetar.
The net spin-down we observed following the X-ray bursts implies a release of a large amount of rotational energy. Assuming the canonical neutron star moment of inertia of g cm2, the rotational energy released can be estimated as
| (1) |
This is times of the total X-ray outburst energy, and in fact we did not observe obvious correlation between the X-ray light curve presented in Coti Zelati et al. (2018) and the radio flux densities nor the spin-frequency evolution. For a time span of days, the spin-down power gives us an averaged luminosity of erg s-1, about two times larger than the normal spin-down luminosity. While only a small portion of the spin-down energy goes into radio and X-ray, we could expect much stronger high energy emissions from the pulsar (e.g., -ray) if energy loss via high energy radiation is the main energy-loss mechanism. Such a high spin-down luminosity could also power strong relativistic particle outflows that can brighten the pulsar wind nebula (Blumer et al., 2017).
A complete picture of the PSR J11196127 event is likely to be that ultra-strong magnetic fields powered the X-ray bursts and triggered an additional torque that produced the peculiar spin frequency evolution. The fact that the polarization position angle changed significantly following the X-ray bursts indicates that the magnetic field might have changed. If we assume that the spin-down process is dominated by dipole braking, the surface magnetic field strength can be estimated as
| (2) |
where and are the spin period and spin-period derivative. Applying Eq. 2 on our measurements of and of PSR J11196127, we found that after the X-ray burst the surface magnetic field strength can reach as high as G, which is more than two times stronger than the normal field strength. Under such assumptions, the fast increase and slow recovery of as shown in the third panel of Fig. 1 indicate similar evolution of the surface magnetic field strength of the pulsar. This suggests that the X-ray bursts triggered some reconfiguration of the magnetosphere of the pulsar, resulting in the increase of the apparent field strength. The energy of the global dipolar field external to the neutron star can be estimated as
| (3) |
and in order to increase the magnetic field strength from G to G a total amount of energy of erg is needed. This is more than one order of magnitude larger than the spin-down power released following the X-ray bursts. Energies either from multipole (and/or internal) magnetic fields or neutron star interior need to be converted to the strong dipolar field and/or distort the magnetic field. Under such a scenario, the slow recoveries of the timing behaviour and the pulse profile back to normal have to be explained, which might involve the dissipation of the magnetic field.
As an alternative solution wind braking models have been suggested to explain the spin-down of magnetars (e.g., Harding et al., 1999; Tong et al., 2013) and the anti-glitch of magnetar 1E 2259586 (Tong, 2014). Particle winds triggered by the X-ray burst (e.g., Thompson & Duncan, 1996) can amplify the rotational energy loss rate by providing additional torque to slow down the pulsar. Enhanced particle winds could also be responsible for the fast increase of radio flux density and dramatic changes of pulse profile. Generalizing the model Kramer et al. (2006) proposed to understand different spin-down rates when the intermittent pulsar B193124 is on and off, we can estimate the change in charge density in the open field line region as
| (4) |
where is the radius of a neutron star and is the Goldreich-Julian density (Goldreich & Julian, 1969). At the maximum net spin-down rate ( Hz s-1), Eq. 4 gives us a net change in charge density of , which means that the change in charge density in the open field line region needs to be much larger than . Compared with XTE J1810197, whose decrease of spin-down rate and flux density and changes of pulse profile have been argued to be caused by a net change of plasma density of (Camilo et al., 2007b), the extra plasma we need to explain the torque of PSR J11196129 is much larger. It is not clear if such high magnetospheric charge densities can be sustained long enough to explain the spin-down of J11196127. More realistic pulsar wind and particle acceleration models need to be taken into consideration in order to obtain self-consistent explanations (e.g., Li et al., 2014; Xu & Qiao, 2001).
5 Summary
We presented the spin frequency, flux density and pulse profile evolution of PSR J11196127 following the X-ray bursts detected in July, 2016, using data taken with the Parkes radio telescope. While PSR J11196127 showed radio properties, such as dramatic changes of pulse profile and flux density variability, shared by other magnetars, the peculiar spin frequency evolution is clearly different from what has been observed from magnetars and high- pulsars before. Therefore, as the first rotation-powered, radio pulsar to show magnetar-like activities, PSR J11196127 provides us the best case to study the connection between high-B pulsars and magnetars.
Acknowledgements
The Parkes radio telescope is part of the Australia Telescope National Facility which is funded by the Commonwealth of Australia for operation as a National Facility managed by CSIRO. Work at NRL is supported by NASA. P.E. and N.R. acknowledge funding in the framework of the NWO Vidi award A.2320.0076.
References
- Abdo et al. (2013) Abdo, A. A., Ajello, M., Allafort, A., et al. 2013, ApJS, 208, 17
- Akbal et al. (2015) Akbal, O., Gügercinoğlu, E., Şaşmaz Muş, S., & Alpar, M. A. 2015, MNRAS, 449, 933
- Antonopoulou et al. (2015) Antonopoulou, D., Weltevrede, P., Espinoza, C. M., et al. 2015, MNRAS, 447, 3924
- Archibald et al. (2008) Archibald, A. M., Kaspi, V. M., Livingstone, M. A., & McLaughlin, M. A. 2008, ApJ, 688, 550-554
- Archibald et al. (2013) Archibald, R. F., Kaspi, V. M., Ng, C.-Y., et al. 2013, Nature, 497, 591
- Archibald et al. (2016) Archibald, R. F., Kaspi, V. M., Tendulkar, S. P., & Scholz, P. 2016, ApJ, 829, L21
- Archibald et al. (2017) Archibald, R. F., Burgay, M., Lyutikov, M., et al. 2017, ApJ, 849, L20
- Blumer et al. (2017) Blumer, H., Safi-Harb, S., & McLaughlin, M. A. 2017, ApJ, 850, L18
- Brook et al. (2016) Brook, P. R., Karastergiou, A., Johnston, S., et al. 2016, MNRAS, 456, 1374
- Burgay et al. (2016a) Burgay, M., Possenti, A., Kerr, M., et al. 2016, The Astronomer’s Telegram, 9286
- Burgay et al. (2016b) Burgay, M., Possenti, A., Kerr, M., et al. 2016, The Astronomer’s Telegram, 9366
- Camilo et al. (2000) Camilo, F., Kaspi, V. M., Lyne, A. G., et al. 2000, ApJ, 541, 367
- Camilo et al. (2006) Camilo, F., Ransom, S. M., Halpern, J. P., et al. 2006, Nature, 442, 892
- Camilo et al. (2007a) Camilo, F., Reynolds, J., Johnston, S., et al. 2007, ApJ, 659, L37
- Camilo et al. (2007b) Camilo, F., Cognard, I., Ransom, S. M., et al. 2007, ApJ, 663, 497
- Camilo et al. (2008) Camilo, F., Reynolds, J., Johnston, S., Halpern, J. P., & Ransom, S. M. 2008, ApJ, 679, 681-686
- Coti Zelati et al. (2018) Coti Zelati, F., Rea, N., Pons, J. A., Campana, S., & Esposito, P. 2018, MNRAS, 474, 961
- Esposito et al. (2018) Esposito, P., Rea, N., & Israel, G. L. 2018, arXiv:1803.05716
- Everett & Weisberg (2001) Everett, J. E., & Weisberg, J. M. 2001, ApJ, 553, 341
- Gavriil et al. (2008) Gavriil, F. P., Gonzalez, M. E., Gotthelf, E. V., et al. 2008, Science, 319, 1802
- Göğüş et al. (2016) Göğüş, E., Lin, L., Kaneko, Y., et al. 2016, ApJ, 829, L25
- Goldreich & Julian (1969) Goldreich, P., & Julian, W. H. 1969, ApJ, 157, 869
- Harding et al. (1999) Harding, A. K., Contopoulos, I., & Kazanas, D. 1999, ApJ, 525, L125
- Hotan et al. (2004) Hotan, A. W., van Straten, W., & Manchester, R. N. 2004, Publ. Astron. Soc. Australia, 21, 302
- Johnston & Weisberg (2006) Johnston, S., & Weisberg, J. M. 2006, MNRAS, 368, 1856
- Johnston & Kerr (2018) Johnston, S., & Kerr, M. 2018, MNRAS, 474, 4629
- Kaspi & McLaughlin (2005) Kaspi, V. M., & McLaughlin, M. A. 2005, ApJ, 618, L41
- Kaspi & Beloborodov (2017) Kaspi, V. M., & Beloborodov, A. M. 2017, ARA&A, 55, 261
- Keith et al. (2013) Keith, M. J., Shannon, R. M., & Johnston, S. 2013, MNRAS, 432, 3080
- Kennea et al. (2016) Kennea, J. A., Lien, A. Y., Marshall, F. E., et al. 2016, The Astronomer’s Telegram, 9274
- Kerr et al. (2018) Kerr, M., Coles, W. A., Ward, C. A., et al. 2018, MNRAS, 474, 4637
- Kramer et al. (2006) Kramer, M., Lyne, A. G., O’Brien, J. T., Jordan, C. A., & Lorimer, D. R. 2006, Science, 312, 549
- Kuiper & Hermsen (2009) Kuiper, L., & Hermsen, W. 2009, A&A, 501, 1031
- Levin et al. (2012) Levin, L., Bailes, M., Bates, S. D., et al. 2012, MNRAS, 422, 2489
- Li et al. (2014) Li, L., Tong, H., Yan, W. M., et al. 2014, ApJ, 788, 16
- Livingstone et al. (2010) Livingstone, M. A., Kaspi, V. M., & Gavriil, F. P. 2010, ApJ, 710, 1710
- Livingstone et al. (2011) Livingstone, M. A., Ng, C.-Y., Kaspi, V. M., Gavriil, F. P., & Gotthelf, E. V. 2011, ApJ, 730, 66
- Lyne et al. (2010) Lyne, A., Hobbs, G., Kramer, M., Stairs, I., & Stappers, B. 2010, Science, 329, 408
- Majid et al. (2017) Majid, W. A., Pearlman, A. B., Dobreva, T., et al. 2017, ApJ, 834, L2
- Ng & Kaspi (2011) Ng, C.-Y., & Kaspi, V. M. 2011, American Institute of Physics Conference Series, 1379, 60
- Olausen & Kaspi (2014) Olausen, S. A., & Kaspi, V. M. 2014, ApJS, 212, 6
- Palfreyman et al. (2018) Palfreyman, J. L., Dickey, J. M., Hotan, A. W., et al. 2018, Nature, 556, 219
- Petroff et al. (2013) Petroff, E., Keith, M. J., Johnston, S., van Straten, W., & Shannon, R. M. 2013, MNRAS, 435, 1610
- Rea et al. (2010) Rea, N., Esposito, P., Turolla, R., et al. 2010, Science, 330, 944
- Rea et al. (2012) Rea, N., Israel, G. L., Esposito, P., et al. 2012, ApJ, 754, 27
- Rookyard et al. (2017) Rookyard, S. C., Weltevrede, P., Johnston, S., & Kerr, M. 2017, MNRAS, 464, 2018
- Thompson & Duncan (1996) Thompson, C., & Duncan, R. C. 1996, ApJ, 473, 322
- Tong et al. (2013) Tong, H., Xu, R. X., Song, L. M., & Qiao, G. J. 2013, ApJ, 768, 144
- Tong (2014) Tong, H. 2014, ApJ, 784, 86
- Viganò et al. (2013) Viganò, D., Rea, N., Pons, J. A., et al. 2013, MNRAS, 434, 123
- Weltevrede et al. (2006) Weltevrede, P., Edwards, R. T., & Stappers, B. W. 2006, A&A, 445, 243
- Weltevrede et al. (2010) Weltevrede, P., Johnston, S., Manchester, R. N., et al. 2010, Publ. Astron. Soc. Australia, 27, 64
- Weltevrede et al. (2011) Weltevrede, P., Johnston, S., & Espinoza, C. M. 2011, MNRAS, 411, 1917
- Weltevrede (2016) Weltevrede, P. 2016, A&A, 590, A109
- Xu & Qiao (2001) Xu, R. X., & Qiao, G. J. 2001, ApJ, 561, L85
- Younes et al. (2016) Younes, G., Kouveliotou, C., & Roberts, O. 2016, GCN, 19736