Interplay of lattice, electronic and spin degrees of freedom in detwinned BaFe2As2:
a Raman scattering study
Abstract
We report results of Raman scattering experiments on twin-free BaFe2As2 with the main focus placed on understanding the influence of electronic and spin degrees of freedom on the lattice dynamics. In particular, we scrutinize the modes and the As mode. Each of the two phonons in the tetragonal phase is observed to split into a and a mode upon entering the orthorhombic stripe-magnetic phase. The splitting amounts to approximately 10 cm-1 and less than 5 cm-1 for the low- and the high-energy mode, respectively. The detailed study of the fully symmetric As mode using parallel incident and outgoing photon polarizations along either the antiferromagnetic or the ferromagnetic Fe-Fe direction reveals an anisotropic variation of the spectral weight with the energy of the exciting laser indicating a polarization-dependent resonance effect. Along with the experiments we present results from density functional theory calculations of the phonon eigenvectors, the dielectric function, and the Raman tensor elements. The comparison of theory and experiment indicates that (i) orbital-selective electronic correlations are crucial to understand the lattice dynamics and (ii) all phonon anomalies originate predominantly from the magnetic ordering and the corresponding reconstruction of the electronic bands at all energies.
pacs:
63.20.K-, 78.30.-j, 74.70.Xa, 75.25.DkI Introduction
One of the most debated issues in Fe-based superconductors is the interplay of spin, orbital and lattice degrees of freedom at the onset of magnetism, nematicity and superconductivity. Sefat and Singh (2011); Wang et al. (2015); Gallais and Paul (2016); Yi et al. (2017); Böhmer and Kreisel (2018) Actually, phonons may play a decisive role for probing subtle changes of the electronic and magnetic properties. For instance, soon after the discovery of Fe-based superconductors the magnetic moment was predicted to couple to the As position. Yildirim (2009) Zbiri et al. found a modulation of the electronic density of states at the Fermi energy by the two and the modes. Zbiri et al. (2009) Various anomalies were observed experimentally using neutron, Raman and optical spectroscopy, Chauvière et al. (2009, 2011); Rahlenbeck et al. (2009); Kumar et al. (2010); Mittal et al. (2009); Gnezdilov et al. (2013, 2011); Akrap et al. (2009) but are not fully understood yet.
One particular effect is the observation of substantial Raman scattering intensity of the As phonon below the magneto-structural transition in crossed polarizations with the electric fields oriented along the axes of the pseudo-tetragonal 2 Fe unit cell Chauvière et al. (2011) [For the definition of the axes see Fig. 1 (a)]. García-Martínez et al. argued that magnetism sufficiently modifies the low-energy electronic structure to explain this anomalous intensity.García-Martínez et al. (2013) Recent experiments seem to support this view Wu et al. (2017) upon comparing spectra obtained with parallel and crossed polarizations in twinned samples with the incident field oriented along the and the scattered field either along the or axis, respectively. Yet, to which extent the phonons are affected by correlations and magnetic-ordering-induced changes in the electronic structure at energies in the range of the photon energies is still unclear.
In this work we address this issue both experimentally and theoretically and investigate how magnetism and the combination of moderately correlated Fe states and uncorrelated As states affect such complex spectroscopic properties as, for instance, resonant Raman scattering. In particular, we try to clarify whether the observed anomalous intensity of the As mode is a low- or a high-energy phenomenon and aim at identifying the driving force behind the ordering instabilities.
In our study we find that very good agreement between experimental observations and density functional theory (DFT) calculations can be achieved in both the paramagnetic and the antiferromagnetic state of BaFe2As2 if two physically motivated modifications are being made to the standard DFT electronic bands. On the one hand, we need to account for the fact that the high-temperature tetragonal phase is paramagnetically disordered, and cannot be simulated by calculations with suppressed local magnetism.Mazin et al. (2008) Besides, it appears necessary not only to introduce an antiferromagnetic order in the calculations, but also to account for strong correlations. The latter is achieved by separating the energy bands into two regions, a high-energy region with predominantly As states and a low-energy region with predominantly Fe states. The Fe states are then appropriately renormalized. With these two assumptions we can reproduce (i) the positions of the Raman active phonons and their splitting and evolution in the (mechanically detwinned) orthorhombic antiferromagnetic state and (ii) Raman intensities, including the anisotropy as well as the complex resonant evolution with the laser light frequency. This agreement gives an experimental justification to the proposed computational procedure and convincingly substantiates the physical concepts it was derived from, namely the pivotal role of local moments in the lattice dynamics of Fe-based superconductors, and the importance of band renormalizations for -electrons.
II Methods
II.1 Samples
The BaFe2As2 crystal was prepared using a self-flux technique. Details of the crystal growth and characterization are described elsewhere.Chu et al. (2009) BaFe2As2 is a parent compound of double-layer iron-based superconductors and orders in a stripe-like spin-density-wave (SDW) below . Superconductivity can be obtained by substituting any of the ions or by pressure.Kimber et al. (2009) In Ba(Fe1-xCox)2As2 () the SDW is preceded by a structural phase transition from a tetragonal () to an orthorhombic () lattice at .Chu et al. (2009) It remains a matter of debate as to whether or not and coincide in BaFe2As2.Chu et al. (2009); Kim et al. (2011)
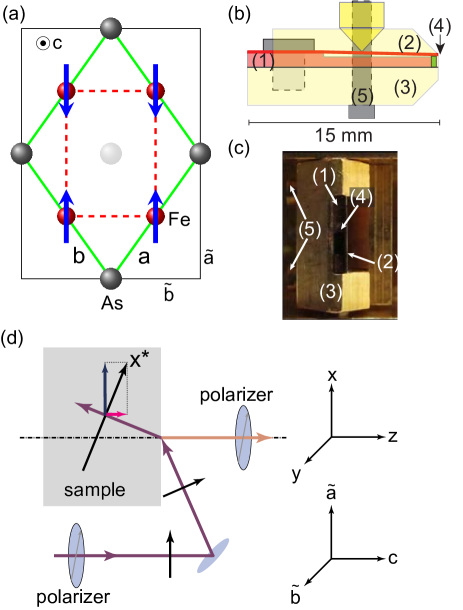
Fig. 1(a) shows the relation of the various axes. The axes of the tetragonal crystal (, green lines) are denoted and with . The axes of the magnetically ordered structure (4 Fe per unit cell, black lines), and , differ by approximately 0.7% below Rotter et al. (2008) and the Fe-Fe distance along the axis becomes shorter than along the axis as sketched in Figure 1(a). As a result, the angle between and differs from 90∘ by approximately 0.4∘.
Below the spins order ferromagnetically along and antiferromagnetically along . Due to the small difference between and the crystals are twinned below , and the orthogonal and axes change roles at twin boundaries running along the directions of the tetragonal and axes. The orthorhombic distortion makes the proper definition of the axes important as has been shown for twin-free crystals by longitudinal and optical transport as well as by ARPES.Chu et al. (2010); Ying et al. (2011); Dusza et al. (2011, 2012); Nakajima et al. (2011); Yi et al. (2011) In order to obtain a single-domain orthorhombic crystal we constructed a sample holder for applying uniaxial pressure parallel to the Fe-Fe direction.
II.2 Detwinning clamp
The detwinning clamp is similar to that used by Chu et al.Chu et al. (2010) Fig. 1(b) and (c) show, respectively, a schematic drawing and a photograph of the clamp. The sample is attached to a thermally sinked copper block (1) with GE varnish, which remains sufficiently elastic at low temperatures and maintains good thermal contact between the holder (3) and the sample (4). The stress is applied using a copper-beryllium cantilever (2) which presses the sample against the body of the clamp. Upon tightening the screws (5) the force on the sample can be adjusted. In our experiment, the pressure is applied along the Fe-Fe bonds. The axis of the sample is perpendicular to the force and parallel to the optical axis. The uniaxial pressure can be estimated from the rate of change of the tetragonal-to-orthorhombic phase transition at . Using the experimentally derived rate of \SIunits1\usk K per \SIunits7\usk M Pa Liang et al. (2011); Blomberg et al. (2012) we find approximately \SIunits35\usk M Pa for our experiment to be sufficient to detwin the sample.
II.3 Light scattering
The experiment was performed with a standard light scattering setup. We used two ion lasers (Ar+ Coherent Innova 304C and Kr+ Coherent Innova 400) and two diode pumped solid state lasers (Coherent Genesis MX SLM, Laser Quantum Ignis) providing a total of 14 lines ranging from \SIunits407\usk n m to \SIunits676\usk n m , corresponding to incident energies between 3.1 and 1.8 eV. Due to this wide range the raw data have to be corrected. The quantity of interest is the response function where is the Raman shift, is the energy of the scattered photons and is an experimental constant. Details of the calibration are described in Appendix A.
Application of the Raman selection rules requires well-defined polarizations for the exciting and scattered photons. The polarizations are given in Porto notation with the first and the second symbol indicating the directions of the incoming and scattered photons’ electric fields eI and eS, respectively. We use for the laboratory system [see Fig. 1(d)]. The plane is vertical and defines the plane of incidence, is horizontal, is the sample surface, and the axis is parallel to the optical axis and to the crystallographic axis. For the sample orientation used here (see Fig. 1) the Fe-Fe bonds are parallel to and , specifically and . Since the orthorhombicity below is small the angle between and deviates only by 0.2∘ from 45∘. It is therefore an excellent approximation to use and .
As the angle of incidence of the exciting photons is as large as 66∘ in our setup [see Fig. 1(d)] the orientations of eI parallel and perpendicular to the plane are inequivalent. In particular, eI has a projection on the axis for . This effect was used beforeChauvière et al. (2009) and allows one to project out the phonons in the and configurations, where inside the crystal [see Fig. 1(d)]. For BaFe2As2 the index of refraction is at 514 nm resulting in for an angle of incidence of 66∘. The corresponding intensity contribution is then 0.16. As a consequence, and are inequivalent whereas and are equivalent for having the same projection on the direction. Upon comparing and the leakage of the -axis polarized contributions to the electronic continuum can be tested. In the case here, they are below the experimental sensitivity. The effect of the finite angle of acceptance of the collection optics ( corresponding to a solid angle of 0.21 sr) on the projections of the scattered photons can be neglected.
II.4 Theoretical Calculations
The phonon eigenvectors (displacement patterns of the vibrating atoms in branch ) and the energies of all Raman-active phonons of BaFe2As2 in the tetragonal () and the orthorhombic () phases were obtained from ab initio DFT calculations within the Perdew-Burke-Ernzerhof parameterization Perdew et al. (1996) of the generalized gradient approximation. The phonon frequencies were calculated by diagonalizing the dynamical matrices using the phonopy package. Togo et al. (2008); Togo and Tanaka (2015) The dynamical matrices were constructed from force constants determined via the finite displacement method in 2 2 1 supercells. Parlinski et al. (1997) As a basis for the calculations we used the projector augmented wave approximation, Blöchl (1994) as implemented in the Vienna package (VASP). Kresse and Hafner (1993); Kresse, G. and Furthmüller, J. (1996); Kresse and Furthmüller (1996) The Brillouin zone for one unit cell was sampled with a k point mesh, and the plane wave cutoff was set at 520 eV. For the tetragonal phase, we used a Néel-type magnetic order to relax the structure and to obtain the experimental lattice parameters. 111The local correlations in the tetragonal phase are of the stripe type; however, we had to use a pattern that does not break the symmetry, and it is known Mazin et al. (2008) that the difference in the calculated elastic properties calculated within different magnetic orders is much smaller than between magnetic and nonmagnetic calculations For the orthorhombic phase, we used the stripe-like magnetic order shown in Fig. 1(a).
In addition, we studied the resonant phonon-photon interaction by exploring the dielectric tensor . The latter was determined using the Optics code package Ambrosch-Draxl and Sofo (2006) implemented in WIEN2k (Ref. Blaha et al., 2001) with the full-potential linearized augmented plane-wave (LAPW) basis. The Perdew-Burke-Ernzerhof generalized gradient approximation Perdew et al. (1996) was employed as the exchange correlation functional and the basis-size controlling parameter RKmax was set to 8.5. A mesh of 400 k points in the first Brillouin zone for the self-consistency cycle was used. The density of states (DOS) and dielectric tensors were computed using a k mesh. For the dielectric tensor a Lorentzian broadening of 0.1 eV was introduced.
The (generally complex) Raman tensor is determined by the derivative of the dielectric tensor elements with respect to the normal coordinate of the respective phonon, . Since we are interested only in the resonance behavior of the As phonon, we are only concerned with the derivative with respect to ,
| (1) |
III Results and Discussion
| Exp. (140 K) | Theory | Exp. (60 K) | Theory | |||
|---|---|---|---|---|---|---|
| 180 | 168 | 180 | 172 | |||
| 215 | 218 | 215 | 221 | |||
| 130 | 140 | 125 | 110 | |||
| 135 | 133 | |||||
| 268 | 290 | 270 | 272 | |||
| 273 | 287 | |||||
III.1 Lattice dynamics
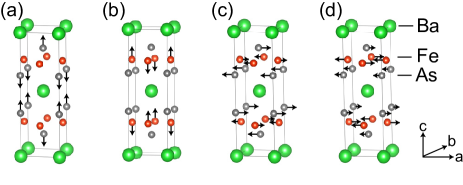
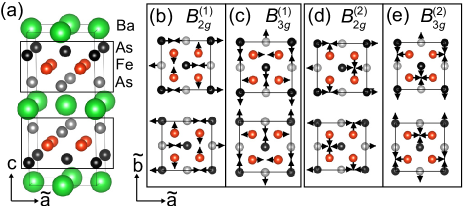
The energies and symmetries as obtained from lattice dynamical calculations for tetragonal and orthorhombic BaFe2As2 are compiled in Table 1. The four modes in tetragonal symmetry obey + + 2 selection rules. The eigenvectors are depicted in Fig. 2. In the orthorhombic phase, the two modes are expected to split into and modes. Thus, there are six non-degenerate modes in the orthorhombic phase, + + 2 + 2 . Table 1 shows the symmetry relations between the tetragonal and orthorhombic phonons.
Since the and eigenvectors remain unchanged upon entering the orthorhombic phase, only those of the and phonons are shown in Fig. 3. For the and phonons the As and Fe atoms move perpendicular to the axis and perpendicular to each other. The calculated phonon vibrations agree with previous results for BaFe2As2, Zbiri et al. (2009) however our energies differ slightly from those reported by Zbiri et al. Zbiri et al. (2009) In particular, we find a splitting between the and phonons.
-
III.2 phonons
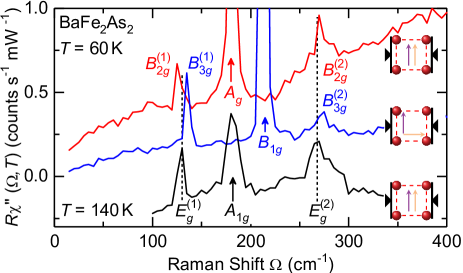
Table 1 displays the experimental phonon energies as measured above and below the magneto-structural transition along with the theoretical values. The phonon found at 130 cm-1 above splits into two well separated lines as predicted (Table 1) and shown in Fig. 4. The splitting of the mode at 268 cm-1 is small, and the and modes are shifted to higher energies by 2 , and 5 cm-1, respectively.
The theoretical and experimental phonon energies are in agreement to within 14% for both crystal symmetries. The splitting between the and modes is overestimated in the calculations.
Previous experiments were performed on twinned crystals, Chauvière et al. (2009); Ren et al. (2015); Zhang et al. (2016) and the and modes were observed next to each other in a single spectrum. An equivalent result can be obtained in de-twinned samples by using , or polarizations where the and axes are simultaneously projected (along with the axis). In neither case the symmetry of the and phonons can be pinned down. Only in a de-twinned sample where the and configurations are projected separately the and modes can be accessed independently.
Uniaxial pressure along the Fe-Fe direction, as shown by the black arrows in the insets of Fig. 4, determines the orientation of the shorter axis. This configuration enables us to observe the mode at 125 cm-1 and the mode at 135 cm-1 in and, respectively, polarization configurations thus augmenting earlier work. With the shorter axis determined by the direction of the stress (insets of Fig. 4) the assignment of the and modes is unambiguous. Since the spectrum (red) comprises and polarizations both the and the phonons appear. The spectrum (blue) includes the () and () symmetries.
The calculated splitting between the and modes is smaller for the than for the mode, qualitatively agreeing with the experiment. However, in the calculations this difference is entirely due to the different reduced masses for these modes since the and phonon are dominated by As and Fe motions, respectively. In the experiment the splitting for the mode is close to the spectral resolution, indicating an additional reduction of the splitting below that obtained in the calculation. The source of this additional reduction is unclear at the moment.
III.3 As phonon intensity
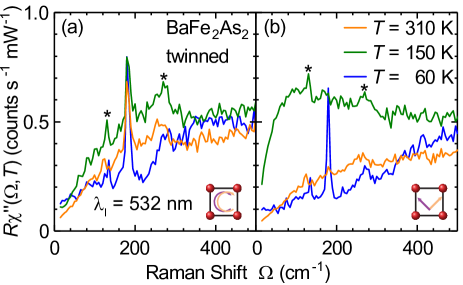
Fig. 5 shows low-energy spectra of twinned BaFe2As2 for (a) and (b) polarization configurations at 310 (orange), 150 (green), and 60 K (blue). The As phonon at 180 is the strongest line in the spectra at all temperatures as expected and gains intensity upon cooling. In polarizations there is no contribution from the As mode above . Below (blue spectrum) the As phonon assumes a similar intensity as in the polarization as reported earlier. Chauvière et al. (2009); Wu et al. (2017) Due to a finite projection of the incident light polarizations onto the axis [see Fig. 1(d)] in both and configurations the phonons appear in all spectra (asterisks). The electronic background has been extensively discussed in previous works Choi et al. (2008); Chauvière et al. (2010); Sugai et al. (2012); Kretzschmar et al. (2016); Thorsmølle et al. (2016) and is not a subject of the study here.
In order to understand the appearance of the As line in the crossed polarizations it is sufficient to consider the in-plane components of the Raman tensor,
| (2) |
The response of this phonon for the polarization configuration (eI,eS) is given by (where ∗ means conjugate transposed). In the tetragonal () case the two elements are equal, , and the phonon appears only for . In the orthorhombic phase the tensor elements are different, and one can expect the phonon to appear for since the intensity then depends on the difference between and . In detwinned samples and can be accessed independently by using parallel polarizations for the incident and scattered light oriented along either the or the axis. In addition, putative imaginary parts of may be detected by analyzing more than two polarization combinations as discussed in Appendix C. Spectra for and configurations are shown in Figure 7 of Appendix B.
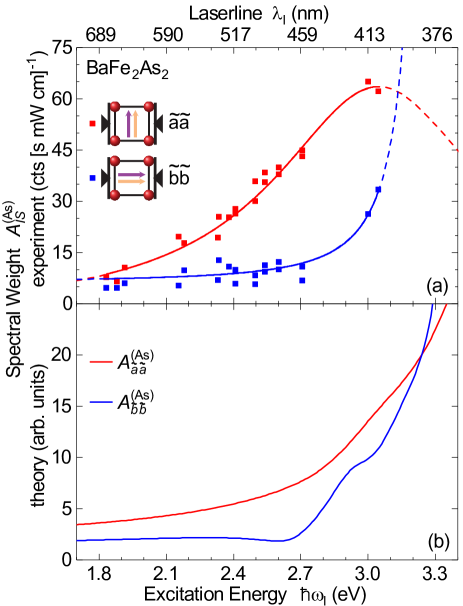
We proceed now with the analysis of the phonon spectral weight as a function of the incident photon excitation energy () and polarization. Fig. 6(a) shows as derived by fitting the peak with a Voigt function, after subtracting a linear background. Measurements were repeated several times in order to check the reproducibility. The variation of the spectral weight between different measurements can be taken as an estimate of the experimental error. For light polarizations parallel to the antiferromagnetic axis, (red squares) increases continuously with increasing whereas (blue squares) stays virtually constant for incident photons in the red and green spectral range, , and increases rapidly for . For all wavelengths the spectral weight is higher for the than for the configuration.
The variations of and display a typical resonance behavior, Cardona (1982) which is expected when the intermediate state of the Raman scattering process is an eigenstate of the electronic system. Then in second order perturbation theory the intensity diverges as where is the energy difference between an occupied and an unoccupied electronic Bloch state. In real systems having a finite electronic lifetime a Lorentzian profile is expected. We therefore approximated with Lorentzians centered at as shown by solid lines in Fig. 6(a). From these model functions we determine and .
In order to compare the experimental observations with theoretical calculations of the phonon spectral weights the band structure needs to be renormalized so as to account for correlation effects (for details see Appendix D). Specifically, we differentiate three regions: (i) the unoccupied Fe bands near the Fermi energy that we renormalize via a rescaling factor, (ii) the occupied bands below -2.7 eV of predominantly As character that remain unchanged and (iii) the occupied bands between -2.7 eV and the Fermi level derived from hybridized Fe and As orbitals. Due to this hybridization, the renormalization of the latter bands cannot be performed by simple rescaling. One can anticipate that the optical absorption would set in at energies below 1.8 eV, smaller than our minimal laser energy, if the occupied Fe bands would have been renormalized prior to hybridization with the As bands. Due to the small density of states of the As bands in the range from -2.7 eV to their contribution to the dielectric function would be small. With this in mind, we simply excluded all occupied bands in this range from the calculations. The effect of these bands, although small, could be accounted for using the DMFT method, which, however, is beyond the scope of our present work.
We then determine the dielectric tensor and the Raman tensor (section II.4) on the basis of this renormalized band structure for the ordered state. Since our resonances lie in the range eV our calculations can capture the intensities and the anisotropy in this range of energies rather well as can be seen in Fig. 6(b).
With this analysis, we interpret our joint experimental and theoretical results as evidence that resonance effects are the main source of the anomalous intensity of the As phonon in crossed polarizations. The main experimental argument is based on the anisotropic variation of the phonon intensities with in and polarization configurations, while the theoretical derivation of the tensor elements demonstrates the importance of magnetic order and correlation effects for the band reconstruction.
As proposed previously,García-Martínez et al. (2013) magnetism appears to be the origin of the anisotropy. However, the intensity anisotropy cannot be explained without taking into account the high-energy electronic states.
Finally, we briefly looked into the effect of doping on the anomaly and found further support for its magnetic origin. In Ba(Fe1-xCox)2As2 the transition temperature is several degrees below for finite , and one observes that the anomaly of the As phonon does not commence at , but rather at the magnetic transition. For the phonon assumes intensity in crossed polarizations only below (see supplementary information of Ref. Kretzschmar et al., 2016). For the anomaly starts to appear at , as displayed in Fig. 10 in the Appendix, but the spectral weight does not show an order-parameter-like temperature dependence. The increase is nearly linear and saturates below at a value which is smaller by a factor of approximately 7 than that in polarization projecting / symmetry. In FeSe, with a structural transition at K but no long range magnetism, Baek et al. (2014) the anomalous intensity can also be observed below but the intensity relative to that in the projection is only 1%, as shown in Fig. 11. Similar to Ba(Fe0.949Co0.051)2As2, the spectral weight increases approximately linearly but does not saturate, presumably because FeSe does not develop long-ranged magnetic order.
IV Conclusion
We studied the two phonons and the fully symmetric As vibration in twin-free BaFe2As2 by Raman scattering. The tetragonal phonon at 130 () splits into two modes in the orthorhombic phase. The detwinning allows us to identify the modes at 125 and 135 as and phonons, respectively. DFT calculations predict the symmetries correctly and show that the splitting occurs because of the stripe magnetic order.
The As phonon was studied for various laser lines in the range 1.8 to 3.1 eV. In the ordered phase the spectral weight of the phonon resonates for an excitation energy of () eV. The resonance energy is almost the same for the light polarized along the ferro- or antiferromagnetic directions and [for the definition of the axes see Fig. 1(a)], whereas the variation of the spectral weight with the energy of the incident photon is rather different for the and configurations.
We find that our DFT calculations reproduce the anisotropy and the resonance very well for energies above 2.7 eV if we include both the effects of the magnetism and of the strong correlations in the Fe orbitals, responsible for the band renormalization. For energies below 2.7 eV our approximation is only semi-quantitative, because the occupied Fe bands are strongly hybridized with the As bands and cannot be renormalized by simple rescaling. As in the case of the phonons, all effects are strongly linked to magnetism. However, in the case of the As phonon the inclusion of electronic states at high energies is essential because of the resonance behavior. Therefore, low-energy physics with magnetism-induced anisotropic electron-phonon coupling García-Martínez et al. (2013) is probably insufficient for explaining the anomalous intensity in crossed polarizations.
Acknowledgement
We gratefully acknowledge discussions with L. Degiorgi and thank him for providing us with raw and analyzed IR data of BaFe2As2. The work was supported by the German Research Foundation (DFG) via the Priority Program SPP 1458, the Transregional Collaborative Research Centers TRR 80, TRR 49 and by the Serbian Ministry of Education, Science and Technological Development under Project III45018. We acknowledge support by the DAAD through the bilateral project between Serbia and Germany (grant numbers 56267076 and 57142964). The collaboration with Stanford University was supported by the Bavaria California Technology Center BaCaTeC (grant-no. A5 [2012-2]). Work in the SIMES at Stanford University and SLAC was supported by the U.S. Department of Energy, Office of Basic Energy Sciences, Division of Materials Sciences and Engineering, under Contract No. DE-AC02-76SF00515. Y.L. and R.V. acknowledge the allotment of computer time at the Centre for Scientific Computing (CSC) in Frankfurt. I.I.M. was supported by ONR through the NRL basic research program and by the Alexander von Humboldt foundation.
Appendix A Calibration of the sensitivity
Scattering experiments performed over a wide energy range necessitate an appropriate correction of the data. The quantity of interest is the response function where is the Raman shift, and is the energy of the scattered photons. includes all experimental constants and units in a way that is as close as possible to the count rate , measured for a given laser power absorbed by the sample. is the number of incoming photons per unit time and refer to both photon energies and polarizations. With the (nearly) energy-independent area of the laser focus the cross section is given by Muschler et al. (2010)
| (3) |
and are a constant and the relative sensitivity, respectively. is assumed to be dimensionless and includes energy-dependent factors such as surface losses, penetration depth, and the monochromatic efficiency of the setup. and are the bandwidth and the solid angle of acceptance, respectively, and depend both on . is determined by calibration and used for correcting the raw data. The resulting rate is close to in the range cm-1 but increasingly different for larger energy transfers mainly for the strong variation of .
Applying the fluctuation-dissipation theorem, one obtains
| (4) | |||||
where is another constant, which is proportional to , is the thermal Bose factor and is the classical electron radius. Finally, after collecting all energy-independent factors in we obtain
| (5) |
Here, is inserted for convenience to get a correction close to unity. Therefore, the spectra shown reflect the measured number of photon counts per second and mW absorbed power as closely as possible, thus approximately obeying counting statistics as intended. Since the spectra are taken with constant slit width the spectral resolution depends on energy, and narrow structures such as phonons may change their shapes but the spectral weight is energy independent.
Appendix B spectra
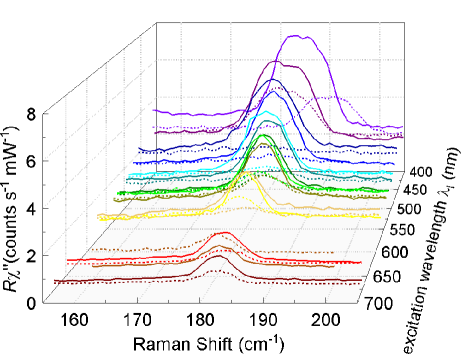
Fig. 7 shows the complete set of the spectra we measured for detwinned BaFe2As2. All spectra were corrected as described in Appendix A. For all spectra the same constant width of m of the intermediate slit of the spectrometer was used. This results in an energy-dependent resolution varying between approximately 12 at 24,630 (3.05 eV or 406 nm) and 3 at 14,793 (1.83 eV or 676 nm). Accordingly, the width of the peak changes as a function of the excitation wavelength and does not reflect the intrinsic line width of the phonon, in particular not for blue photons. The intensity of the peak monotonically increases towards short wavelengths for the spectra (solid lines). For light polarized parallel to the ferromagnetic axis (, dashed lines) the intensity is low for , but strongly increases for . The underlying electronic continuum, which is not a subject of this paper, also changes in intensity as a function of the excitation wavelength.
From the spectra the spectral weight of the phonon can be derived by fitting a Voigt function to the phonon peak after subtracting a linear background. The width of the Gaussian part of the Voigt function is given by the known resolution of the spectrometer while that of the Lorentzian part reflects the line width of the phonon.
Appendix C Spectral weight for and polarizations
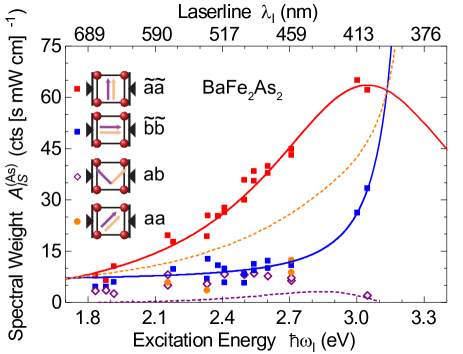
For clarity, Fig. 6(a) displays only part of the data we collected. We also measured spectra in and configurations (cf. Figs. 1(a) and 8 for the definitions) and find them instructive for various reasons. The and data (i) can be compared directly with results presented recently Wu et al. (2017) and (ii) indicate that the Raman tensor has large imaginary parts.
Fig. 8 shows the spectral weights of the As phonon mode for and polarizations, (orange circles) and (open purple diamonds), respectively, for selected wavelengths together with the data and model functions from Fig. 6(a) of the main text. Given the experimental error the respective intensities for and polarizations are rather similar and are also comparable to (blue squares) in the range eV. For eV (406 nm) is very small, for the yellow-green spectral range may be even larger than in qualitative agreement with Ref. Wu et al., 2017.
The elements of a real Raman tensor (Eq. (2) of the main text) can be derived directly from the experimental data as and . Then, the phonon’s spectral weight expected for all other polarizations can be calculated right away, and is just the average of and (dashed orange line in Fig. 8). Obviously, there is no agreement with the experimental values for (orange circles).
can be determined in a similar fashion. In Fig. 8 we show the expected spectral weight as purple dashed line. The dependence on is again derived from the model functions describing the resonance (full red and blue lines). Also for the mismatch between experiment (open purple diamonds) and expectation (purple dashed line) is statistically significant, and one has to conclude that the assumption of real tensor elements in the orthorhombic phase is not valid.
This effect is not particularly surprising in an absorbing material and was in fact discussed earlier for the cuprates. Strach et al. (1998); Ambrosch-Draxl et al. (2002) For the Fe-based systems, the possibility of complex Raman tensor elements for the As phonon was not considered yet. Our experimental observations show that the complex nature of is crucially important and that the imaginary parts of and must have opposite sign to explain the observed enhancement of and the suppression of with respect to the values expected for real tensor elements (dashed orange and purple lines in Fig. 8).
In summary, the results for and support our interpretation that absorption processes are important for the proper interpretation of the Raman data. Currently, we cannot imagine anything else but resonance effects due to interband transitions as the source.
Appendix D Band structure and PDOS
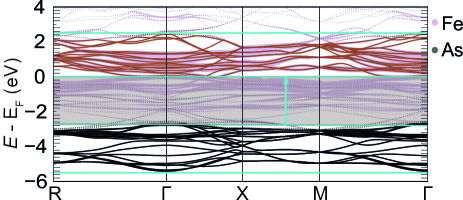
The DFT band structure is shown in Fig. 9. Bands above stem predominantly from Fe orbitals (brown) while for As orbitals prevail (black). For a suitable comparison to the experiment these Fe bands are renormalized by a factor between 2 and 3 (Refs. Skornyakov et al., 2009; Yao et al., 2011; Ferber et al., 2012; Backes et al., 2015) while no renormalization is needed for the As bands. The bands between -2.7 eV and are of mixed Fe/As character and are left out when calculating the dielectric tensor as is illustrated by the grey shade in Fig. 9. Only transitions between the ranges [-5.5 eV,-2.7 eV] and [0,2.6 eV], highlighted by turqouis rectangles, are taken into account. Thus for photon energies below 2.7 eV the absorption in our calculations originates predominantly from the Drude response whereas for eV the results become increasingly realistic since they include interband absorption. In either case we use a phenomenological damping of 0.1 eV. We determine the dielectric tensor and the Raman tensor as described in section II.4 on the basis of this renormalized band structure. While the anisotropy is qualitatively reproduced for all energies as shown in Fig. 6(b) of the main text, the two other experimental quantities, (purple) and (orange) shown in Fig. 8 here, are not captured properly simply because the imaginary parts of the theoretically determined tensor elements become very small below 2.7 eV. In order to describe and absorption processes which lead to imaginary parts of the Raman tensor are necessary. Upon phenomenologically introducing imaginary parts of for low energies, which cut off at 2.7 eV where the correct absorption takes over, full agreement can be achieved. However, a solution on a microscopic basis becomes possible only by using LDADMFT schemes which are beyond the scope of the present work.
Appendix E phonon in crossed polarizations in Ba(Fe1-xCox)2As2 and FeSe
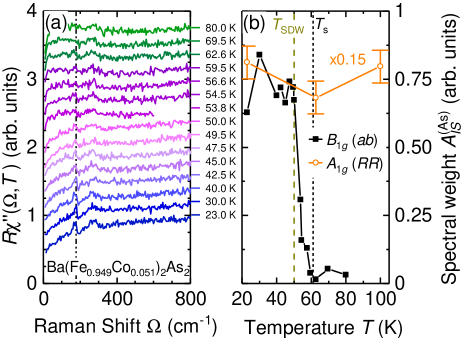
Similarly as in BaFe2As2, the phonon can be observed for crossed polarizations. Fig. 10(a) shows Raman spectra in polarization of Ba(Fe1-xCox)2As2 with % having K and K. The As mode appears below and gains strength upon cooling. Fig. 10(b) shows the corresponding spectral weight as a function of temperature. In the nematic phase the phonon spectral weight increases almost linearly upon cooling and saturates in the magnetic phase for at approximately 15% of that in the fully symmetric channel (/).
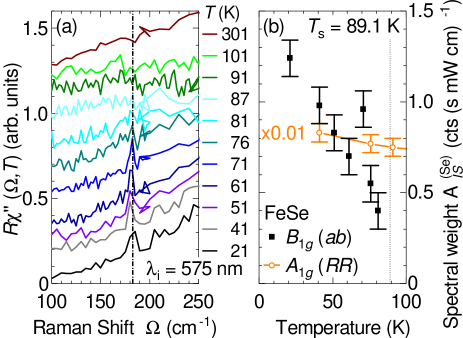
In FeSe the Se phonon appears also in the spectra as shown in Fig. 11(a) when the temperature is lowered below the structural phase transition at K. Upon cooling [Fig. 11(b)] the spectral weight of the phonon increases almost linearly for crossed polarizations (, black squares), but stays virtually constant across the phase transition for parallel light polarizations [, orange circles in Fig. 11(b)]. As opposed to Ba(Fe1-xCox)2As2 no saturation of the spectral weight in polarizations is found, likely because FeSe shows no long range magnetic order down to lowest temperatures. Baek et al. (2014) Only about 1% of the spectral weight of the spectra () is found in crossed polarizations here, in contrast to BaFe2As2 and Ba(Fe1-xCox)2As2, where the spectral weight of the phonon is larger (Figs. 5 and 10).
References
- Sefat and Singh (2011) Athena S. Sefat and David J. Singh, “Chemistry and electronic structure of iron-based superconductors,” MRS Bull. 36, 614–619 (2011).
- Wang et al. (2015) Fa Wang, Steven A. Kivelson, and Dung-Hai Lee, “Nematicity and quantum paramagnetism in FeSe,” Nat. Phys. 11, 959–963 (2015).
- Gallais and Paul (2016) Yann Gallais and Indranil Paul, “Charge nematicity and electronic Raman scattering in iron-based superconductors,” C. R. Phys. 17, 113–139 (2016).
- Yi et al. (2017) Ming Yi, Yan Zhang, Zhi-Xun Shen, and Donghui Lu, “Role of the orbital degree of freedom in iron-based superconductors,” npj Quantum Mater. 2, 57 (2017).
- Böhmer and Kreisel (2018) Anna E. Böhmer and Andreas Kreisel, “Nematicity, magnetism and superconductivity in FeSe,” J. Phys.: Condens. Matter 30, 023001 (2018).
- Yildirim (2009) T. Yildirim, “Strong Coupling of the Fe-Spin State and the As-As Hybridization in Iron-Pnictide Superconductors from First-Principle Calculations,” Phys. Rev. Lett. 102, 037003 (2009).
- Zbiri et al. (2009) M. Zbiri, H. Schober, M. R. Johnson, S. Rols, R. Mittal, Y. Su, M. Rotter, and D. Johrendt, “Ab initio lattice dynamics simulations and inelastic neutron scattering spectra for studying phonons in BaFe2As2: Effect of structural phase transition, structural relaxation, and magnetic ordering,” Phys. Rev. B 79, 064511 (2009).
- Chauvière et al. (2009) L. Chauvière, Y. Gallais, M. Cazayous, A. Sacuto, M. A. Méasson, D. Colson, and A. Forget, “Doping dependence of the lattice dynamics in Ba(Fe1-xCox)2As2 studied by Raman spectroscopy,” Phys. Rev. B 80, 094504 (2009).
- Chauvière et al. (2011) L. Chauvière, Y. Gallais, M. Cazayous, M. A. Méasson, A. Sacuto, D. Colson, and A. Forget, “Raman scattering study of spin-density-wave order and electron-phonon coupling in Ba(Fe1-xCox)2As2,” Phys. Rev. B 84, 104508 (2011).
- Rahlenbeck et al. (2009) M. Rahlenbeck, G. L. Sun, D. L. Sun, C. T. Lin, B. Keimer, and C. Ulrich, “Phonon anomalies in pure and underdoped R1-xKxFe2As2 (R = Ba, Sr) investigated by Raman light scattering,” Phys. Rev. B 80, 064509 (2009).
- Kumar et al. (2010) Pradeep Kumar, Anil Kumar, Surajit Saha, D.V.S. Muthu, J. Prakash, S. Patnaik, U.V. Waghmare, A.K. Ganguli, and A.K. Sood, “Anomalous Raman scattering from phonons and electrons of superconducting FeSe0.82,” Solid State Commun. 150, 557 (2010).
- Mittal et al. (2009) R. Mittal, L. Pintschovius, D. Lamago, R. Heid, K.-P. Bohnen, D. Reznik, S. L. Chaplot, Y. Su, N. Kumar, S. K. Dhar, A. Thamizhavel, and Th. Brueckel, “Measurement of Anomalous Phonon Dispersion of CaFe2As2 Single Crystals Using Inelastic Neutron Scattering,” Phys. Rev. Lett. 102, 217001 (2009).
- Gnezdilov et al. (2013) Vladimir Gnezdilov, Yurii G. Pashkevich, Peter Lemmens, Dirk Wulferding, Tatiana Shevtsova, Alexander Gusev, Dmitry Chareev, and Alexander Vasiliev, “Interplay between lattice and spin states degree of freedom in the FeSe superconductor: Dynamic spin state instabilities,” Phys. Rev. B 87, 144508 (2013).
- Gnezdilov et al. (2011) V. Gnezdilov, Yu. Pashkevich, P. Lemmens, A. Gusev, K. Lamonova, T. Shevtsova, I. Vitebskiy, O. Afanasiev, S. Gnatchenko, V. Tsurkan, J. Deisenhofer, and A. Loidl, “Anomalous optical phonons in FeTe chalcogenides: Spin state, magnetic order, and lattice anharmonicity,” Phys. Rev. B 83, 245127 (2011).
- Akrap et al. (2009) A. Akrap, J. J. Tu, L. J. Li, G. H. Cao, Z. A. Xu, and C. C. Homes, “Infrared phonon anomaly in BaFe2As2,” Phys. Rev. B 80, 180502 (2009).
- García-Martínez et al. (2013) N. A. García-Martínez, B. Valenzuela, S. Ciuchi, E. Cappelluti, M. J. Calderón, and E. Bascones, “Coupling of the As phonon to magnetism in iron pnictides,” Phys. Rev. B 88, 165106 (2013).
- Wu et al. (2017) S.-F. Wu, W.-L. Zhang, V. K. Thorsmølle, G. F. Chen, G. T. Tan, P. C. Dai, Y. G. Shi, C. Q. Jin, T. Shibauchi, S. Kasahara, Y. Matsuda, A. S. Sefat, H. Ding, P. Richard, and G. Blumberg, “Magneto-elastic coupling in Fe-based superconductors,” (2017), arXiv:1712.01896 [cond-mat.supr-con] .
- Mazin et al. (2008) I. I. Mazin, M. D. Johannes, L. Boeri, K. Koepernik, and D. J. Singh, “Problems with reconciling density functional theory calculations with experiment in ferropnictides,” Phys. Rev. B 78, 085104 (2008).
- Chu et al. (2009) Jiun-Haw Chu, James G. Analytis, Chris Kucharczyk, and Ian R. Fisher, “Determination of the phase diagram of the electron-doped superconductor Ba(Fe1-xCox)2As2,” Phys. Rev. B 79, 014506 (2009).
- Kimber et al. (2009) S. A. J. Kimber, A. Kreyssig, Yu-Zhong Zhang, H. O. Jeschke, R. Valentí, F. Yokaichiya, E. Colombier, Jiaqiang Yan, T. C. Hansen, T. Chatterji, R. J. McQueeney, P. C. Canfield, A. I. Goldman, and D. N. Argyriou, “Similarities between structural distortions under pressure and chemical doping in superconducting BaFe2As2,” Nature Mater. 8, 471 (2009).
- Kim et al. (2011) M. G. Kim, R. M. Fernandes, A. Kreyssig, J. W. Kim, A. Thaler, S. L. Bud’ko, P. C. Canfield, R. J. McQueeney, J. Schmalian, and A. I. Goldman, “Character of the structural and magnetic phase transitions in the parent and electron-doped BaFe2As2 compounds,” Phys. Rev. B 83, 134522 (2011).
- Rotter et al. (2008) Marianne Rotter, Marcus Tegel, and Dirk Johrendt, “Superconductivity at 38 K in the Iron Arsenide (Ba1-xKx)Fe2As2,” Phys. Rev. Lett. 101, 107006 (2008).
- Chu et al. (2010) Jiun-Haw Chu, James G. Analytis, Kristiaan De Greve, Peter L. McMahon, Zahirul Islam, Yoshihisa Yamamoto, and Ian R. Fisher, “In-Plane Resistivity Anisotropy in an Underdoped Iron Arsenide Superconductor,” Science 329, 824 (2010).
- Ying et al. (2011) J. J. Ying, X. F. Wang, T. Wu, Z. J. Xiang, R. H. Liu, Y. J. Yan, A. F. Wang, M. Zhang, G. J. Ye, P. Cheng, J. P. Hu, and X. H. Chen, “Measurements of the Anisotropic In-Plane Resistivity of Underdoped FeAs-Based Pnictide Superconductors,” Phys. Rev. Lett. 107, 067001 (2011).
- Dusza et al. (2011) A. Dusza, A. Lucarelli, F. Pfuner, J.-H. Chu, I. R. Fisher, and L. Degiorgi, “Anisotropic charge dynamics in detwinned Ba(Fe1-xCox)2As2,” Europhys. Lett. 93, 37002 (2011).
- Dusza et al. (2012) A. Dusza, A. Lucarelli, A. Sanna, S. Massidda, J.-H. Chu, I.R. Fisher, and L. Degiorgi, “Anisotropic in-plane optical conductivity in detwinned Ba(Fe1-xCox)2As2,” New J. Phys. 14, 023020 (2012).
- Nakajima et al. (2011) M. Nakajima, T. Liang, S. Ishida, Y. Tomioka, K. Kihou, C.H. Lee, A. Iyo, H. Eisaki, T. Kakeshita, T. Ito, and S. Uchida, “Unprecedented anisotropic metallic state in undoped iron arsenide BaFe2As2 revealed by optical spectroscopy,” Proc. Natl. Acad. Sci. 108, 12238 (2011).
- Yi et al. (2011) Ming Yi, Donghui Lu, Jiun-Haw Chu, James G. Analytis, Adam P. Sorini, Alexander F. Kemper, Brian Moritz, Sung-Kwan Mo, Rob G. Moore, Makoto Hashimoto, Wei-Sheng Lee, Zahid Hussain, Thomas P. Devereaux, Ian R. Fisher, and Zhi-Xun Shen, “Symmetry-breaking orbital anisotropy observed for detwinned above the spin density wave transition,” Proc. Natl. Acad. Sci. 108, 6878–6883 (2011).
- Liang et al. (2011) T. Liang, M.Nakajima, K.Kihou, Y.Tomioka, T.Ito, C.H.Lee, H.Kito, A.Iyo, H.Eisaki, T. Kakeshita, and S.Uchida, “Effects of uniaxial pressure and annealing on the resistivity of Ba(Fe1-xCox)2As2,” J. Phys. Chem. Solids 72, 418 (2011).
- Blomberg et al. (2012) E. C. Blomberg, A. Kreyssig, M. A. Tanatar, R. M. Fernandes, M. G. Kim, A. Thaler, J. Schmalian, S. L. Bud’ko, P. C. Canfield, A. I. Goldman, and R. Prozorov, “Effect of tensile stress on the in-plane resistivity anisotropy in BaFe2As2,” Phys. Rev. B 85, 144509 (2012).
- Perdew et al. (1996) John P. Perdew, Kieron Burke, and Matthias Ernzerhof, “Generalized Gradient Approximation Made Simple,” Phys. Rev. Lett. 77, 3865–3868 (1996).
- Togo et al. (2008) Atsushi Togo, Fumiyasu Oba, and Isao Tanaka, “First-principles calculations of the ferroelastic transition between rutile-type and -type at high pressures,” Phys. Rev. B 78, 134106 (2008).
- Togo and Tanaka (2015) Atsushi Togo and Isao Tanaka, “First principles phonon calculations in materials science,” Scr. Mater. 108, 1–5 (2015).
- Parlinski et al. (1997) K. Parlinski, Z. Q. Li, and Y. Kawazoe, “First-Principles Determination of the Soft Mode in Cubic ,” Phys. Rev. Lett. 78, 4063–4066 (1997).
- Blöchl (1994) P. E. Blöchl, “Projector augmented-wave method,” Phys. Rev. B 50, 17953–17979 (1994).
- Kresse and Hafner (1993) G. Kresse and J. Hafner, “Ab initio molecular dynamics for liquid metals,” Phys. Rev. B 47, 558–561 (1993).
- Kresse, G. and Furthmüller, J. (1996) Kresse, G. and Furthmüller, J., “Efficient iterative schemes for ab initio total-energy calculations using a plane-wave basis set,” Phys. Rev. B 54, 11169–11186 (1996).
- Kresse and Furthmüller (1996) G. Kresse and J. Furthmüller, “Efficiency of ab-initio total energy calculations for metals and semiconductors using a plane-wave basis set,” Comput. Mater. Sci. 6, 15–50 (1996).
- Note (1) The local correlations in the tetragonal phase are of the stripe type; however, we had to use a pattern that does not break the symmetry, and it is known Mazin et al. (2008) that the difference in the calculated elastic properties calculated within different magnetic orders is much smaller than between magnetic and nonmagnetic calculations.
- Ambrosch-Draxl and Sofo (2006) Claudia Ambrosch-Draxl and Jorge O. Sofo, “Linear optical properties of solids within the full-potential linearized augmented planewave method,” Comput. Phys. Commun. 175, 1–14 (2006).
- Blaha et al. (2001) Peter Blaha, Karlheinz Schwarz, G. K. H. Madsen, D. Kvasnicka, and J. Luitz, “An Augmented Plane Wave Plus Local Orbitals Program for Calculating Crystal Properties,” (2001).
- Ren et al. (2015) Xiao Ren, Lian Duan, Yuwen Hu, Jiarui Li, Rui Zhang, Huiqian Luo, Pengcheng Dai, and Yuan Li, “Nematic Crossover in under Uniaxial Stress,” Phys. Rev. Lett. 115, 197002 (2015).
- Zhang et al. (2016) W.-L. Zhang, Athena S. Sefat, H. Ding, P. Richard, and G. Blumberg, “Stress-induced nematicity in studied by Raman spectroscopy,” Phys. Rev. B 94, 014513 (2016).
- Choi et al. (2008) K.-Y. Choi, D. Wulferding, P. Lemmens, N. Ni, S. L. Bud’ko, and P. C. Canfield, “Lattice and electronic anomalies of CaFe2As2 studied by Raman spectroscopy,” Phys. Rev. B 78, 212503 (2008).
- Chauvière et al. (2010) L. Chauvière, Y. Gallais, M. Cazayous, M. A. Méasson, A. Sacuto, D. Colson, and A. Forget, “Impact of the spin-density-wave order on the superconducting gap of Ba(Fe1-xCox)2As2,” Phys. Rev. B 82, 180521 (2010).
- Sugai et al. (2012) Shunji Sugai, Yuki Mizuno, Ryoutarou Watanabe, Takahiko Kawaguchi, Koshi Takenaka, Hiroshi Ikuta, Yasumasa Takayanagi, Naoki Hayamizu, and Yasuhiro Sone, “Spin-Density-Wave Gap with Dirac Nodes and Two-Magnon Raman Scattering in BaFe2As2,” J. Phys. Soc. Japan 81, 024718 (2012).
- Kretzschmar et al. (2016) F. Kretzschmar, T. Böhm, U. Karahasanović, B. Muschler, A. Baum, D. Jost, J. Schmalian, S. Caprara, M. Grilli, C. Di Castro, J. H. Analytis, J.-H. Chu, I. R. Fisher, and R. Hackl, “Critical spin fluctuations and the origin of nematic order in ,” Nat. Phys. 12, 560–563 (2016).
- Thorsmølle et al. (2016) V. K. Thorsmølle, M. Khodas, Z. P. Yin, Chenglin Zhang, S. V. Carr, Pengcheng Dai, and G. Blumberg, “Critical quadrupole fluctuations and collective modes in iron pnictide superconductors,” Phys. Rev. B 93, 054515 (2016).
- Cardona (1982) M. Cardona, “Resonance Phenomena,” (Springer-Verlag Berlin Heidelberg, 1982) Chap. 2, pp. 19–178, 1st ed.
- Baek et al. (2014) S.-H. Baek, D. V. Efremov, J. M. Ok, J. S. Kim, Jeroen van den Brink, and B. Büchner, “Orbital-driven nematicity in FeSe,” Nat. Mater. 14, 210–214 (2014).
- Muschler et al. (2010) B. Muschler, W. Prestel, L. Tassini, R. Hackl, M. Lambacher, A. Erb, Seiki Komiya, Yoichi Ando, D.C. Peets, W.N. Hardy, R. Liang, and D.A. Bonn, “Electron interactions and charge ordering in CuO2 compounds,” Eur. Phys. J. Special Topics 188, 131 (2010).
- Strach et al. (1998) T. Strach, J. Brunen, B. Lederle, J. Zegenhagen, and M. Cardona, “Determination of the phase difference between the Raman tensor elements of the -like phonons in ,” Phys. Rev. B 57, 1292–1297 (1998).
- Ambrosch-Draxl et al. (2002) C. Ambrosch-Draxl, H. Auer, R. Kouba, E. Ya. Sherman, P. Knoll, and M. Mayer, “Raman scattering in A comprehensive theoretical study in comparison with experiments,” Phys. Rev. B 65, 064501 (2002).
- Skornyakov et al. (2009) S. L. Skornyakov, A. V. Efremov, N. A. Skorikov, M. A. Korotin, Yu. A. Izyumov, V. I. Anisimov, A. V. Kozhevnikov, and D. Vollhardt, “Classification of the electronic correlation strength in the iron pnictides: The case of the parent compound ,” Phys. Rev. B 80, 092501 (2009).
- Yao et al. (2011) Y. X. Yao, J. Schmalian, C. Z. Wang, K. M. Ho, and G. Kotliar, “Comparative study of the electronic and magnetic properties of BaFe2As2 and BaMn2As2 using the Gutzwiller approximation,” Phys. Rev. B 84, 245112 (2011).
- Ferber et al. (2012) Johannes Ferber, Kateryna Foyevtsova, Roser Valentí, and Harald O. Jeschke, “LDADMFT study of the effects of correlation in LiFeAs,” Phys. Rev. B 85, 094505 (2012).
- Backes et al. (2015) Steffen Backes, Harald O. Jeschke, and Roser Valentí, “Microscopic nature of correlations in multiorbital : Hund’s coupling versus Coulomb repulsion,” Phys. Rev. B 92, 195128 (2015).