Calculated optical properties of Co in ZnO: internal and ionization transitions
Abstract
Previous luminescence and absorption experiments in Co-doped ZnO revealed two ionization and one intrashell transition of electrons. Those optical properties are analyzed within the generalized gradient approximation to the density functional theory. The two ionization channels involve electron excitations from the two gap states, the triplet and the doublet, to the conduction band. The third possible ionization channel, in which an electron is excited from the valence band to the level, requires energy in excess of 4 eV, and cannot lead to absorption below the ZnO band gap, contrary to earlier suggestions. We also consider two recombination channels, the direct recombination and a two-step process, in which a photoelectron is captured by and then recombines via the internal transition. Finally, the observed increase the band gap with the Co concentration is well reproduced by theory.
The accurate description of ZnO:Co is achieved after including corrections to the relevant orbitals of Zn, O, and Co. The value was calculated by the linear response approach, and independently was obtained by fitting the calculated transition energies to the optical data. The respective values, 3.4 and 3.0 eV, agree well. Ionization of Co induces large energy shifts of the gap levels, driven by the varying Coulomb coupling between the electrons, and by large lattice relaxations around Co ions. In turn, over eV changes of levels induced by the internal transition are mainly caused by the occupation-dependent corrections.
I Introduction
ZnO doped with Co is studied since five decades. The detailed experimental investigations conducted by Koidl Koidl showed that Co in ZnO substitutes for Zn and acquires the () electronic configuration with spin 3/2. Information about the Co-induced levels was provided by optical measurements. Both internal and ionization transitions were observed. The intrashell line at about 2.0 eV originates in the (i.e., ) transition, and typical is fine split Koidl ; Tuan2004 ; KIM2004 ; Pacuski:PRB2006 ; Singh2008 ; Gilliland ; Schulz ; Jin ; Matsui2013 ; Guo2015 ; Xu2013 ; Lecuna2014 . The observed splittings, of the order of few tens of eV, are due to a combined effect of the crystal field and the weak spin-orbit coupling, and they are not always experimentally resolved. Next, there are two ionization transitions beginning just below the ZnO band gap Tuan2004 ; Gilliland ; Jin ; Guo2015 ; Kittilstved , which are also reflected in photoconductivity. Those sub-band gap optical transitions can lead to applications in photocatalysis and photovoltaics Kumar2015 ; Samadi2016 . The internal excitations of are utilized in efficient hydrogen production by photoelectrochemical water-splitting Jaramillo . The near UV-visible photodetectors are fabricated with Co-doped ZnO nanoparticles Salman2013 ; Jacob2017 .
Investigations of ZnO:Co were intensified by the discovery of ferromagnetism (FM) at room temperatures Tseng ; Lu2009 ; Ciatto ; LiLi2012 . Mechanism of magnetic coupling depends critically on the sample microscopic morphology Dietl ; Sawicki , and in particular on the presence of defects Tseng ; Lu2009 ; Ciatto ; LiLi2012 ; Qi2011 . While the origin of FM in ZnO:Co is out of the scope of this paper, it is obvious that the electronic structure of Co determines both its charge and spin states as a function of the Fermi energy, thus providing a necessary basis for understanding magnetic coupling between Co ions.
Accurate and efficient theoretical description of transition metal (TM) dopants by first principles methods remains a challenging problem. The underestimation of the single-particle band gap by the local density (LDA) and the generalized gradient (GGA) approximations in the density functional theory distorts the levels, accessible charge states, and ionization energies of TM ions in ZnO. This is the case of electronic structure of Co calculated in Refs spaldin ; walsh ; Gilliland2012 . An efficient procedure improving the LDA or GGA electronic structure of the host as well as the properties of TM dopants consists is adding the terms Cococcioni . Those terms can be treated as adjustable parameters, or can be calculated self-consistently Cococcioni , but they should be applied to all orbitals relevant for the problem. For example, in the case of the LDA and GGA calculations in which only the states of Zn ions are corrected Gopal ; Chanier ; Iusan ; sarsari ; Gluba , the band gap problem persists, and the predicted Co levels are not reliable. Two correction schemes giving a correct band gap of ZnO are the nonlocal external potential (NLEP) corrections Lany ; Raebiger and the self-interaction-corrections (SIC) Toyoda ; pemmaraju . The correct of ZnO is also obtained with hybrid functionals (HY) walsh ; sarsari ; patterson ; Badaeva2008 . Linear response time-dependent density functional theory provides excited state energies, and it was recently applied to ZnO:Co Badaeva2009 ; may . However, the computational cost of those methods is much higher than that of LDA+ and GGA+. The relatively low cost of methods is important in the context of high-throughput computations aimed at, e.g., optimization of selected material properties for applications.
| Ref. | method | comments | ||||
| spaldin | LDA | VBM | 1.0 | 2.2 | ||
| walsh | GGA | 0.8 | VBM | 0.8 | 2.0 | |
| Gilliland2012 | GGA | 1.2 | 0.3 | 1.3 | 3.0 | |
| Gopal | LDA | 0.8 | VBM | 1.0 | 4.0 | , eV |
| Iusan | LDA | 2.0 | VBM | 0.1 | 4.0 | eV, eV |
| sarsari | GGA | 1.6 | VBM | 1.2 | 3.3 | eV, eV |
| Lany | GGA | 3.3 | VBM | 0.8 | 4.5 | eV, eV |
| Toyoda | SIC | 3.0 | VBM | 1.0 | 3.5 | |
| pemmaraju | SIC | 3.0 | 0.5 | 1.0 | 4.0 | |
| patterson | HY | 3.3 | VBM | 0.8 | 6.0 | |
| Badaeva2008 | HY | 4.5 | VBM | 0.5 | 6.0 | results for quantum dot |
| walsh | HY | 3.4 | VBM | 1.5 | 5.0 | |
| sarsari | HY+GW0 | 3.3 | VBM | 0.8 | 7.1 | |
| present | LDA | 3.3 | 0.3 | 1.3 | 5.0 | eV, eV, eV |
| LDA | 3.3 | VBM | 0.9 | 5.2 | eV, eV, eV |
Table 1 summarizes the calculated values of of ZnO and the energies of the three gap levels. They are qualitatively similar, predicting the majority-spin levels close to the valence band maximum (VBM), the minority level in the lower half of the band gap, and the crystal field splitted level higher in energy. Quantitatively, however, the discrepancy between various methods exceeds 4 eV, which is only partially explained by the large band gap error of the LDA and GGA. Indeed, even the corrected approaches, such as SIC or LDA+, lead to differences larger by more than 1 eV.
Correctness of a theoretical approach is assessed by comparing the results of calculations to experiment. This issue was not discussed in the quoted works, except Refs Badaeva2008 ; Badaeva2009 ; may . In the case of ZnO:Co, experiment includes optical, transport, and magnetic measurements, and the corresponding observables are optical transition energies, thermal ionization energies, and magnetic moments and couplings. Importantly, energies of excited states cannot be inferred from the differences in one-electron energies because of the strong intrashell coupling of electrons, large lattice relaxations induced by the change of the Co charge state, and the presence of non-negligible (albeit small in ZnO) electron-hole coupling. A striking example is that of the internal excitation: its experimental energy is 2.0 eV, while the - energy difference obtained with hybrid functionals is more than twice higher, see Table 1. This feature is also important when analyzing ionization (charge transfer) transitions, since the Co levels are sensitive to its charge state, and thus the calculations should be extended to charged Co. This was performed in Refs Gluba ; Raebiger which calculated the transition levels.
The aim of this paper is to provide a theoretical interpretation of the measured optical properties of ZnO:Co. To this end, we focus on the relevant transition energies rather than one electron levels. We also consider the change of the band gap of ZnO induced by Co. The paper is organized as follows. In Section II, we present the method of calculations, including the calculations of the term. The results of the electronic structure and optical transitions of ZnO:Co are shown in Section III.1 and III.2. The comparison of calculated results with experiment and their interpretation, given in Section III.3, allow to find the optimal value of . Section IV summarizes the obtained results.
II Calculation details
The calculations are performed within the density functional theory in the GGA approximation of the exchange-correlation potential Hohenberg ; KohnSham ; PBE , supplemented by the corrections Cococcioni ; Anisimov1991 ; Anisimov1993 . We use the pseudopotential method implemented in the Quantum ESPRESSO code QE , with the valence atomic configuration for Zn, for O and for Co. The plane-waves kinetic energy cutoffs of 30 Ry for wavefunctions and 180 Ry for charge density are employed. Spin-orbit coupling is neglected.
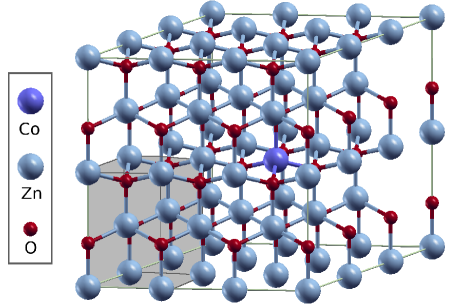
The electronic structure of the wurtzite ZnO is examined with a -point grid. Analysis of the Co impurity is performed using supercells with 72 atoms shown in Fig. 1, and the -space summations performed with a -point grid. Larger supercells ( with 144 atoms) and smaller supercells ( with 32 atoms and with 16 atoms) are employed to obtain the dependence of the energy gap on the Co concentration. The ionic positions of ZnO:Co are optimized until the forces acting on ions became smaller than 0.02 eV/Å. The calculated lattice constants of ZnO, Å and Å, as well as internal parameter , are underestimated by less than 1 % in comparison with experimental values Karzel ; Ozgur . The calculated average Co-O bond lengths for are 1.99 Å, close to those of Zn-O, 1.97 Å.
The underestimation of the band gap of ZnO is corrected by applying the term to and electrons. We find that the corrections eV and eV reproduce not only the experimental ZnO gap of 3.3 eV Dong ; Izaki ; Srikant , but also the width of 6 eV of the upper valence band of mostly character, and the energy of the band, centered about 8 eV below the VBM Lim . Those values of the terms were tested by us for ZnO:Mn and ZnO:Fe Mn ; Fe . directly opens the gap since the VBM is mainly derived from the orbitals, while changes the position of the -derived band well below the VBM. In previous works Ma ; Calzolari , eV and eV were proposed, while in Ref. Agapito eV and eV were calculated by using pseudohybrid Hubbard density functional method. This consistency between the results of various approaches provides a complementary justification for our values. Finally, we mention that by the band gap we understand the single-particle band gap, which is equal to the energy difference between the Kohn-Sham energies of the conduction band minimum (CBM) and the VBM. As it was discussed in Ref. Lany2008 , this also corresponds to the quasiparticle band gap. Inclusion of excitonic effects would be necessary in a detailed study of the optical response of ZnO, but this problem is outside the scope of this work.
The calculated total energies for all the considered charge states are used to obtain the transition levels between various charge states of Co. In the case of charged supercells, the image charge corrections and potential alignment are included in the calculations according to Lany2008 ; Lany2009 .
The value of the correction for is obtained in two ways. First, it is considered as a free parameter varying from 0 to 6 eV. The best agreement with the experimental optical transition energies is obtained for eV. Second, we also compute by linear response approach proposed in Ref. Cococcioni . We add small potential shifts that act only on the localized orbitals of Co through a projection operator, , and calculate variation of the Co occupations. The obtained (interacting and noninteracting) density response functions of the system with respect to these perturbations are used to compute the term. In the above procedure, we use a supercell with 72 atoms and then extrapolate the results to larger supercell with over 300 Co ions. We obtain eV, which is a little higher than the value fitted to experiment. Importantly, the constrained calculations with fixed initial occupations of orbitals are needed, because final total energies depend on the initial fixed on-site occupation matrices. Therefore, we test all possible occupations of Co orbitals with integer occupation numbers 0 and 1 to find the state with minimum energy for a given charge state .
To find energies of optical transitions of Co in ZnO two approaches are used. The ionization energy for the transition is obtained from the energy of level relative to the CBM, while that for is obtained from the energy of relative to the VBM. A second approach is used to find energies of the excited configurations (obtained after e.g. the internal transition from to the excited ( state). In this case, the occupations of the Kohn-Sham levels are fixed, and the Brillouin zone summations are approximated by the point values QE . Moreover, supercells remain electrically neutral even when the ionized is analyzed because of the presence of the excited electron in the conduction band. In consequence, the electric fields generated by are largely screened, their impact on both excitation energies and the Co gap levels Komsa is expected to be small, and total energies need not to be corrected for the spurious defect-defect coupling. These two approaches give ionization energies that agree to within less than 0.1 eV.
III Results
III.1 Co levels in ZnO
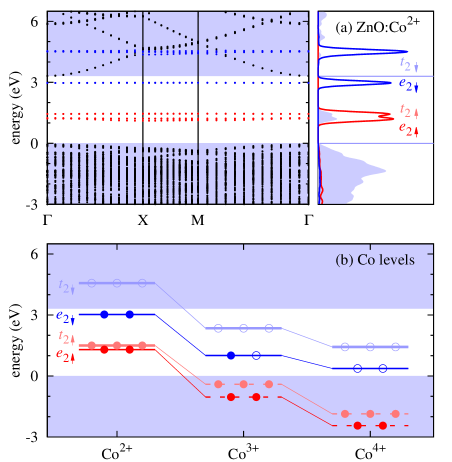
Figure 2(a) shows the band structure and the density of states (DOS) of ZnO doped with for . introduces three levels in the gap: close-lying doublet and triplet at about 1.5 eV above the VBM, and the doublet at 3.2 eV. The empty triplet is degenerate with the conduction band. Actually, both and triplets are weakly split by about 0.1 eV by the wurtzite crystal field, but we omit this effect for the sake of clarity. The strong dependence of the Kohn-Sham levels of Co on the charge state is clearly visible in Fig. 2(b). The levels of with seven electrons are 1-2 eV higher in energy than those of with 6 electrons, because the intrashell Coulomb repulsion increases with the increasing -shell occupation Mn ; Fe ; OptMat . In particular, the spin-up states of are below the VBM, while both spin-down levels are in the gap: at 1.1 eV and at 2.4 eV above the VBM. The second ionization to farther decreases the Co levels.
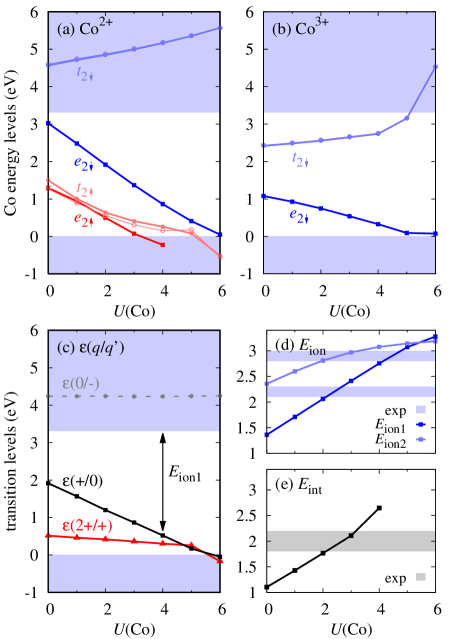
The dependence of and levels on is presented in Fig. 3(a) and 3(b), respectively. The -induced contribution to the Kohn-Sham potential is Cococcioni
| (1) |
where are the localized orbitals occupied by electrons, and are the Kohn-Sham states for the wavevector , band , and spin . The potential only acts on the contribution of the th (Co) orbital to the given state, and this contribution is evaluated by the appropriate projection according to Eq. 1. Equation 1 also shows that there is a negative shift of the fully occupied , and levels of , while the shift is positive for empty . For eV, the spin-up levels merge with the valence band. The energy levels of are not shown because this charge state is not stable and it will not be assumed by Co for realistic Fermi energies. Indeed, the of is at least 1 eV above the CBM, see Fig. 3(a). We note that the exact energy of relative to the CBM is of importance for the magnetic coupling between Co ions mediated by free carriers, see the discussion in Ref. sanvito-comm .
The calculated energy levels are compared with the previous calculations in Table 1. The LDA and GGA approximations lead to the underestimated and, in consequence, to the and levels degenerate with the conduction band spaldin ; walsh ; Gilliland2012 ; Gopal . The term shifts down all the occupied Co levels, and thus the is in the band gap Iusan ; sarsari , as in our case. However, ionization energies are too low since the gap is strongly underestimated even if is applied Iusan ; sarsari . On the other hand, our results obtained with eV are in a reasonable agreement with bandgap corrected methods employed in Refs walsh ; sarsari ; Lany ; Toyoda ; pemmaraju ; patterson ; Badaeva2008 , and in particular with the HY calculations.
The dependence of the Co levels on is reflected in the corresponding dependence of the thermodynamic transition levels shown in Fig. 3(c). The value of given in Fig. 3(c) is only estimated, since the electron of would autoionize to the CBM. In turn, the and levels are in the gap, indicating that , and are possible stable charge states of Co in ZnO. Transition levels eV and eV (i.e., 1.1 eV above the CBM) were obtained in Ref Gluba , and eV and eV (i.e., 0.9 eV above the CBM) in Ref Raebiger . Our results for eV are between those of Ref. Gluba and Ref. Raebiger . The transition level, which was not considered in Refs Gluba ; Raebiger , is practically degenerate with the VBM.
III.2 Optical transitions
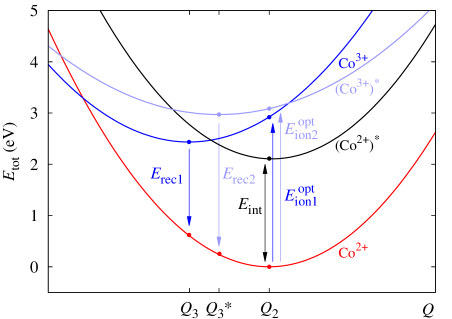
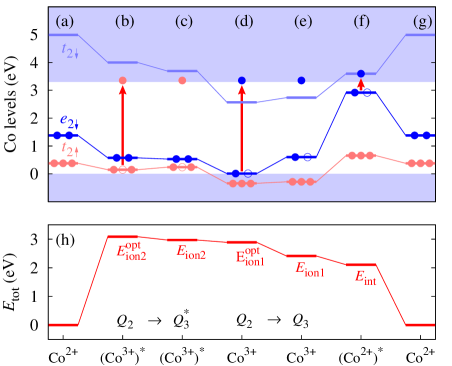
We consider four optical excitation processes, namely three ionization channels and the internal excitation, together with the corresponding recombination transitions. We also study the composition dependence of the . Figure 4 shows the configuration diagram, where the configuration coordinate should be regarded as the average Co-O bond length for a given electronic configuration of Co. The involved systems are , its excited state , as well as and its excited state. The corresponding equilibrium configuration coordinates are , , , and . eV is assumed.
1. The first ionization channel consists in the vertical optical ionization of with the energy , when an electron is transferred from the level to the CBM,
| (2) |
During calculations for this process, the occupation of the initial state is fixed to be , while that of the final state is , see also Fig. 5(a), Fig. 5(d-e), and Fig. 4. The calculated optical ionization energy of the vertical transition is 2.9 eV. After the excitation, the system can relax from the equilibrium configuration of toward that of , , which lowers the total energy by 0.5 eV. Thus, the onset of the absorption is predicted to occur at the zero phonon line energy 2.4 eV.
The change of the charge state causes the reduction of Co-O bonds by about 5 per cent, which is reflected in the difference between and in Fig. 4. The photoelectron recombines [] with the recombination energy . The energy of at equilibrium is 1.8 eV. After recombination, the system relaxes to releasing 0.6 eV.
Experimentally, luminescence energies are affected by the ratio of the radiative recombination rate to the lattice relaxation time of phonon emission. When the recombination is fast, the system does not relax to equilibrium, and the absorption and emission energies are almost equal to each other. In the opposite limit, long recombination times allow for the full relaxation of atomic configurations by phonon emission, which increases the difference between and , i.e., the Franck-Condon shift.
2. The second ionization channel consists in the ionization of via electron transfer from to the CBM:
| (3) |
The occupations in the excited state are , as indicated in Fig. 5(b-c). The corresponding ionization and recombination energies are and . Ionization of to produces a per cent shortening of Co-O bonds, which is smaller than in the case of . For this reason, the relaxation energy is smaller, about 0.1 eV, and the vertical and zero phonon absorption energies are similar, eV and eV, respectively. The Franck-Condon shift between absorption and emission lines is also smaller since the recombination energy at the configuration is eV.
3. The third possible ionization channel consists in the ionization of when an electron is transferred from the VBM to leaving a hole in the valence band, :
| (4) |
In that case, fixed occupations for ionized state are . As it was pointed out above and shown in Fig. 3(c), the transition level lies above the CBM, and thus the charge state is not stable. The photoionization energy is above 4 eV, higher than .
4. The internal excitation of ,
| (5) |
consists in the transfer of an electron from the doubly occupied to the empty level, thus is fixed for as shown in Fig. 5(f). The corresponding excitation energy is denoted by , and we find eV. In this case, , since the charge state of the dopant remains unchanged and the redistribution of electrons affects the bonds by less than 0.1%.
A further insight into those processes can be gained from Fig. 5, which shows the , and levels calculated for six cases: at equilibrium (panels (a) and (g)), the photoionized at the and configurations (panels (b) and (c)), the at and (panels (d) and (e)), and finally the state at (panel (f)). The excited states are ordered from the highest to the lowest total energies, which are given in panel (h). The dependence of the Kohn-Sham levels of Co on the charge state follows from two effects. The first and the dominant one is the reduced Coulomb intrashell repulsion characterizing the ionized and , which induces downward shift of gap levels relative to those of the neutral . The second effect is the upward shift of the energies of Co levels, which are induced by the decrease of Co-O bond lengths from to or , see also Ref. Mn . Both effects are stronger for , where the optical ionization decreases the position of Co levels by 1.5 eV, while the relaxation from to rises the Co levels by eV. The changes induced by the internal transition, shown in the panels (g)-(f), have a different origin. In this case, the energy shifts of and are comparable, and are caused mainly by the correction. They have opposite signs because, in agreement with Eq. 1, after the excitation from to , the occupation of increases by 1 and that of decreases by 1.
Considering recombination processes we see that after the internal excitation of , the occupied with one electron is about 0.25 eV above the CBM. This suggests that the excited can spontaneously ionize, releasing one electron to the CBM in the reaction [], i.e., a transition from (f) to (e) should spontaneously occur. However, the total energy of the latter state is 0.3 eV than the energy of , see Fig. 5(h), and therefore the ionization is possible, but it is a thermally activated process. Second, the results of Fig. 4 show that there are two possible channels of recombination for and . The first one is the one-step direct recombination with or , while the second channel is a two-step process, in which the electron capture on or is followed by the internal deexcitation.
The above results illustrate the fact that excitation energies cannot be estimated based on the single-electron energies. In particular, the calculated internal transition energy is 2.1 eV, while the energy difference between the levels is almost twice larger, 3.5 eV. Such a large discrepancy is expected to hold also for hybrid functionals calculations walsh ; sarsari ; patterson ; Badaeva2008 .
Comparing our results with the recent study in Ref. may using the linear response time dependent density functional theory, we note that their results for the excitation to and states were obtained for small quantum dots and extrapolated to bulk ZnO, nevertheless they agree with our values to within 0.2 eV.
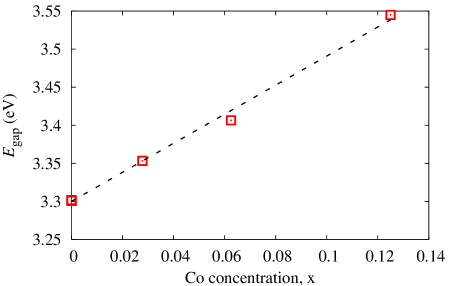
5. Finally, the observed optical properties of ZnO:Co include also fundamental excitation and recombination transitions with energy given by the band gap. As it is shown in Fig. 6, the calculated increases with the increasing Co concentration. The detailed analysis of those transitions must include formation of excitons (which binding energy in ZnO is 60 meV Reynolds ), but this issue is out of the scope of this work.
III.3 Comparison with experiment
The comparison of our results with the experimental data is satisfactory. The calculated dependencies of and on allow to find its optimal value. The results are shown in Fig. 3(d) and (e). A good agreement with experiment is obtained with eV. In particular:
(i) The observed increase of the band gap with the Co concentration is well reproduced, see Fig. 6. The calculated coefficient defined by the relation is 1.9 eV, which agrees well with the experimental values 1.1 KIM2004 , 1.7 Pacuski:PRB2006 , 2.3 Gamelin2011 and 2.5 eV Matsui2013 .
(ii) Our energy of the internal transition eV is close to the experimental eV, which is seen in both absorption and luminescence. The observed splitting of this line is partly due to the crystal field splitting of the level, and partly due to the spin-orbit coupling, which is neglected in our calculations footnote .
(iii) The optical ionization of is observed in a broad band which begins at about 2.2 eV, extends up to about 3 eV, and was monitored in photocurrent by Gamelin et al. Kittilstved ; Liu2005 ; Gamelin2010 ; Gamelin2011 . Their further analysis revealed that it originates in two transitions, the lower energy one assigned to [], and the higher energy transition interpreted as [].
According to our results, the ionization energy corresponding to the zero-phonon transition [] is about 2.4 eV, and the phonon-assisted transitions extend up to eV. Both values are higher by about 0.2 eV relative to experiment. This reasonable agreement confirms the assignment proposed in Refs Kittilstved ; Liu2005 ; Gamelin2010 ; Gamelin2011 . This 2.4-2.9 eV absorption band is shown in Fig. 7(a). Its width can also be inferred from Fig. 4.
On the other hand, the obtained results do not support the identification of the second ionization transition as [], in which an electron is excited from the VBM to level at energies above 2.7 eV Kittilstved ; Liu2005 ; Gamelin2010 ; Gamelin2011 . Indeed, our results show that this transition requires at least 4 eV, as it follows from the energy of the transition level relative to the VBM (see Fig. 3(c)). Instead, we propose that the observed higher absorption band originates in [] transition from the Co spin-up state with the ionization energy in the range 3.0-3.1 eV shown in Fig. 7(a).
In the absorption measurements, only one ionization channel is seen at energies just below the band gap Tuan2004 ; Pacuski:PRB2006 ; Gilliland ; Matsui2013 ; Guo2015 . Based on our results, we assign this transition to CBM, to [], because its energy fits the experiment. Moreover, the second possible transition, CBM, is expected to be forbidden.
(iv) According to our results, after the internal excitation can ionize releasing an electron to the CBM, and the corresponding activation energy is eV. The experiments of Refs Liu2005 ; Gamelin2010 ; Gamelin2011 revealed that indeed ionizes, because the internal transition results in photoconductivity. The observed ionization has a thermally activated character with energy of about 50 meV, which is somewhat smaller than the calculated value.
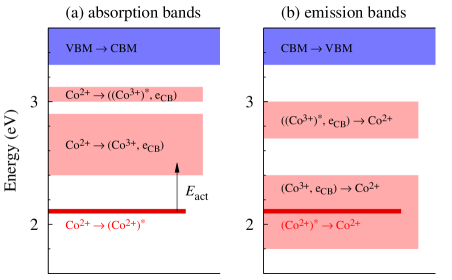
The calculated absorption and emission bands are summarized in Fig. 7. The lowest energy excitation at 2.1 eV is associated with the internal transition to excited . Next, the two sub-bands corresponding the ionization transitions from to and appear at 2.4-2.9 eV and at 3.0-3.1 eV. Each subband extends from the zero-phonon transition at energy (which includes atomic relaxations around Co) to the line at of the vertical transition (, without changes in atomic positions). At the highest energies, above 3.3 eV, the transitions occurs. The energy range of charge transfer and ZnO band-to-band transitions are expected to change with the Co concentration. In the emission bands, the transitions from and to occur at 1.8-2.4 eV and 2.7-3.0 eV, respectively. Here again, the finite width of subbands spans the energy window between the zero-phonon lines and the vertical transitions . (The widths of both absorption and emission bands can be inferred from Fig. 4, where the vertical transitions are shown by arrows.) Both transitions can be completely suppressed by the two step processes involving , which is probably observed in the luminescence Schulz ; Matsui2013 ; Xu2013 ; Lecuna2014 ; Lommens .
IV Conclusions
The results of the GGA calculations explain the available experimental properties of substitutional Co in ZnO. In particular, the calculated composition dependence of the ZnO:Co band gap agrees well with the experimental data KIM2004 ; Pacuski:PRB2006 ; Matsui2013 ; Gamelin2011 . While the n-doping of ZnO:Co does not change the charge state of Co, the p-doping will be compensated because Co can act as a double donor.
We considered four possible optical transitions involving . The first one is the internal transition, which calculated transition energy, 2.1 eV, corresponds well with the experimental value 2.0 eV. Next, there are two ionization transitions , in which an electron is transferred from one of the two gap states to the conduction band. The lower energy channel is related with the excitation from to CBM, with energies in the range 2.9-2.4 eV, in which the upper limit corresponds the zero phonon line. The higher energy channel is related with the transition with energies 3.1-3.0 eV, and leaving Co in the excited state . Both excitation channels occur in parallel, and extent from 3.1 eV to 2.4 eV. This agrees to within 0.2 eV with observations. The fourth possible ionization process consists in exciting an electron from the valence band to the Co state, []. This process was suggested in Refs Kittilstved ; Gamelin2010 ; Gamelin2011 . According to our results, the corresponding ionization energies are higher than 4 eV, which questions this interpretation.
We also point out that there are two recombination channels of photoelectrons, the direct recombination, and a two-step process in which the photoelectron is first captured by , and then recombines via the internal transition.
The excitation-recombination processes are strongly affected by the intrashell Coulomb coupling. Manifestation of the coupling is provided by the pronounced dependence of the Co levels on their occupations. The levels of ionized and are lower than those of due to the weaker intrashell Coulomb repulsion for an ion with smaller number of -electrons. Additionally, both charge transfer transitions involve large lattice relaxations, which also influence the dopant levels. On the other hand, in spite of the fact the internal transition does not change the charge state, the levels are shifted by about 1 eV. In this case, the effect has a different origin, namely the occupation-dependent corrections.
The theoretical level energies of Co depend on one parameter, . Its value is established in two ways. First, we treat as a fitting parameter. This allows us to reproduce the two measured ionization energies and the energy of the internal transition to within 0.1-0.2 eV with a single value eV. Moreover, the discussed dependence of transition energies on provides an additional insight into the impact of the corrections on the electronic structure of transition metal ions in semiconductors. In the second approach, the theoretical value eV is obtained by the linear response method of Ref. Cococcioni . It leads to somewhat less accurate energies of the optical transitions than the optimal fitted value 3.0 eV, but the agreement between the two methods is satisfactory. This farther confirms our identification of the observed transitions. Those results demonstrate that GGA+ is an alternative to the linear response time dependent density functional theory of Ref. may .
Acknowledgements
The authors acknowledge the support from the Project No. 2016/21/D/ST3/03385, which are financed by Polish National Science Centre. Calculations were performed on ICM supercomputers of University of Warsaw (Grant No. G46-13 and G16-11).
References
- (1) Koidl P 1977 Phys. Rev. B 15(5) 2493–2499
- (2) Tuan A C, Bryan J D, Pakhomov A B, Shutthanandan V, Thevuthasan S, McCready D E, Gaspar D, Engelhard M H, Rogers J W, Krishnan K, Gamelin D R and Chambers S A 2004 Phys. Rev. B 70(5) 054424
- (3) Kim J H, Kim H, Kim D, Yoon S G and Choo W K 2004 Solid State Commun. 131 677 – 680
- (4) Pacuski W, Ferrand D, Cibert J, Deparis C, Gaj J A, Kossacki P and Morhain C 2006 Phys. Rev. B 73(3) 035214
- (5) Singh S, Rama N, Sethupathi K and Rao M S R 2008 J. Appl. Phys. 103 07D108
- (6) Gilliland S G, Sans J A, Sánchez-Royo J F, Almonacid G and Segura A 2010 Appl. Phys. Lett. 96 241902
- (7) Schulz H J and Thiede M 1987 Phys. Rev. B 35(1) 18–34
- (8) Jin Z W, Fukumura T, Hasegawa K, Yoo Y Z, Ando K, Sekiguchi T, Ahmet P, Chikyow T, Hasegawa T, Koinuma H and Kawasaki M 2002 J. Cryst. Growth 237-239 548 – 552
- (9) Matsui H and Tabata H 2013 J. Appl. Phys. 113 183525
- (10) Guo S, Li J and Du Z 2015 Appl. Phys. A 121 645–649
- (11) Xu J, Shi S, Li L, Zhang X, Wang J, Shi Q, Li S and Wang H 2013 J. Electron. Mater. 42 3438
- (12) Renero-Lecuna C, MartĂn-RodrĂguez R, González J A, RodrĂguez F, Almonacid G, Segura A, Muñoz-SanjosĂ© V, Gamelin D R and Valiente R 2014 Chem. Mater. 26 1100–1107
- (13) Kittilstved K R, Liu W K and Gamelin D R 2006 Nat. Mater. 5 291 – 297
- (14) Kumar S G and Rao K S R K 2015 RSC Adv. 5(5) 3306–3351
- (15) Samadi M, Zirak M, Naseri A, Khorashadizade E and Moshfegh A Z 2016 Thin Solid Films 605 2 – 19
- (16) Jaramillo T F, Baeck S H, Kleiman-Shwarsctein A, Choi K S, Stucky G D and McFarland E W 2005 J. Comb. Chem. 7 264
- (17) Al-Salman H S and Abdullah M 2013 J. Mater. Sci. Technol. 29 1139 – 1145
- (18) Jacob A A, Balakrishnan L, Shambavi K and Alex Z C 2017 RSC Adv. 7(63) 39657–39665
- (19) Tseng L T, Suter A, Wang Y R, Xiang F X, Bian P, Ding X, Tseng A, Hu H L, Fan H M, Zheng R K, Wang X L, Salman Z, Prokscha T, Suzuki K, Liu R, Li S, Morenzoni E and Yi J B 2017 Phys. Rev. B 96(10) 104423
- (20) Lu Z L, Hsu H S, Tzeng Y H, Zhang F M, Du Y W and Huang J C A 2009 Appl. Phys. Lett. 95 102501
- (21) Ciatto G, Di Trolio A, Fonda E, Alippi P, Testa A M and Bonapasta A A 2011 Phys. Rev. Lett. 107(12) 127206
- (22) Li L, Guo Y, Cui X Y, Zheng R, Ohtani K, Kong C, Ceguerra A V, Moody M P, Ye J D, Tan H H, Jagadish C, Liu H, Stampfl C, Ohno H, Ringer S P and Matsukura F 2012 Phys. Rev. B 85(17) 174430
- (23) Dietl T, Andrearczyk T, Lipińska A, Kiecana M, Tay M and Wu Y 2007 Phys. Rev. B 76(15) 155312
- (24) Sawicki M, Guziewicz E, Łukasiewicz M I, Proselkov O, Kowalik I A, Lisowski W, Dluzewski P, Wittlin A, Jaworski M, Wolska A, Paszkowicz W, Jakiela R, Witkowski B S, Wachnicki L, Klepka M T, Luque F J, Arvanitis D, Sobczak J W, Krawczyk M, Jablonski A, Stefanowicz W, Sztenkiel D, Godlewski M and Dietl T 2013 Phys. Rev. B 88(8) 085204
- (25) Qi S, Jiang F, Fan J, Wu H, Zhang S B, Gehring G A, Zhang Z and Xu X 2011 Phys. Rev. B 84(20) 205204
- (26) Spaldin N A 2004 Phys. Rev. B 69(12) 125201
- (27) Walsh A, Da Silva J L F and Wei S H 2008 Phys. Rev. Lett. 100(25) 256401
- (28) Gilliland S J, Sans J A, Sánchez-Royo J F, Almonacid G, García-Domene B, Segura A, Tobias G and Canadell E 2012 Phys. Rev. B 86(15) 155203
- (29) Cococcioni M and de Gironcoli S 2005 Phys. Rev. B 71(3) 035105
- (30) Gopal P and Spaldin N A 2006 Phys. Rev. B 74(9) 094418
- (31) Chanier T, Virot F and Hayn R 2009 Phys. Rev. B 79(20) 205204
- (32) Iuşan D, Knut R, Sanyal B, Karis O, Eriksson O, Coleman V A, Westin G, Wikberg J M and Svedlindh P 2008 Phys. Rev. B 78(8) 085319
- (33) Sarsari I A, Pemmaraju C D, Salamati H and Sanvito S 2013 Phys. Rev. B 87(24) 245118
- (34) Gluba M A and Nickel N H 2013 Phys. Rev. B 87(8) 085204
- (35) Lany S, Raebiger H and Zunger A 2008 Phys. Rev. B 77(24) 241201
- (36) Raebiger H, Lany S and Zunger A 2009 Phys. Rev. B 79(16) 165202
- (37) Toyoda M, Akai H, Sato K and Katayama-Yoshida H 2006 Physica B: Condens. Matter 376-377 647 – 650
- (38) Pemmaraju C D, Hanafin R, Archer T, Braun H B and Sanvito S 2008 Phys. Rev. B 78(5) 054428
- (39) Patterson C H 2006 Phys. Rev. B 74(14) 144432
- (40) Badaeva E, Feng Y, Gamelin D R and Li X 2008 New J. Phys. 10 055013
- (41) Badaeva E, Isborn C M, Feng Y, Ochsenbein S T, Gamelin D R and Li X 2009 J. Phys. Chem. C 113(20) 8710–8717
- (42) May J W, Ma J, Badaeva E and Li X 2014 J. Phys. Chem. C 118 13152–13156
- (43) Hohenberg P and Kohn W 1964 Phys. Rev. 136(3B) B864–B871
- (44) Kohn W and Sham L J 1965 Phys. Rev. 140(4A) A1133–A1138
- (45) Perdew J P, Burke K and Ernzerhof M 1996 Phys. Rev. Lett. 77(18) 3865–3868
- (46) Anisimov V I, Zaanen J and Andersen O K 1991 Phys. Rev. B 44(3) 943–954
- (47) Anisimov V I, Solovyev I V, Korotin M A, Czyżyk M T and Sawatzky G A 1993 Phys. Rev. B 48(23) 16929–16934
- (48) Quantum ESPRESSO, www.quantum-espresso.org
- (49) Karzel H, Potzel W, Köfferlein M, Schiessl W, Steiner M, Hiller U, Kalvius G M, Mitchell D W, Das T P, Blaha P, Schwarz K and Pasternak M P 1996 Phys. Rev. B 53(17) 11425–11438
- (50) Özgür U, Alivov Y I, Liu C, Teke A, Reshchikov M A, Doğan S, Avrutin V, Cho S J and Morkoc H 2005 J. Appl. Phys. 98 041301
- (51) Dong C L, Persson C, Vayssieres L, Augustsson A, Schmitt T, Mattesini M, Ahuja R, Chang C L and Guo J H 2004 Phys. Rev. B 70(19) 195325
- (52) Izaki M and Omi T 1996 Appl. Phys. Lett. 68 2439–2440
- (53) Srikant V and Clarke D R 1998 J. Appl. Phys. 83 5447–5451
- (54) Lim L Y, Lany S, Chang Y J, Rotenberg E, Zunger A and Toney M F 2012 Phys. Rev. B 86(23) 235113
- (55) Ciechan A, Przybylińska H, Bogusławski P, Suchocki A, Grochot A, Mycielski A, Skupiński P and Grasza K 2016 Phys. Rev. B 94(16) 165143
- (56) Papierska J, Ciechan A, Bogusławski P, Boshta M, Gomaa M M, Chikoidze E, Dumont Y, Drabińska A, Przybylińska H, Gardias A, Szczytko J, Twardowski A, Tokarczyk M, Kowalski G, Witkowski B, Sawicki K, Pacuski W, Nawrocki M and Suffczyński J 2016 Phys. Rev. B 94(22) 224414
- (57) Ma X, Wu Y, Lv Y and Y Z 2013 J. Phys. Chem. C 117 26029–26039
- (58) Calzolari A, Ruini A and Catellani A 2011 J. Am. Chem. Soc. 133 5893–5899
- (59) Agapito L A, Curtarolo S and Buongiorno Nardelli M 2015 Phys. Rev. X 5(1) 011006
- (60) Lany S and Zunger A 2008 Phys. Rev. B 78(23) 235104
- (61) Lany S and Zunger A 2009 Model. Simul. Mater. Sci. Eng. 17 084002
- (62) Komsa H P, Rantala T T and Pasquarello A 2012 Phys. Rev. B 86(4) 045112
- (63) Ciechan A and Bogusławski P 2018 Optical Materials 79 264 – 268
- (64) Liu W K, Salley G M and Gamelin D R 2005 J. Phys. Chem. B 109 14486–14495
- (65) Johnson C A, Kaspar T C, Chambers S A, Salley G M and Gamelin D R 2010 Phys. Rev. B 81(12) 125206
- (66) Johnson C A, Cohn A, Kaspar T, Chambers S A, Salley G M and Gamelin D R 2011 Phys. Rev. B 84(12) 125203
- (67) Sanvito S and Pemmaraju C D 2009 Phys. Rev. Lett. 102(15) 159701
- (68) Reynolds D C, Look D C, Jogai B, Litton C W, Cantwell G and Harsch W C 1999 Phys. Rev. B 60(4) 2340–2344
- (69) More precisely, the multiple splitting of this line is not always resolved. Experimentally, the 2.0 eV line is split into two (1.88 and 1.92 eV Koidl , 2.02 and 2.18 eV Singh2008 ), three (1.88, 2.01, and 2.19 eV KIM2004 , 1.89, 2.04 and 2.19 eV Lecuna2014 , 1.9, 2.0 and 2.2 eV Xu2013 ), or even four peaks (1.89, 1.95, 2.06 and 2.19 eV Matsui2013 , 1.91, 1.98, 2.09, and 2.18 eV Jin ).
- (70) Lommens P, Smet P F, de Mello Donega C, Meijerink A, Piraux L, Michotte S, Mátéfi-Tempfli S, Poelman D and Hens Z 2006 J. Lumin. 118 245 – 250