Electronic schematic for bio-plausible dopamine neuromodulation of eSTDP and iSTDP
Abstract
In this technical report we present novel results of the dopamine bio-plausible neuromodulation excitatory (eSTDP) and inhibitory (iSTDP) learning. We present the principal schematic for the neuromodulation of D1 and D2 receptors of dopamine, wiring schematic for both cases as well as the simulatory experiments results done in LTSpice.
keywords:
neuromodulation, dopamine, neuromorphic computing, affective computing, simulation1 The experimental set-up
In our previous technical report we presented the electronic schematic to generate complex learning impulses for memristive devices to implement iSTDP and eSTDP learning functions (Talanov et al.,, 2017). We have also presented the physical implementations and experimental results for dopamine modulation implemented as an amplification of learning impulses. Based on works of Hennequin et al., (2017); Vogels et al., (2013); Gurney et al., (2015) we have extended our previous model with electronic schematic for bio-plausible neuromodulation for D1 and D2 dopamine receptors presented in the Fig. 1 (left graphs).
1.1 Block diagram

We have decided to use mixture of two functions that represents extreme positions in the dopamine modulation STDP “Sombrero” and Hebbian indicated as and triangles in Fig. 1. Input signals of “Sombrero” and Hebbian learning functions are balanced via dopamine level represented as green triangle in Fig. 1. The dopamine level setts up gain for each input ”Sombrero” - and Hebbian - respectively in corresponding amplifier indicated as and . The output of amplifiers is processed by the that implements the mixture of two modulated via dopamine input learning functions. Two cases of the dopamine modulation is represented as two panels in the Fig. 1 with the main difference in initial learning function for the low level of the dopamine: for D1 inverted – “Sombrero” and for D2 – “Sombrero”. Thus the that implements the inverted “Sombrero” for the low level of the dopamine is included in the block diagram for the D1 schematic.
1.2 Wiring schematic
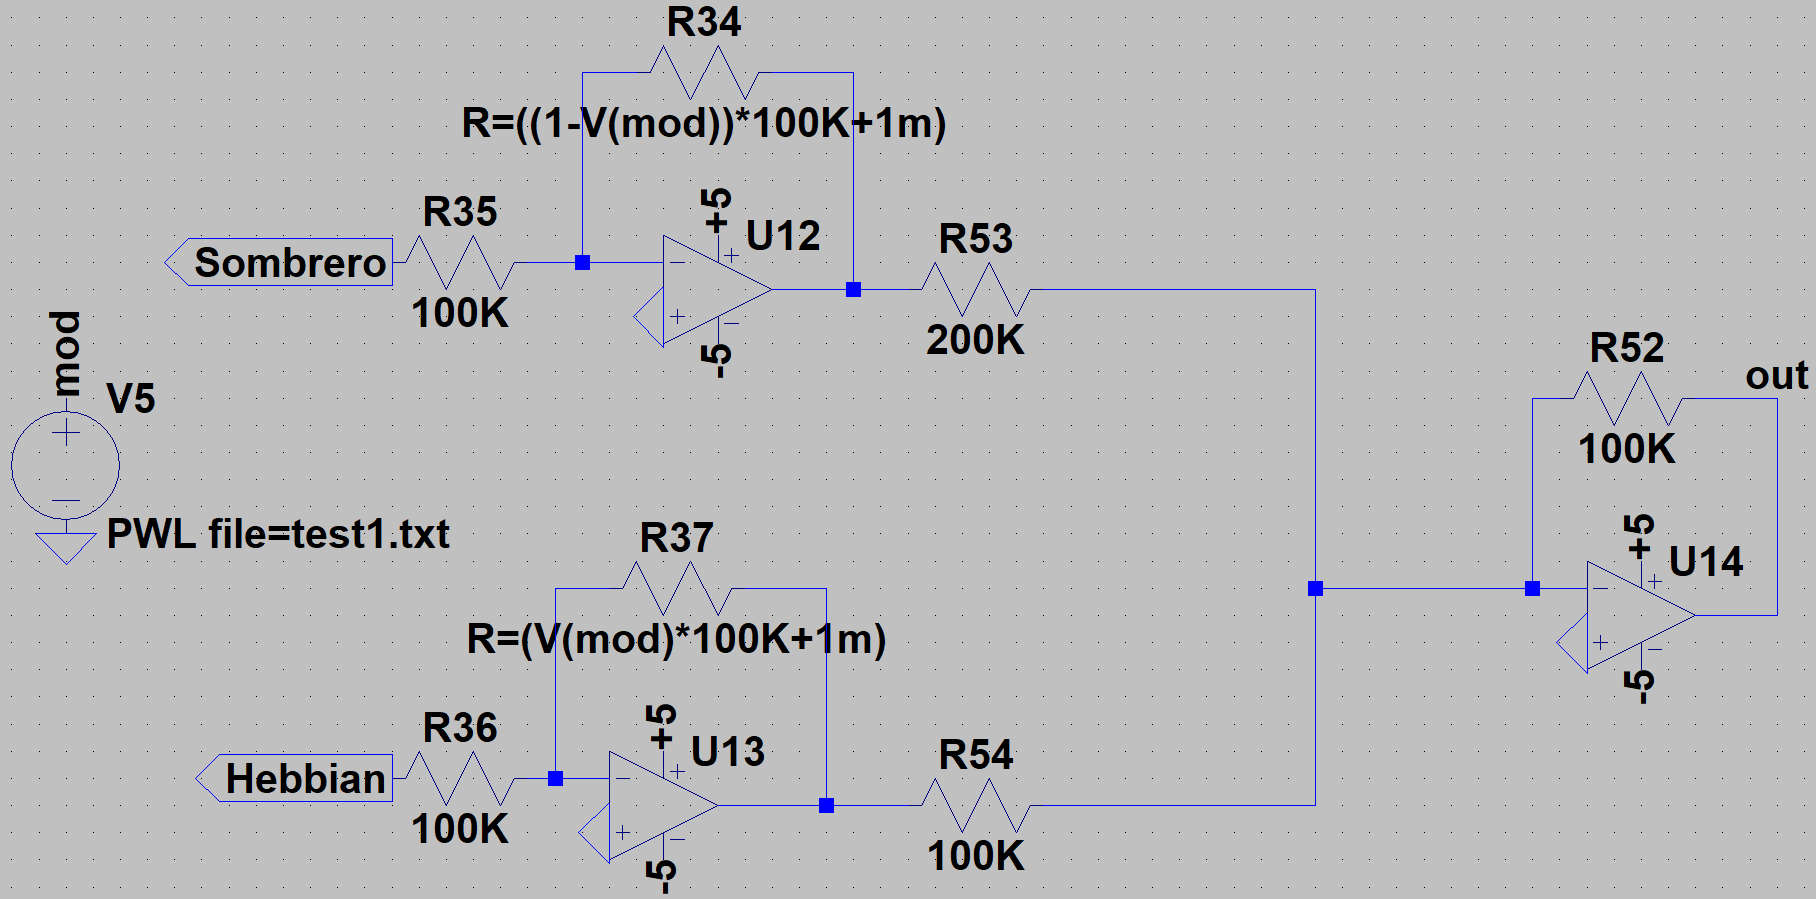
The wiring schematic of the dopamine modulation via receptor D1 is depicted in Fig. 2. The op-amp plays the role of inverter for the “Sombrero” input signals to implement the extreme state of the learning function for D1 receptor the inverted “Sombrero” (see Fig.1). Two op-amps and are oppositely balanced amplifiers via resistances and . The value of the is set via digital potentiometer:
| (1) |
The value of the is set via digital potentiometer opposed to :
| (2) |
When , according to eq.1, , which makes gain almost equal zero. At the same time, from eq. 2 , combined with makes gain equals to one. If gains are opposite. The outbound signal of both amplifiers and is processed by the weighted adder implemented via . The “Sombrero” amplitude is twice lower than Hebbian, to match global amplitude change in process of dopamine modulation.
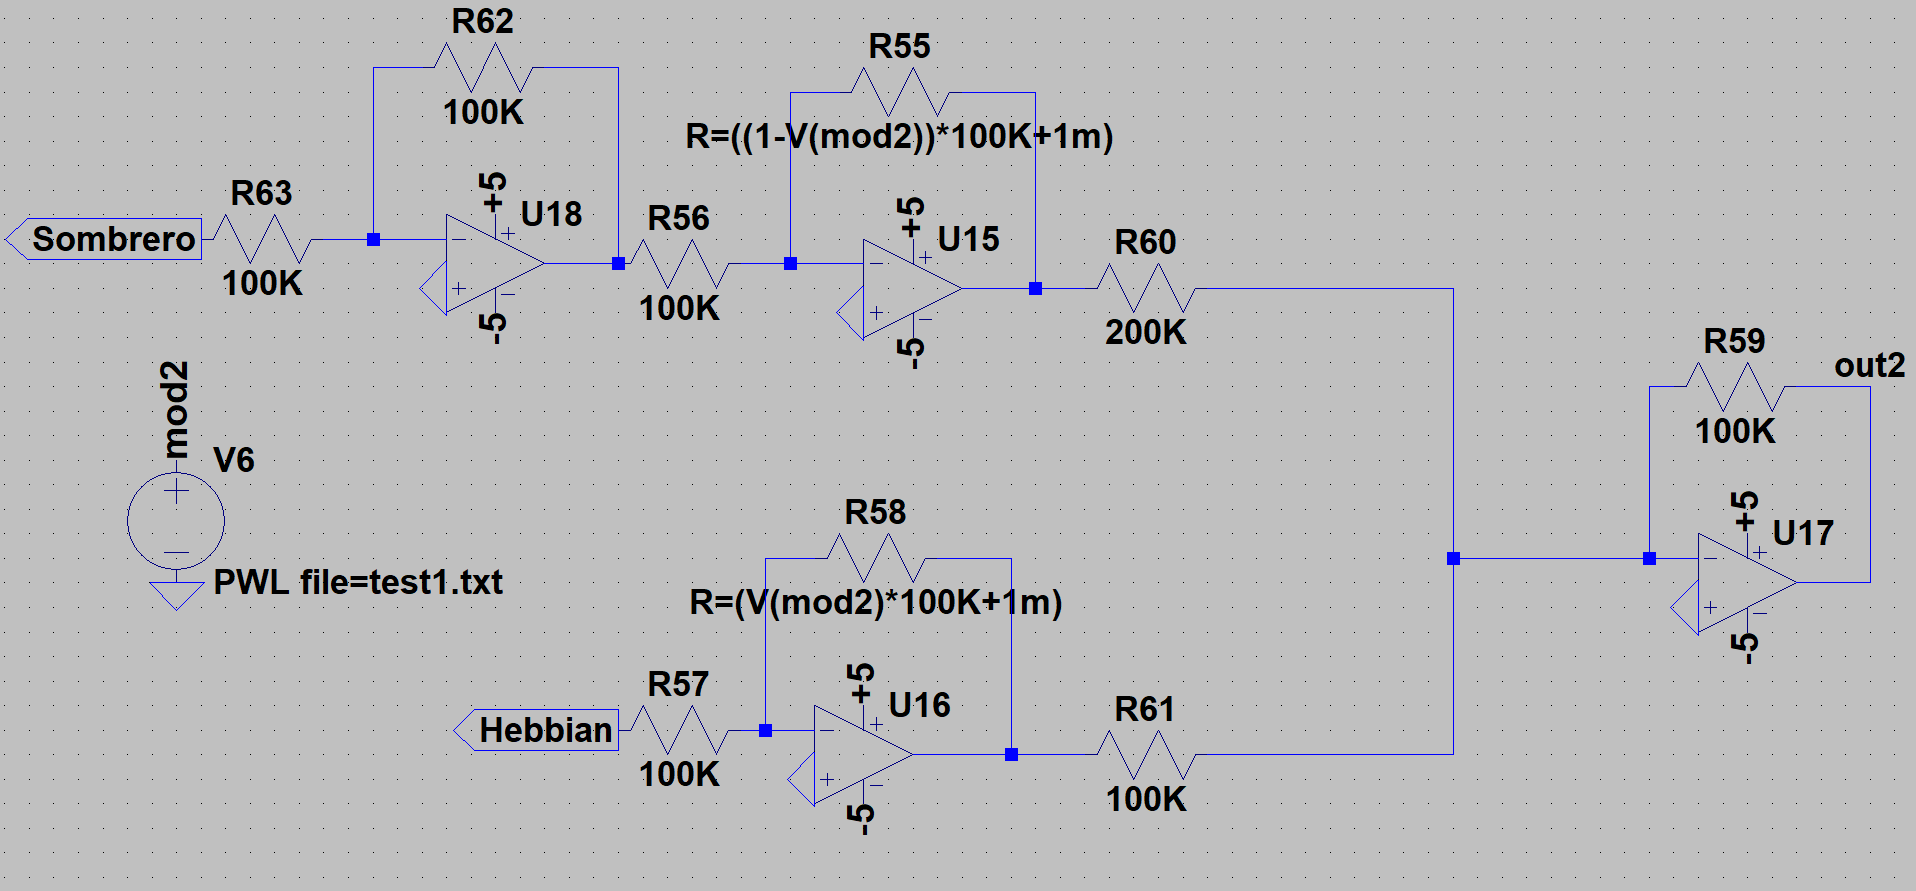
The modulation schematic for D2 receptor is done in similar way except for the inverter of the “Sombrero” input signals that in case of D2 receptor is not used. The neuromodulatory schematic is represented in Fig. 3.
1.3 Results
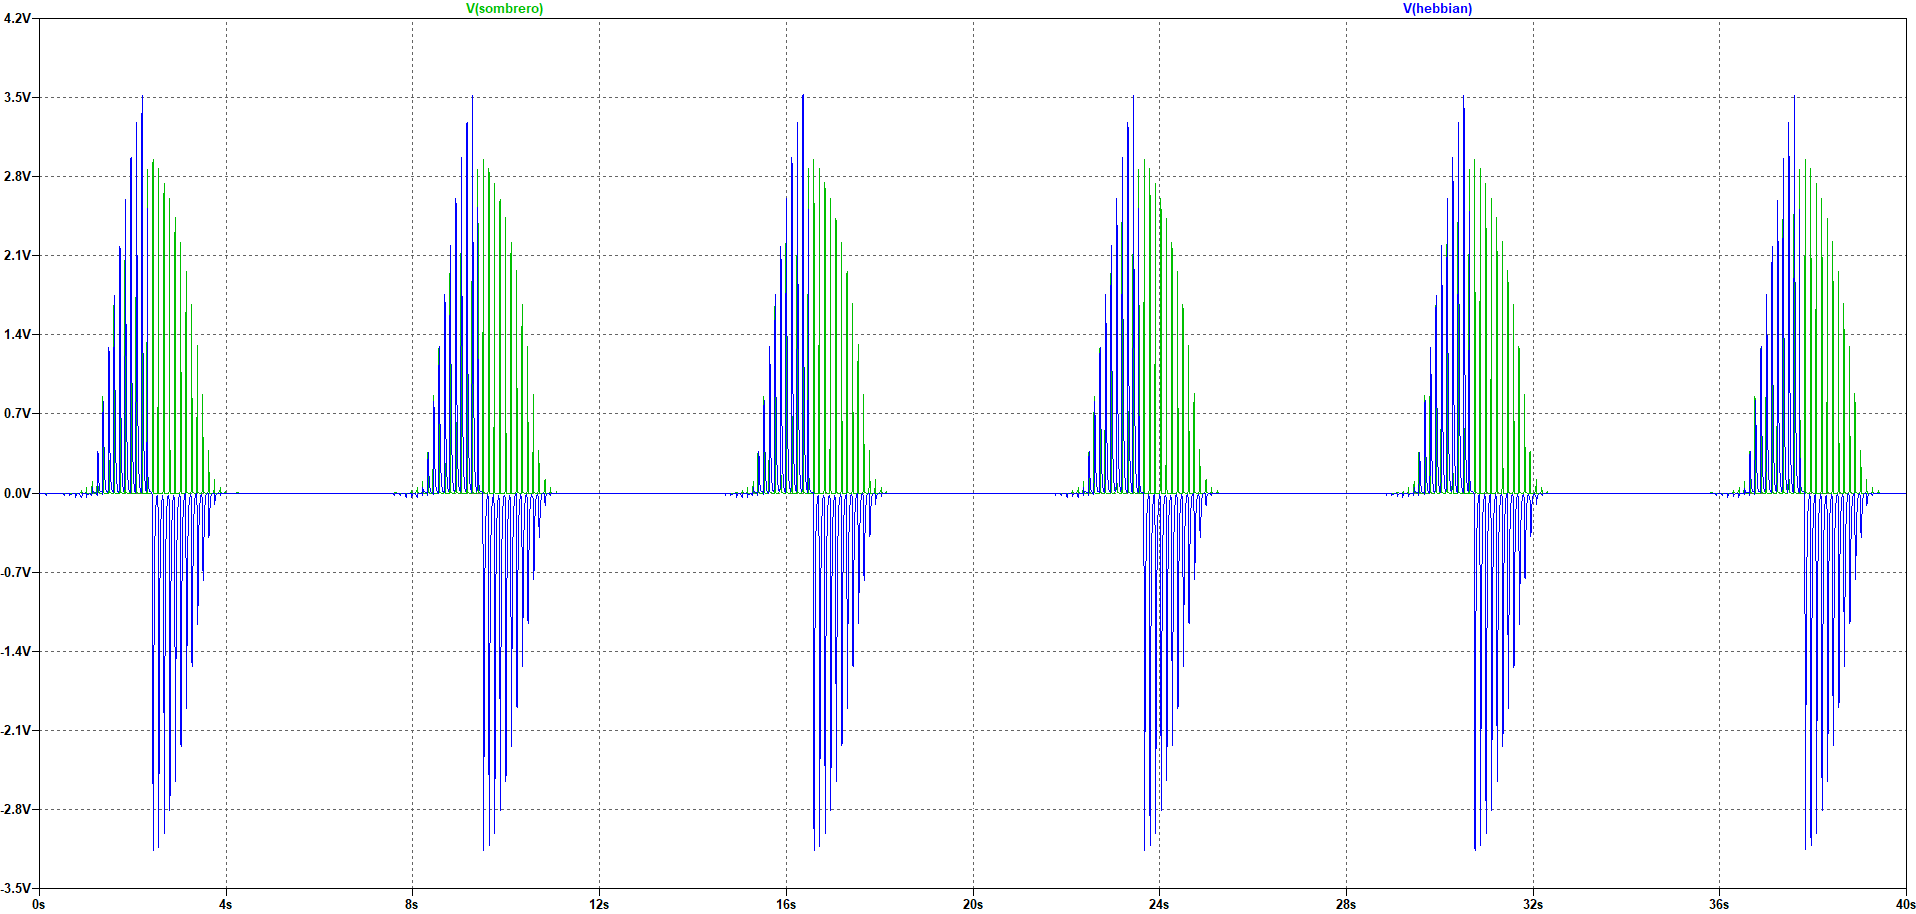
For the simulatory validation we have used LTSpice software framework. Inbound signals are presented in Fig. 4 where green graph is the “Sombrero” signals and blue is the Hebbian signals for both the D1 and D2 dopamine receptors.
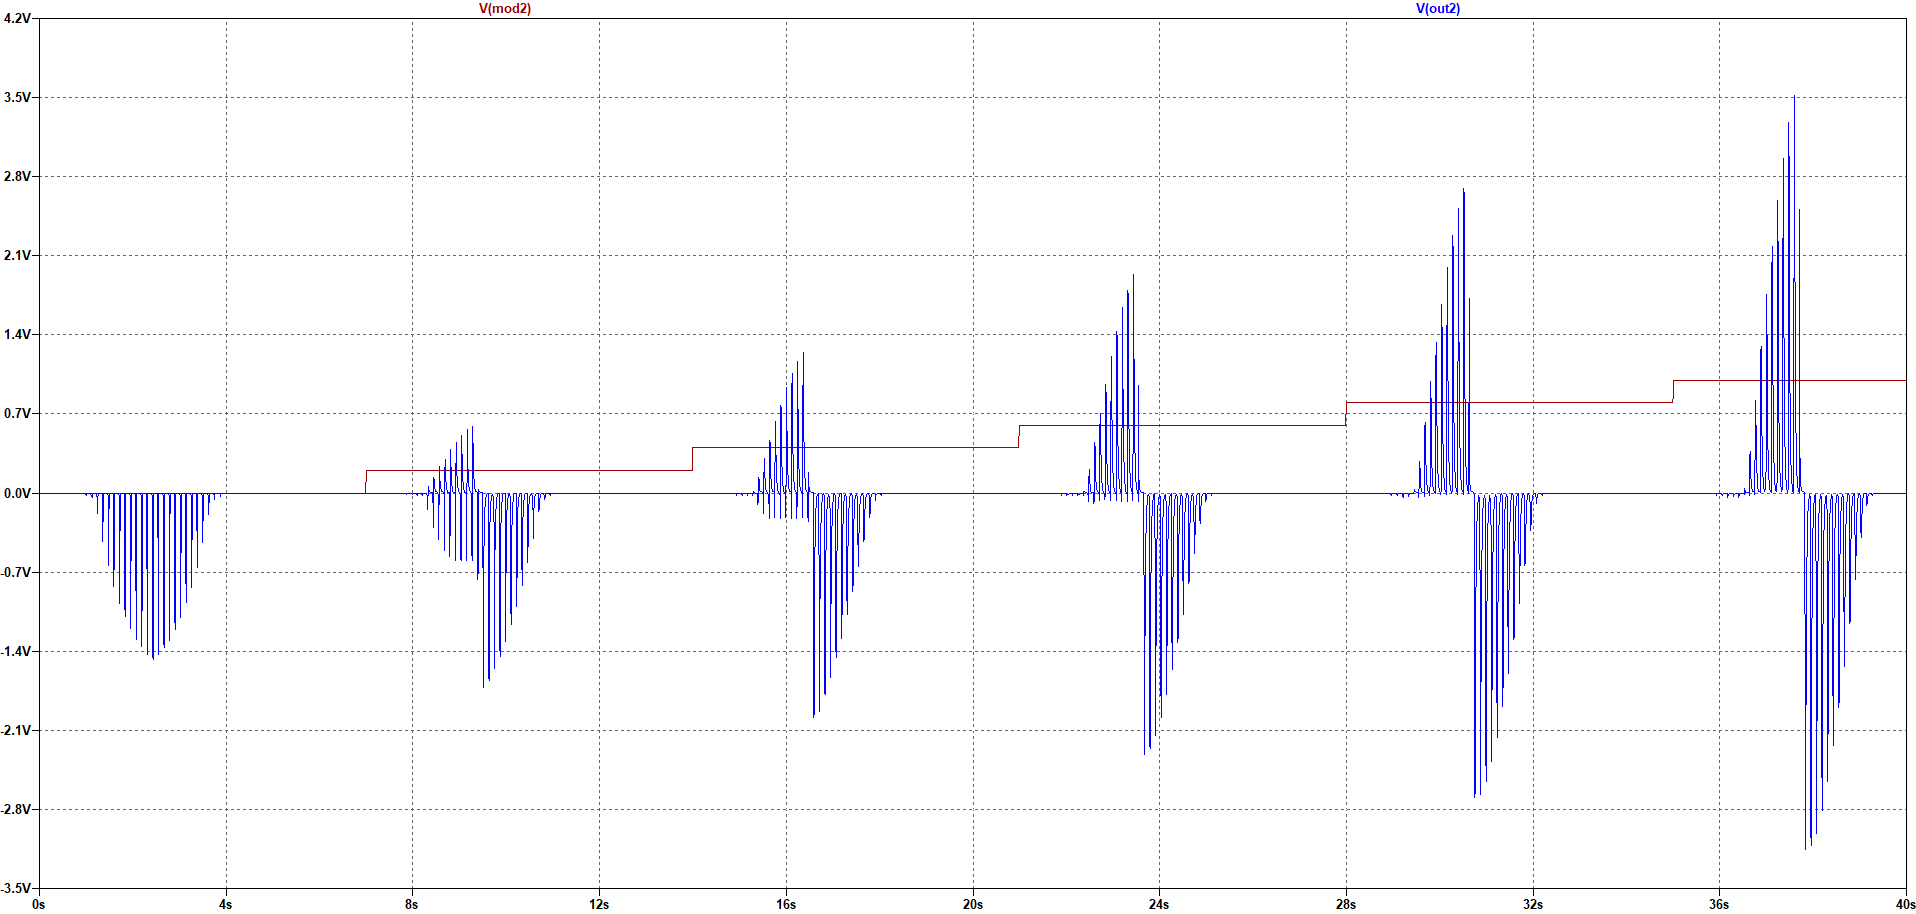
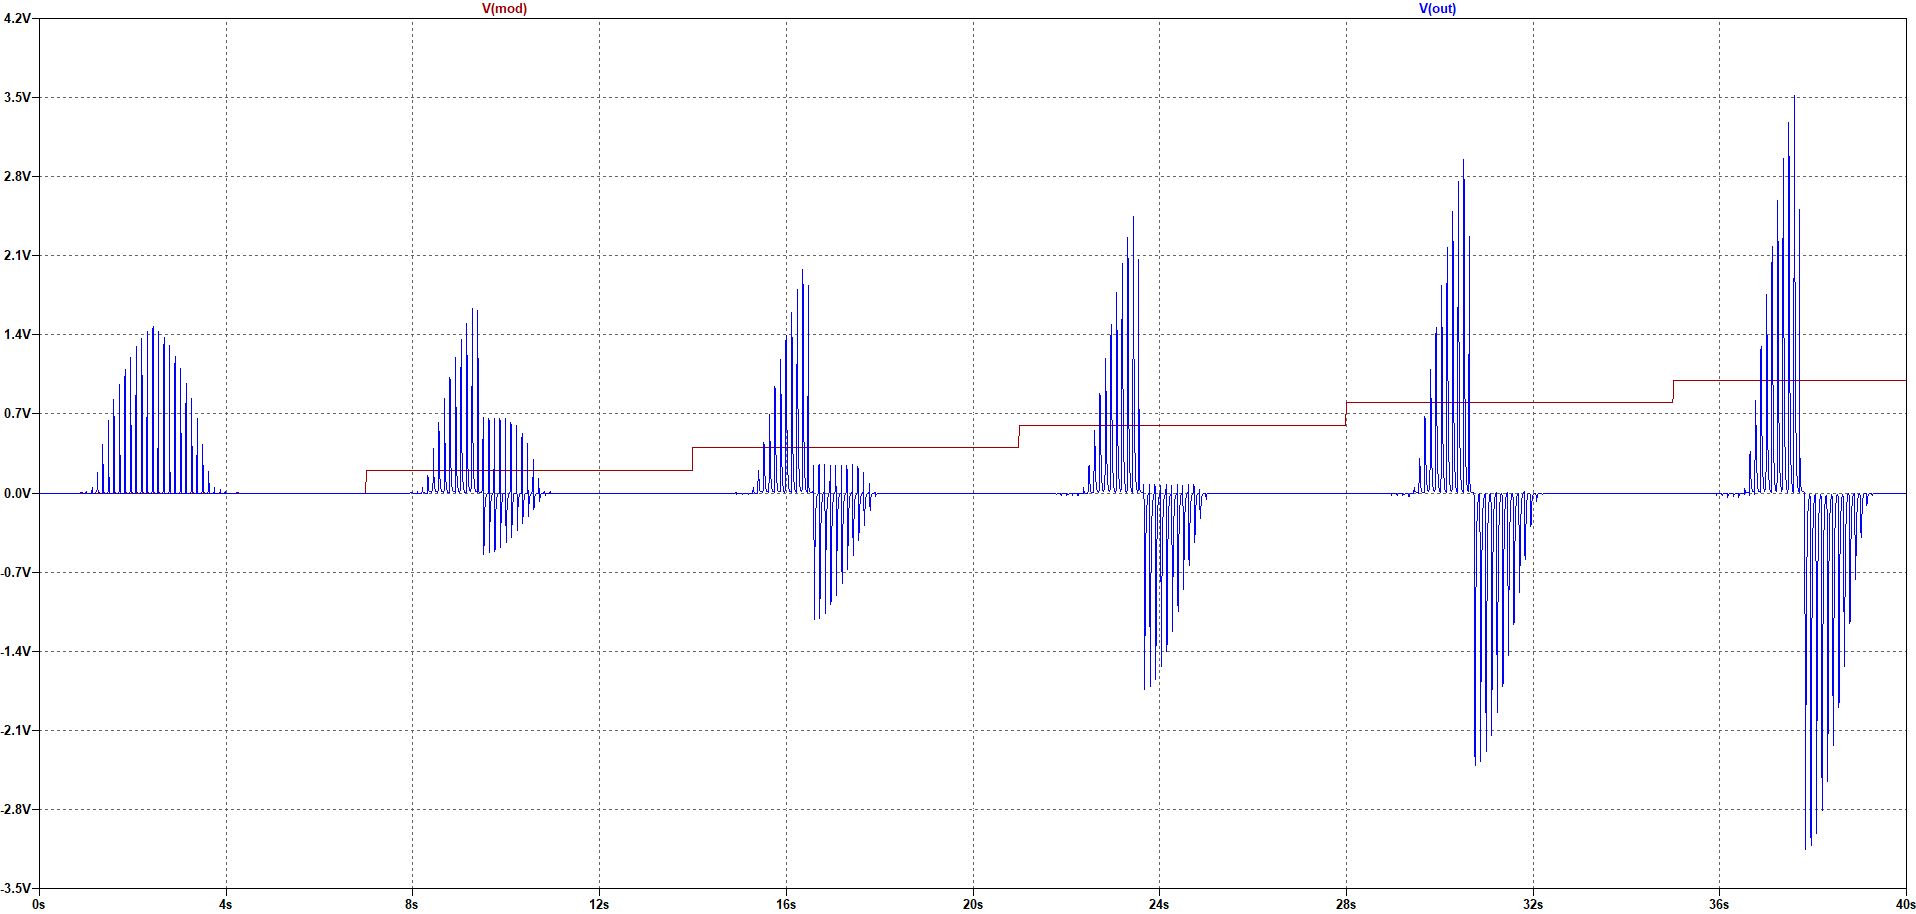
The results of D1 modulation are indicated in Fig. 5 where the proportion of the influence of the inbound learning function over outbound signal is defined by the level of the dopamine or set up of resistors and . The level of the dopamine is represented as the red graph. Learning impulses that indicate the mixture of two learning functions inverted “Sombrero” and Hebbian are represented as blue graph. The results of D2 modulation are presented in the Fig. 6 with the same color coding, where the level of the dopamine is identified via resistors and .
The initial state of both graphs is low level of the dopamine and the learning function is inverted “Sombrero” for D1 and “Sombrero” for D2 respectively. The learning function for high level of the dopamine is Hebbian or . The gradual mixture of initial learning functions with final Hebbian is represented during simulatory experiments and is depicted on both figures starting from 4 seconds till 40 seconds of the simulation.
References
- Gurney et al., (2015) Gurney, K. N., Humphries, M. D., and Redgrave, P. (2015). A New Framework for Cortico-Striatal Plasticity: Behavioural Theory Meets In Vitro Data at the Reinforcement-Action Interface. PLoS Biology, 13(1):e1002034.
- Hennequin et al., (2017) Hennequin, G., Agnes, E. J., and Vogels, T. P. (2017). Inhibitory Plasticity: Balance, Control, and Codependence. Annual Review of Neuroscience, 40(1).
- Talanov et al., (2017) Talanov, M., Zykov, E., Gerasimov, Y., Toschev, A., and Erokhin, V. (2017). Dopamine modulation via memristive schematic. CoRR, abs/1709.06325.
- Vogels et al., (2013) Vogels, T. P., Froemke, R. C., Doyon, N., Gilson, M., Haas, J. S., Liu, R., Maffei, A., Miller, P., Wierenga, C., Woodin, M. A., Zenke, F., and Sprekeler, H. (2013). Inhibitory synaptic plasticity: spike timing-dependence and putative network function. Frontiers in Neural Circuits, 7:119.