00000
33email: francesco.saturni@inaf.it
SABAT: the “Sapienza” Balloon Trajectory
Simulation Code
Abstract
We present SABAT (“Sapienza” Balloon Trajectory Simulation Code), a Fortran software for the simulation of zero-pressure scientific balloon trajectories at stratospheric altitudes. Particular attention is made to the correct reproduction of the balloon ascending phase to the floating altitude. In order to obtain trajectories in agreement with those monitored during actual balloon launches and flights, SABAT features a balloon dynamical and geometric model, and a thermal model for the heat exchanges between the vehicle and the surrounding environment. In addition, both a synthetic description of the Earth’s atmosphere and real data from radiosondes can be used. The validation tests give results in agreement with the characteristics of real balloon motion. Future developments of the code include optimization for balloons flying at polar latitudes, an improved treatment of the drag force acting on the balloon structure and the development of a user-friendly graphical interface.
keywords:
three-dimensional models; balloon flight; computerized simulation; flight simulation; high-altitude balloons; trajectory measurement1 Introduction
The problem of modeling the dynamical and thermal behavior of high-altitude, zero-pressure balloons dates back to early 1970s (e.g., Yajima et al., 2009). Efforts to systematically approach this problem in a multidisciplinary way led to the NASA’s popular prediction software THERMTRAJ (Kreith & Kreider, 1974; Carlson & Horn, 1981; Horn & Carlson, 1983) and SINBAD111See also Pankine et al. (2005) for SINBAD’s successor NAVAJO. (Raqué, 1993), which at present are however old and suffer from several limitations such as the inability to simulate 3D trajectories and the use of deprecated 1D atmospheric models. In order to overcome these limitation, new software has been developed, either by improving existing codes (e.g., Musso et al., 2004, 2005) or by writing new ones (e.g., the software ACHAB – Analysis Code for High-Altitude Balloons developed by the CIRA – Italian Aerospace Research Center in the framework of the PRORA-USV project; Palumbo et al., 2007).
In this paper we present SABAT (“Sapienza” Balloon Trajectory Simulation Code), a Fortran code for the prediction of a zero-pressure stratospheric balloon trajectory. This software has been developed in the framework of the FATA project (PI: De Bernardis)222Project description available at http://
thermalvacuum.roma1.infn.it/simulazioni-
numeriche-dello-sviluppo-di-traiettorie-
di-sonde-a-quote-suborbitali/index.html.. The manuscript is organized as follows: in Sec. 2, we give an overview of the numerical treatment of a balloon floating at stratospheric altitudes in the Earth’s atmosphere; in Sec. 3, we discuss the code validation; finally, in Sec. 4 we summarize our results and illustrate the possible software updates.
2 SABAT numerical implementation
SABAT treats a balloon during its flight as a thermodynamic system freely evolving inside a complex thermal environment subject to atmospheric winds. The full code works under the following assumptions:
-
•
the balloon is considered a point mass with 3 degrees of freedom;
-
•
the gravity gradient over the balloon height and effects of humidity on atmospheric pressure are neglected;
-
•
the gaseous components are all assumed to follow the perfect gas law;
-
•
the lifting gas is considered transparent and of uniform pressure, temperature and density (except when valving or venting);
-
•
the balloon film temperature is assumed uniform along the surface.
2.1 Balloon dynamical model
In the code, buoyancy is related to other forces acting on the balloon through a dynamical model. In order to compute a physically meaningful balloon trajectory, we assume that the balloon motion due to net buoyancy (also called gross inflation) for a balloon volume and aerodynamic drag is equivalent to a uniformly accelerated straight motion along all directions for short time intervals of integration. The acceleration is given by:
| (1) |
Here, the gross mass is the overall mass of the non-gaseous components of the balloon, i.e. the sum of the payload mass, the ballast and the balloon film mass. The term is the so-called added mass, which takes into account the airmass dragged by the balloon.
Following Palumbo et al. (2007), we model the magnitude of the drag force as:
| (2) |
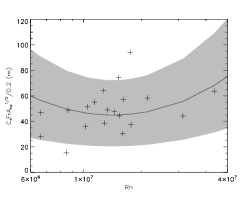
where is the balloon velocity relative to the wind speed, is the balloon top projected area (Farley, 2005) and is a drag coefficient that depends on the Reynolds number , the Froude number and the balloon geometry (see e.g. Dwyer, 1985, and refs. therein):
| (3) |
We fit this relation to the wind-tunnel balloon data by Fitz & Hubbard (1974) to derive the free parameters m, and (see Fig. 1).
2.2 Geometric and thermal model
The geometric model implemented in SABAT gives a description of the balloon shape, while the thermal model carefully considers the influence on the balloon of the surrounding environment in order to predict the flight performance. In fact, the balloon’s vertical motion critically depends on the heat transfer between inner gas and balloon film (see Farley, 2005, for a detailed description). The main assumptions at the basis of the thermal model are:
-
•
the Sun is considered a blackbody at 5550 K;
-
•
Earth is considered as a gray body with given surface temperature and emittance;
-
•
Earth and atmosphere both emit in the infrared (IR);
-
•
the balloon film is considered as a gray body primarily emitting in the IR (210 – 270 K);
-
•
heat sources are direct Sun radiation (day only), albedo (day only), diffuse IR radiation, internal IR self-glow, external and internal convection – other possible heat sources are neglected.
2.3 Atmospheric modeling
A correct modeling of Earth’s atmosphere is crucial in order to get a realistic description of the balloon trajectory. To this aim, the atmospheric model supplies information about air temperature, pressure and wind components. The script offers the possibility to choose between the International Standard Atmosphere (ISA; e.g., Talay, 1975), which samples Earth’s atmosphere average conditions of pressure, temperature and density up to an altitude of 86,000 m (corresponding to a temperature of 186.87 K, or ∘C, and a pressure of 0.373 Pa), and daily measurements of atmospheric parameters obtained from radiosondes, that are launched from several stations in order to offer a worldwide coverage333Data publicly available e.g. at http://
weather.uwyo.edu/upperair/sounding.html.. In order to obtain a meaningful trajectory simulation, atmospheric data must be retrieved from the closest monitoring station to the balloon launching site.
3 Code validation
With the features described above, SABAT is able to compute the 3D balloon trajectory starting from atmospheric conditions, balloon structure and time of launch as input. In order to validate the code, we have considered an extreme case of stratospheric balloon, with a volume of 340,000 m3 and a total mass of 4500 kg, flying at polar latitudes from the site of Ny-Ålesund (Svalbard Islands, Norway) at 78∘ 55′ 30′′ N 11∘ 55′ 20′′ E.
3.1 Drag coefficient analysis
We first analyzed the balloon ascending motion with different functional forms of the drag coefficient, depending on the balloon and wind speed moduli only. For this task, we adopted the ISA configuration as atmospheric model, and selected either:
- 1.
-
2.
Eq. 3 with no saturation;
-
3.
a constant value , which is typical of old balloon codes.
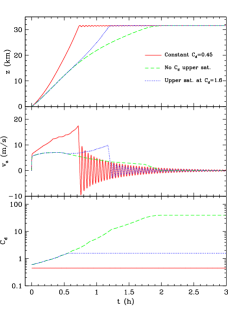
We show the comparison among the balloon vertical motions computed with each assumption in Fig. 2. A visual inspection reveals that a constant drag acting uniformly in all directions is unsuitable to correctly treat the balloon ascension, since the system reaches the floating altitude in a rather short time of 0.8 h with a maximum speed of 17 m s-1. Conversely, the vertical motion evaluated with a non-saturating aerodynamic drag produces an overestimated atmospheric resistance that excessively damps the balloon ascension and oscillations around the floating altitude. Therefore, we finally selected the saturating drag coefficient as the most suitable description for the action of drag force on the balloon.

Subsequently, we specialized the drag coefficient functional form acting along a specific direction that depends only on the balloon and wind speed components in that direction (see Fig. 3). In this way, we obtained a balloon ascending in 1.9 h to a floating altitude of 32 km, with a maximum ascending speed of 10 m s-1.
3.2 Simulations of balloon ascension with actual atmospheric data

The last step of the code development was focused on simulating “real” balloon flights from actual atmospheric input data. In order to accomplish this task, we used the sounding data for a specified date and time of operations. We therefore ran a 10 h balloon-flight simulation starting on December 15 at 12:00 UT for the years from 2003 to 2016, discarding runs in which the balloon lands before 10 h of flight.
Fig. 4 shows the resulting simulation for a total of 11 winter flights. The balloon rises up to a floating altitude of km in 2 h with a maximum vertical speed of km s-1, and lasts floating for 6 h during which the gas losses due to venting gradually reduce the balloon buoyancy. Peculiar atmospheric conditions may extend the balloon floating phase in time,which produces the large spread of up to 18 km in the final altitude during the balloon fall-down.
4 Conclusions
In this paper, we have presented the Fortran code SABAT for simulations of atmospheric balloon trajectories. Our script is able to reproduce the vertical motion of a zero-pressure balloon. The preliminary study on the balloon ascending phase pointed out that:
-
•
the atmospheric drag force is best modeled with a variable drag coefficient depending on the balloon and wind speed in each direction, saturating at a fixed value;
-
•
simulating the balloon flight for different real atmospheric conditions, the balloon reaches a floating altitude of 27 km ascending in 2 h with a maximal vertical velocity of 8 m s-1, lasting for 6 h before starting to fall due to venting gas losses. The 1 spread in floating altitudes is 4 km, which increases up to 18 km in the fall-down phase depending on the atmospheric conditions.
A future extension of the balloon trajectory simulations to vehicles specifically designed for long-duration flights at polar latitudes is planned. Future versions of this code for balloon trajectory simulations will also feature: (i) a better treatment of the aerodynamic drag in order to verify possible overestimates of the drag force (e.g., Palumbo et al., 2007), and (ii) the development of a user interface in order to allow the code to be used with simplified input, running and output operations.
Acknowledgements.
We thank I. Musso (Altec SPA) and R. Palumbo (CIRA) for useful discussion. We acknowledge funding from Progetto “FATA” Regione Lazio FILAS RU-2014-1038.References
- Carlson & Horn (1981) Carlson, L. A. & Horn, W. J. 1981, Tech. Rep. TAMRF-4217-81-01
- Dwyer (1985) Dwyer, J. F. 1985, Tech. Rep. AFGL-TR-85-0130
- Farley (2005) Farley, R. E. 2005, in AIAA 16th Lighter-Than-Air And Balloon Systems Conference; 26-28 Sep. 2005; Arlington, VA; United States, ed. U. S. NASA Goddard Space Flight Center, Greenbelt MD
- Fitz & Hubbard (1974) Fitz, C. D. & Hubbard, R. R. 1974, Tech. Rep. BT-1173
- Horn & Carlson (1983) Horn, W. J. & Carlson, L. A. 1983, NASA STI/Recon Technical Report N, 83
- Kreith & Kreider (1974) Kreith, F. & Kreider, J. F. 1974, Tech. Rep. NCAR/TN-65+STR
- Musso et al. (2004) Musso, I., Cardillo, A., Cosentino, O., & Memmo, A. 2004, Advances in Space Research, 33, 1722
- Musso et al. (2005) Musso, I., Cardillo, A., & Ibba, R. 2005, in ESA Special Publication, Vol. 590, 17th ESA Symposium on European Rocket and Balloon Programmes and Related Research, ed. B. Warmbein, 457–460
- Palumbo et al. (2007) Palumbo, R., Russo, M., Filippone, E., & Corraro, F. 2007, AIAA Atmospheric Flight Mechanics Conference and Exhibit, Hilton Head Island, SC, AIAA Paper, 6642, 2007
- Pankine et al. (2005) Pankine, A. A., Heun, M. K., Nguyen, N., & Schlaifer, R. S. 2005, in ESA Special Publication, Vol. 590, 17th ESA Symposium on European Rocket and Balloon Programmes and Related Research, ed. B. Warmbein, 451–455
- Raqué (1993) Raqué, S. M. 1993, NASA Goddard Space Flight Center Code 842/Balloon Project Branch
- Talay (1975) Talay, T. A. 1975, NASA Special Publication, 367
- Yajima et al. (2009) Yajima, N., Izutsu, N., Imamura, T., & Abe, T. 2009, Scientific Ballooning (Springer Science+Business Media, LLC, 233 Spring Street, New York, NY 10013, USA, 229 p. ISBN 978-0-387-09725-1)