Nuclear starburst activity induced by elongated bulges in spiral galaxies
Abstract
We study the effects of bulge elongation on the star formation activity in the centres of spiral galaxies using the data from the Sloan Digital Sky Survey Data Release 7. We construct a volume-limited sample of face-on spiral galaxies with mag at 0.02 < 0.055 by excluding barred galaxies, where the aperture of the SDSS spectroscopic fibre covers the bulges of the galaxies. We adopt the ellipticity of bulges measured by Simard et al. (2011) who performed two-dimensional bulge+disc decompositions using the SDSS images of galaxies, and identify nuclear starbursts using the fibre specific star formation rates derived from the SDSS spectra. We find a statistically significant correlation between bulge elongation and nuclear starbursts in the sense that the fraction of nuclear starbursts increases with bulge elongation. This correlation is more prominent for fainter and redder galaxies, which exhibit higher ratios of elongated bulges. We find no significant environmental dependence of the correlation between bulge elongation and nuclear starbursts. These results suggest that non-axisymmetric bulges can efficiently feed the gas into the centre of galaxies to trigger nuclear starburst activity.
keywords:
galaxies: evolution – galaxies: formation – galaxies: spiral – galaxies: bulges – galaxies: starburst – galaxies: star formation1 Introduction
The development of observational techniques covering multiple wavelengths has brought the detailed structures of galactic centres such as nuclear discs, nuclear rings, and nuclear bars to light (Morris & Serabyn, 1996; Knapen et al., 2002; Comerón et al., 2010; Mazzuca et al., 2011; Álvarez-Álvarez et al., 2015). These central structures are believed to be the outcome of the rearrangement of mass and energy through triaxial potentials from bulges, bars, or ovals (Kormendy & Kennicutt, 2004). In order to explain the various structures in the central regions of galaxies, migration of gaseous materials from the disc to the central region must first be examined. There are two main mechanisms driving the infall of gaseous materials. First, external effects from interactions and mergers of galaxies can affect the movement of gaseous materials (Haan et al., 2013; Medling et al., 2014), eventually triggering the star formation or nuclear activity in galaxies (Hwang et al., 2011, 2012). Second, internal processes can cause gaseous materials to fall in via a non-axisymmetric potential which leads to secular evolution. This gas inflow is difficult to observe directly; however, simulations have revealed that a non-axisymmetric mass distribution of triaxial structures can cause gas to lose angular momentum and migrate to the central regions of galaxies (Shlosman et al., 1990; Athanassoula, 1994; Combes, 2001).
To explain gas movement, early studies (Contopoulos & Papayannopoulos, 1980; Binney et al., 1991) suggested that gaseous materials move along the stable closed orbits (i.e., orbits) elongated along the bar’s major axis. The gaseous materials go through shocks and flow inwards, losing angular momentum, to arrive on the orbits, which are elongated along the minor axis. Since the gaseous materials accumulated in the central regions are used as fuel for high rates of starbursts, enhanced star formation rates are a good tracer of recent gas inflow to the centre (Knapen et al., 1995). These nuclear starbursts have strong H emission lines and a size of 0.2 to 2 kpc in the circumnuclear region (Kennicutt, 1998). They are occasionally observed as ring shapes, i.e., nuclear rings (Knapen, 2005; Knapen et al., 2006; Comerón et al., 2010).
Bars have long been considered the primary non-axisymmetric structure of galaxies that can cause a triaxial potential, and have an influence on nuclear starbursts in galactic centres, as shown in many simulations. Hydrodynamic simulations show gas migration from the galactic disc to the central molecular zone and enhanced star formation in the galactic centre (Kim et al., 2011, 2012; Seo & Kim, 2013; Shin et al., 2017). The relationships between bars and nuclear starbursts (Ho et al., 1997; Mulchaey & Regan, 1997; Knapen et al., 2000, 2006; Ellison et al., 2011; Wang et al., 2012; Kim et al., 2017) and between bars and nuclear rings (Martinet & Friedli, 1997; Aguerri, 1999; Mazzuca et al., 2008; Comerón et al., 2010) have also been studied through many observations. Although two-thirds of galaxies have bars (de Vaucouleurs et al., 1991; Mulchaey & Regan, 1997; Knapen et al., 2000; Eskridge et al., 2000; Laurikainen et al., 2009), non-barred galaxies can also host ovals or triaxial bulges kinematically acting like bars. Compared to bars, ovals have lower ellipticity (Laurikainen et al., 2009), but more of the disc mass is involved in the non-axisymmetry (Kormendy & Kennicutt, 2004). Since the dynamical evolution of ovals is similar to that of bars, their kinematic effects would also be similar (Kormendy & Kennicutt, 2004).
Triaxial bulges have been discovered in many spiral galaxies (Kormendy, 1982; Zaritsky & Lo, 1986; Bertola et al., 1991). Méndez-Abreu et al. (2008) showed that 80 per cent of bulges in non-barred lenticulars and early to intermediate spiral galaxies are triaxial. The dynamics of triaxial bulges resemble those of bars, but they are different from those of elliptical galaxies (Kormendy, 1982). Non-axisymmetric potentials of triaxial bulges acting like bars are common, yet there are not enough studies to understand the relationship between bulges and nuclear starbursts.
In this paper, we study the effect of bulge elongation on nuclear starbursts of galaxies as a function of galaxy parameters that include luminosity, colour, concentration and environments. We use data from the Sloan Digital Sky Survey (SDSS; York et al. 2000) Data Release 7, and only select non-barred galaxies to avoid mixed effects of bars due to a bar and a bulge are morphologically and physically correlated (Kim et al., 2015). We use 6,490 galaxies in the redshift range of 0.02 0.055. This allows us to statistically study the relationship between the elongation of bulges and central starbursts on galaxy properties and the environment. This paper is organised as follows. We describe our sample in Section 2, and present our results on how triaxial bulges affect central starbursts in Section 3. We summarise these results in the context of galaxy evolution in Section 4.
2 SAMPLE SELECTION
2.1 A Volume-limited Sample of Non-barred Galaxies
Our goal is to use a large sample of non-barred galaxies with both photometric and spectroscopic data to study a possible correlation between bulge elongation and nuclear star formation activity. Thus, we use the SDSS, which is the largest survey to explore galaxies and quasars with multi-colour images, and covers one-fourth of the sky. We selected a volume-limited sample of 33,391 galaxies spanning the redshift range of 0.02 < 0.055 and the magnitude range of +5log. Hereafter, we drop the +5log term in the absolute magnitude ( = 100 km s-1 Mpc-1 ). The bar classification for a large sample of SDSS galaxies is available in Lee et al. (2012). They provided a volume-limited sample for the same redshift and -band absolute magnitude ranges. They visually inspected + + combined colour images, and investigated the relationship between the presence of bars and galaxy properties. This bar classification includes three different bar types: strong, weak and ambiguous bar types. Although visual inspection is still a reliable method to identify internal features of galaxies and the classification of barred and non-barred galaxies in this study agrees well with others (Nair & Abraham, 2010; Huertas et al., 2011), visual inspection might miss some galaxies with very weak bars (Y. H. Lee et al. 2018, in preparation). Our redshift and magnitude cuts allow us to study only those galaxies which are large enough to show internal features. We could also avoid some saturated galaxies or very faint galaxies using these cuts, which can minimize any biases that could be introduced by visual inspection.
The catalogue of Lee et al. (2012) contains several physical parameters of galaxies including their morphology and photometry drawn from the Korea Institute for Advanced Study Value-Added Galaxy Catalogue (KIAS-VAGC; Choi et al. 2010), which is based on the SDSS DR7 (Abazajian et al., 2009). The galaxy morphology is determined using an automated classification scheme of Park & Choi (2005) and from additional visual classification. From among the 33,391 galaxies in Lee et al. (2012), we selected only 10,830 late-type galaxies with an axis ratio of 0.6. The axis ratio condition is applied to reduce contamination by internal extinction effects and selection bias because of inclination effects. Because galaxies are expected to have random inclination angles on the sky, this condition does not introduce any bias in our sample selection. Among the 10,830 late-type galaxies with an axis ratio of 0.6, 6,490 galaxies do not have bars.
| Step | Criteria | Number of galaxies |
|---|---|---|
| 1 | Galaxies with 0.02 0.055 | 33,391 |
| & –19.5 mag | ||
| 2 | Late types with 0.6 | 10,830 |
| 3 | Non-barred galaxies | 6,490 |
| 4 | Bulge+disc decomposition | 5,577 |
| 5 | Final sample | 1,291 |
Physical parameters of galaxies used in this paper are provided by KIAS-VAGC: absolute Petrosian magnitude , (0.1 colour, and inverse concentration index (). These parameters represent most major physical properties of galaxies that are related to star formation activity (Park & Choi, 2009). The rest-frame absolute magnitudes of individual galaxies were computed in fixed bandpasses, shifted to = 0.1, using Galactic reddening corrections (Schlegel et al., 1998). -corrections (Blanton et al., 2003) and the mean evolution correction (Tegmark et al., 2004) were also applied. Hereafter, the superscript 0.1, which represents the rest-frame at = 0.1, will be dropped. The concentration index is defined as = for an -band image including seeing correction. and are the radii from the centre of a galaxy containing 50, and 90 of the Petrosian flux, respectively.
2.2 Identification of bulge+disc systems using the two-dimensional decomposition of Simard et al. (2011)
We cross-matched the 6,490 non-barred galaxies with the galaxies in the catalogue of Simard et al. (2011) who performed two-dimensional bulge+disc decompositions using the SDSS and images for 1,123,718 galaxies in the SDSS DR7. They used the GIM2D software package (Simard et al., 2002) for the decomposition of galaxy images. They provide the results from three different galaxy fitting models which include a pure Sérsic model and Sérsic bulge + disc models with free Sérsic index () or with fixed (i.e. = 4). We adopt the bulge parameters (e.g. ellipiticy, effective radius) from the most general fitting case (i.e. Sérsic bulge + disc model with free Sérsic index). Kim et al. (2016) showed that the results of Simard et al. (2011) based on the Sérsic bulge + disc model with free Sérsic index agree well with their results using GALFIT (Peng et al., 2002). Although the galaxy sample of Simard et al. (2011) is also from SDSS DR7, the sample selection is not exactly the same as the one for our parent galaxy sample (i.e. KIAS-VAGC). The KIAS-VAGC also contains some galaxies with measured redshifts from the literature, not included in the catalogue of Simard et al. (2011). Among the 6,490 galaxies in our sample, there are 5,577 galaxies with measured bulge parameters.
To select the bulge+disc systems with reasonable profile fitting results, we apply the following selection criteria by combining the conditions recommended by Simard et al. (2011); 1) the -test probability () that a bulge+disc model is not required compared to a pure Sérsic model should be equal to or higher than 0.32 (i.e. 0.32), 2) the effective radius of a bulge should be larger than two pixels111The pixel size and the typical seeing of the SDSS observations are 0.396″and 1.43″respectively in the -band. When we conservatively select the galaxies with ¿ 5 pixels instead of ¿ 2 pixels, our findings in the present paper remain largely unaltered. (i.e. 2 pixels). 3) the bulge fraction () should be larger than 0.2, 4) the disc inclination angle measured in Simard et al. (2011) should be equal to or less than 53 degree that corresponds to axis ratio 0.6 as applied to the KIAS-VAGC in Section 2.1, and 5) the Sérsic index () should be larger than 0.5 and smaller than 8: i.e. 0.5 8; the galaxies with = 0.5 or 8 are those with nuclear sources, off-center components, etc. The galaxies with large errors in measured bulge ellipticity are already removed by these criteria, thus we do not include the condition for the bulge ellipticity error in these criteria; the mean error of measured bulge ellipticity in the final sample is is 0.022 0.002. The use of different criteria can change the number of sample galaxies, but does not change our main conclusion. We also visually inspected the galaxies to remove 53 problematic cases (e.g. merging galaxies, irregular galaxies, and contaminated by bright stars). We are left with a final sample of 1,291 galaxies. Table 1 summarises the changes of galaxy numbers in these steps.
2.3 Identification of Galaxies with Central Starbursts
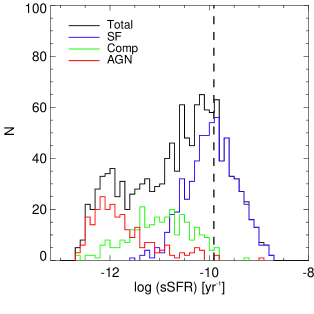
In the redshift range of 0.02 0.055, the physical size of the SDSS fibre radius (1.5′′) corresponds to 0.44 to 1.18 kpc. Effective radii of galactic bulges are up to 3 kpc in the similar redshift range (Gadotti, 2009; Fisher et al., 2010). Thus the size of the SDSS fibre radius is similar to or smaller than the size of the galaxy bulges. For this reason, we assume that the star formation rates derived from the fibres represent those from the central regions (bulges) of the galaxies. The specific SFR (sSFR) values are taken from the Max Planck Institute for Astrophysics and Johns Hopkins University (MPA/JHU) DR8 catalogue (Brinchmann et al., 2004; Kauffmann et al., 2003). The fibre (hereafter, nuclear) sSFRs distribution of our sample is shown in Fig. 1. Objects are classified as star-forming galaxies, composite galaxies, or active galactic nuclei (AGN) using the Baldwin-Phillips-Terlevich (BPT) diagram (Baldwin et al., 1981; Kewley et al., 2006). We fit double Gaussians to the log(sSFR) distribution of our sample, and find that the larger of the two Gaussian peaks has a value of log(sSFR) [yr-1]. We define galaxies with log(sSFR) – 9.98 [yr-1] as central starburst galaxies which include star forming galaxies of higher log(sSFR) than the median value. Fig. 1 shows that AGNs are clearly separated from our starburst galaxies in the sSFR dimension. We will discuss the degree of central activity of a certain galaxy group in terms of the fraction of nuclear starburst galaxies, , in the following sections.
3 Results
3.1 Correlation between bulge elongation and nuclear star formation activity in galaxies
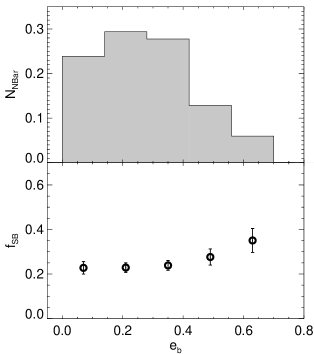
Here we examine the correlation between bulge elongation and nuclear star formation activity. We first show a fraction of non-barred galaxies with nuclear starburst activity () as a function of bulge ellipticity () in the bottom panel of Fig. 2. The increases with . The number distribution in the top panel shows that the peak of the distribution is around , and the number of galaxies decreases at 0.4. We use several statistical tools to examine the significance of the correlation between bulge ellipticity and starburst fraction. The Spearman correlation test between the two gives a correlation coefficient = 1.0 and the probability of obtaining the correlation by chance of 0.001, suggesting a significant correlation. We also apply the Kolmogorov-Smirnov (K-S) test and the Anderson-Darling (A-D) k-sample test directly to the distributions of sSFRs of galaxies (not the fraction) for two subsamples divided by bulge ellipticity (i.e. 0.4 and 0.4). We could reject the hypothesis that the sSFR distributions of the two samples are extracted from the same parent population with a confidence level of 98. This confirms a significant difference in the star formation activity between the two subsamples with different bulge ellipticities.
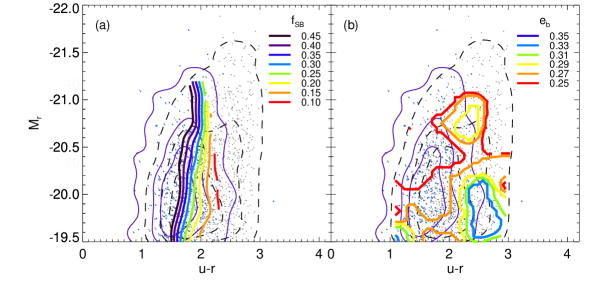
Fig. 3(a) shows that depends more strongly on the colour than on . Here, note that fixing the colour is needed to carefully investigate the relationship between bulge elongation and nuclear star formation. We divided samples into relatively blue and red at 1.8 mag, which is similar to the peak of colour of spiral galaxies separating morphological type Sb vs. SC/Irr (See Fig. 7 in Strateva et al. 2001; Baldry et al. 2004). For blue galaxies with 1.8 mag, bright galaxies have higher at fixed colour. These galaxies might be the result of gas-rich major mergers that show high star formation rates during late stages of merging (Kennicutt, 2012; van Dokkum, 2005). Fig. 3(b) shows that bulges are more elongated as galaxies become redder and fainter. has low values when galaxies become brighter than mag. This value is similar to a characteristic luminosity in the -band, mag, of the SDSS sample (Blanton et al., 2003). Galaxies brighter than the characteristic luminosity show that the number density, stellar mass, gas contents and other parameters dramatically change compared to galaxies with lower luminosities than the characteristic luminosity (Blanton et al., 2009). Since and are intricately correlated with the magnitude and colour of host galaxies, we divided the samples into bright or faint galaxies, and blue or red galaxies in order to separate the intricate relationships between the parameters in our subsequent analysis. The and contours indicate the fraction and the median value at each point, respectively. We obtain the contours by dividing each panel into 60 by 60 bins and by applying the spline kernel method to extract smoothed distributions. The contours represent 2 level, and the uncertainties for and are calculated by 1000 times resampling bootstrap method.
3.2 The Effects of Absolute magnitudes () and colours on the Correlation between bulge elongation and nuclear star formation activity
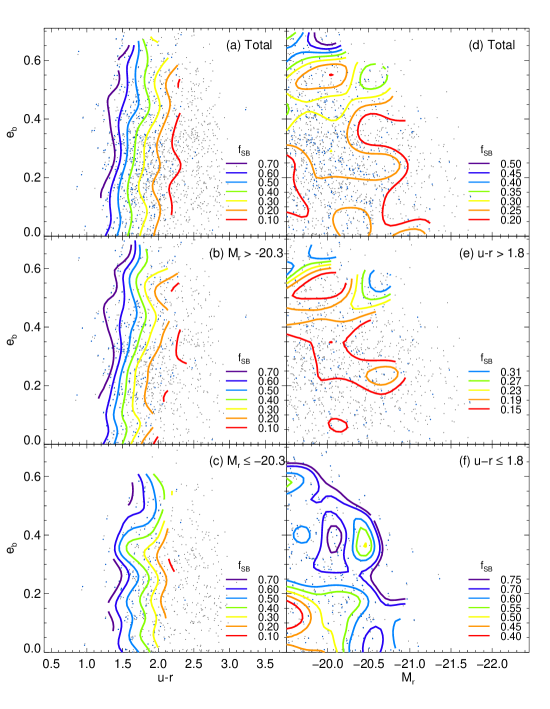
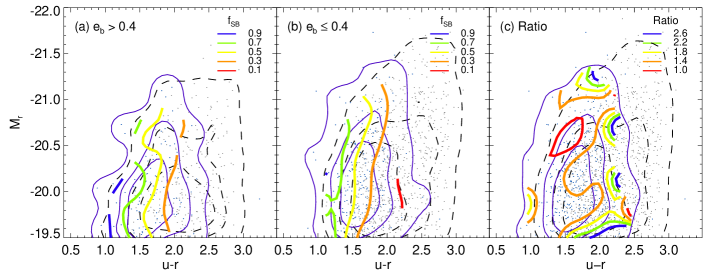
We compare the dependence of on several physical parameters when galaxies are classified as bright or faint, and blue or red. Fig. 4 shows of the galaxies in the planes of versus colour and of versus . The left panels are for the whole galaxy sample, realtively faint ( mag ) and bright ( mag ) galaxies. In Fig. 4(a), of all galaxies strongly depends on colour and increases from 10 to 70 as the colour becomes bluer. This stronger dependence of on colour than on remains similar even when we divide the galaxies into two subsamples based on luminosity (i.e. middle and bottom panels).
The right panels show the dependence of on and for total, relatively red ( 1.8 mag) and blue galaxies ( 1.8 mag). Fig. 4(d) shows that it is difficult to separate the effects of and on because of noisy contours. When the samples are divided by colour, the dependence of on and on become more well-defined. For example, Fig. 4(e) based on the sample of red galaxies containing relatively low gas amounts shows that the contours are more horizontal at 0.2. This suggests that is correlated better with than with . Fig. 4(f) shows the dependence of on in blue galaxies which are expected to have relatively large amounts of gas. The comparison of panels (e) and (f) suggests that is generally higher in blue galaxies than in red galaxies. The increases as increases when galaxies are relatively faint. The also increases as brightens at a given when is smaller than 0.2. It also suggests that the bulge elongation effect on is slightly more prominent in red galaxies than in blue galaxies.
The of galaxies that have relatively elongated bulges ( 0.4) and rounded bulges ( 0.4), and their ratios are shown in Fig. 5. Galaxies with elongated bulges are a few in bright region, and the contours of for galaxies with elongated bulges are shifted to redder colours compared with those with rounded bulges in Fig. 5 (a) and (b). The ratio of of galaxies with elongated and rounded bulges is shown in Fig. 5 (c). There is a trend that the ratio increases as becomes redder, and the ratio for faint galaxies is higher compared to that for bright galaxies. This implies that these bright galaxies that have grown through mergers have low , and weak correlation with . The effects on the of faint galaxies depending on colour can be more specifically explained based on the bulge dominance in Section 3.3.
3.3 The Effects of Mass Concentration on the Correlation between bulge elongation and nuclear star formation activity
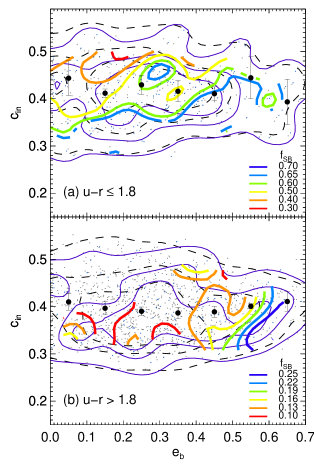
In the previous sections, we found that the role of bulge ellipticity in nuclear starbursts depends on galaxy properties. Here, we examine how the role of bulge ellipticity differs according to the light concentration (bulge dominance), in addition to the colours and luminosities of galaxies. The luminosity distribution of bulges has a relationship with the host galaxy’s morphological type (Andredakis et al., 1995; Graham, 2000) and separates galaxies with different star formation histories (Choi et al., 2007). The bulge dominance can be determined using the bulge-to-total flux ratio, the concentration index, or the inverse concentration index (Shimasaku et al., 2001; Park & Choi, 2005; Gadotti, 2009). We use the inverse concentration index (Shimasaku et al., 2001; Park & Choi, 2005), , as a bulge dominance indicator. Fig. 6 shows that for blue galaxies is tightly correlated with and the galaxies with high on average have high . For red galaxies, is not related to as much as for blue galaxies, but very clearly the galaxies have higher as increases.
3.4 Environmental Effects on the Correlation between bulge elongation and nuclear star formation activity
The environments of galaxies affect not only the internal structure of galaxies, but also various activities in galaxies (Park et al., 2007; Hwang et al., 2010; Lee et al., 2018). Lackner & Gunn (2013) found two different environmental effects: relatively high density environments affect morphological transformation, while low density environments contribute to star formation quenching. Bulges also have grown through galaxy evolution driven by environmental or bar effects (Méndez-Abreu et al., 2008). Thus, we need to separate the environmental effects that can influence bulges and nuclear star formation.
We adopt two types of environmental parameters: a background mass density as a large-scale environment and a projected distance to the nearest neighbour galaxy Rn as a small-scale environment. For the large-scale environment, we select galaxies from intermediate density regions to avoid extreme environments such as clusters or void regions. To exclude the effects of neighbouring galaxies, we select isolated galaxies that are placed far away (3 times their virial radius from neighbouring galaxies) and investigate the correlation of and for these galaxies. For comparison, we present the results of galaxies that have neighbouring galaxies at relatively close distances (i.e. interacting galaxies).
The large-scale background density (Park & Choi, 2009), the mass density, is determined by using 20 neighbouring galaxies over a few Mpc scale. The small-scale environmental parameter is the normalised distance to the nearest neighbour galaxy. The background density at a given location of a galaxy is obtained through Eq. (1),
| (1) |
where is the location of the target galaxy. Parameters , , and are the mass-to-light ratio, the -band luminosity of the nearest 20 galaxies brighter than mag, and the mean density of the universe, respectively. The smoothing filter function, the spline-kernel weight, , and other detailed information are described in Park et al. (2008) and Park & Choi (2009). Second, we consider the distance to the nearest galaxy from the target galaxy, normalised by the virial radius of the nearest galaxy. This parameter is expressed as . The virial radius of a galaxy is defined as the projected radius in which the mean mass density is 740 times the mean density of the universe. That is,
| (2) |
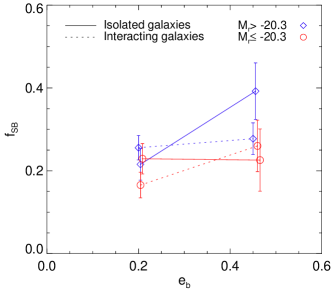
See Section 2.3 in Park et al. (2008) and Section 2.3 in Park & Choi (2009) for detailed descriptions. Due to at the locations in massive clusters is over 50 (Park & Choi, 2009), we constrain the sample considering the environmental effects and the number of galaxies based on the following criteria. We select galaxies at intermediate density (1 30), then divide them into isolated () and interacting () galaxies. As we explained above, is the parameter used to perceive how far the host galaxies are from their neighbouring galaxies’ virial radius. When 1, a host galaxy is located within the virial radius of its nearest neighbour galaxy. Fig. 7 shows that of each galaxy sample divided by environment and luminosity generally increases with despite large error bars, but the trend between and does not depend significantly on galaxy environment.
4 Summary
We use bulge ellipticity and physical parameters of galaxies to examine the correlation between the elongation of bulge and the nuclear starbursts. To better understand the bulge effect, we only use non-barred galaxies. Because the fraction of galaxies with nuclear starburst activity and the bulge elongation are affected by and colour, respectively, we examine the correlation between the nuclear starburst fraction and bulge ellipticity by fixing galaxy luminosity and colour. We find that generally increases in galaxies with larger bulge elongation, and this correlation is more prominent in faint and red galaxies. The major results are as follows.
-
1.
The nuclear starburst fraction () is more strongly dependent on colour than on , which can indicate the importance of the amount of gas in star formation activity. The bulge ellipticity increases as galaxies become fainter and redder.
-
2.
The effects of elongated bulges on the nuclear starburst activity are more pronounced in fainter (less massive) and redder galaxies (little gas supply). This can suggest that a secular process associated with elongated bulges plays an important part in less massive galaxies with little cold gas reservoir, which seem to be in relatively sterile conditions for triggering nuclear starbursts.
-
3.
also strongly depends on for blue galaxies, but the dependence of becomes weak and the dependence becomes strong for red galaxies.
-
4.
generally increases with even when separating the galaxy environment. However, this dependence does not differ much depending on galaxy environment.
Our results suggest that non-axisymmetric bulge can feed the gas into the centre of galaxies to trigger nuclear starburst activity. To better understand the correlation between star formation activity and bulge elongation, two-dimensional spectroscopic data along with information on the amount of gas in these galaxies will be very helpful.
Acknowledgements
We thank the anonymous referee for insightful comments. SSK and EK were supported by a National Research Foundation grant funded by the Ministry of Science, ICT and Future Planning of Korea (NRF-2014R1A2A1A11052367). GHL is supported by a KASI-Arizona Fellowship. RdG was partially supported by the National Natural Science Foundation of China through grants U1631102, 11373010, and 11633005. RdG also acknowledges support from the National Key Research and Development Program of China through grant 2017YFA0402702. MGL was supported by a grant from the National Research Foundation (NRF) of Korea, funded by the Korean Government (NRF-2017R1A2B4004632).
Funding for the SDSS and SDSS-II has been provided by the Alfred P. Sloan Foundation, the Participating Institutions, the National Science Foundation, the U.S. Department of Energy, the National Aeronautics and Space Administration, the Japanese Monbukagakusho, the Max Planck Society, and the Higher Education Funding Council for England. The SDSS Web Site is http://www.sdss.org/.
The SDSS is managed by the Astrophysical Research Consortium for the Participating Institutions. The Participating Institutions are the American Museum of Natural History, Astrophysical Institute Potsdam, University of Basel, University of Cambridge, Case Western Reserve University, University of Chicago, Drexel University, Fermilab, the Institute for Advanced Study, the Japan Participation Group, Johns Hopkins University, the Joint Institute for Nuclear Astrophysics, the Kavli Institute for Particle Astrophysics and Cosmology, the Korean Scientist Group, the Chinese Academy of Sciences (LAMOST), Los Alamos National Laboratory, the Max-Planck-Institute for Astronomy (MPIA), the Max-Planck-Institute for Astrophysics (MPA), New Mexico State University, Ohio State University, University of Pittsburgh, University of Portsmouth, Princeton University, the United States Naval Observatory, and the University of Washington.
References
- Aihara et al. (2011) Aihara H. et al., 2011, ApJS, 193, 29
- Abazajian et al. (2009) Abazajian K. et al., 2009, ApJS,182, 543
- Álvarez-Álvarez et al. (2015) Álvarez-Álvarez M., Diaz A. I., Terlevich E., Terlevichm R., 2015, MNRAS, 451, 3173
- Andredakis et al. (1995) Andredakis Y. C., Peletier R. F., Balcells M. ,1995, MNRAS, 275, 874
- Aguerri (1999) Aguerri,J. A. L.,1999, A&A, 351, 43
- Athanassoula (1994) Athanassoula E., 1994, Mass-Transfer Induced Activity in Galaxies, 143
- Baldwin et al. (1981) Baldwin J. A., Phillips M. M., Terlevich, R., 1981, PASP, 93, 5
- Baldry et al. (2004) Baldry I. K., Glazebrook K., Brinkmann J., Ivezić Ž., Lupton R. H., Nichol R. C., Szalay A. S., 2004, ApJ, 600, 681
- Bertola et al. (1991) Bertola F., Viertri M., Zeilinger W. W., 1991, ApJ, 374, 13
- Binney et al. (1991) Binney G., Gerhard O. E., Stark A. A., Bally J., Uchida K. I., 1991, MNRAS, 252, 210
- Blanton et al. (2009) Blanton M. R., Moustakas J., 2009, ARA&A, 47, 159
- Blanton et al. (2003) Blanton M. R. et al., 2003, ApJ, 592, 819
- Brinchmann et al. (2004) Brinchmann J., Charlot S., White S. D. M., Tremonti C., Kauffmann G., Heckman T., Brinkmann J., 2004, MNRAS, 351, 1151
- Choi et al. (2007) Choi Y.-Y., Park C., Vogeley M. S., 2007, ApJ, 658, 884
- Choi et al. (2010) Choi Y.-Y., Han D.-H., Kim S. S.m 2010, JKAS, 43, 191
- Combes (2001) Combes F., 2001, in Advanced Lectures on the Starburst?AGN Connection, ed. I. Aretxaga, D. Kunth, & R. Mújica, World Scientific, Singapore, p. 223
- Comerón et al. (2010) Comerón S., Knapen J. H., Beckman J. E., Laurikainen E., Salo H., Martínez-Valpuesta I., Buta R. J., 2010, MNRAS, 402, 2462
- Contopoulos & Papayannopoulos (1980) Conotopoulos, G., Papayannopoulos T., 1980, A&A, 92, 33
- de Vaucouleurs et al. (1991) de Vaucouleurs G., de Vaucouleurs A., Corwin H. G., Buta R. J., Paturel G., Fouque P., 1991, Third Reference Catalogue of Bright Galaxies, Springer-Verlag, Berlin
- Ellison et al. (2011) Ellison S. L., Nair P., Patton D. R., Scudder J. M., Mendel J. T., Simard L., 2011, MNRAS, 416, 2182
- Eskridge et al. (2000) Eskridge P. B. et al., 2000, AJ, 119, 536
- Fisher et al. (2010) Fisher S. B., Drory N., 2010, ApJ, 716, 942
- Gadotti (2009) Gadotti D. A, 2009, MNRAS, 393, 1531
- Graham (2000) Graham A. W., 2001, AJ, 121, 820
- Jedrzejewski (1987) Jedrzejewski R. I., 1987, MNRAS, 226, 747
- Haan et al. (2013) Haan S. et al., 2013, MNRAS, 434, 1264
- Ho et al. (1997) Ho L. C., Filippenko A. V., Sargent, W. L. W., 1997, ApJ, 487, 591
- Huertas et al. (2011) Huertas-Company M., Aguerri J. A. L., Bernardi M., Mei S., Sánchez Almeida J., 2011, A&A, 525, A157
- Hwang et al. (2010) Hwang H. S., Elbaz D., Lee J. C., Jeong W.-S., Park C., Lee M. G., Lee H. M., 2010, A&A, 522, A33
- Hwang et al. (2011) Hwang H. S. et al., 2011, A&A, 535, A60
- Hwang et al. (2012) Hwang H. S., Park C., Elbaz D., Choi, Y.-Y., 2012, A&A, 538, A15
- Kennicutt (1998) Kennicutt R. C. Jr., 1998, ARA&A, 36, 189
- Kennicutt (2012) Kennicutt R. C., Evans N. J., 2012, ARA&A, 50, 531
- Kewley et al. (2006) Kewley L. J., Geller M. J., Barton E. J., 2006, AJ, 131, 2004
- Kauffmann et al. (2003) Kauffmann G. et al., 2003, MNRAS, 341, 33
- Knapen et al. (1995) Knapen J. H., Beckman J. E., Heller C. H., Shlosman I., de Jong R. S., 1995, ApJ, 454, 623
- Knapen et al. (2000) Knapen J. H., Shlosman I., Peletier R. F., 2000, ApJ, 529, 93
- Knapen et al. (2002) Knapen J. H., Perez-Ramorez D., Laine S., 2002, MNRAS, 337, 808
- Knapen (2005) Knapen J. H., 2005, A&A, 429, 141
- Knapen et al. (2006) Knapen J. H., Mazzuca L. M., Böker T. et al., 2006, A&A, 448 ,489
- Kim et al. (2017) Kim E., Hwang H. S., Chung H., Lee G.-H., Park C., Cervantes Sodi B., Kim S. S., 2017, ApJ, 845, 93
- Kim et al. (2016) Kim K., Oh S., Jeong H., Aragón-Salamanca A., Smith R., Yi S. K., 2016, ApJS, 225, 6
- Kim et al. (2011) Kim S. S., Saitoh T. R., Jeon M., Figer S. F., Merrit D., Wada K., 2011, ApJ, 735, L11
- Kim et al. (2015) Kim T. et al., 2015, ApJ, 799, 99
- Kim et al. (2012) Kim W.-T, Seo W.-Y., Stone J. M., Yoon D., Teuben P. J., 2012, ApJ, 747, 60
- Kormendy (1982) Kormendy J., 1982, ApJ, 257, 75
- Kormendy & Kennicutt (2004) Kormendy J., Kennicutt Jr. R. C., 2004, ARA&A, 42, 603
- Jogee et al. (2004) Jogee S. et al., 2004, ApJ, 615, L105
- Lackner & Gunn (2013) Lackne, C. N., Gunn J. E., 2013, MNRAS, 428, 2141
- Laurikainen et al. (2009) Laurikainen E., Salo H., Buta R., Kanpen J. H., 2009, ApJ, 692, L34
- Lee et al. (2012) Lee G.-H., Park G., Lee M. G., Choi Y.-Y., 2012, ApJ, 745, 125
- Lee et al. (2018) Lee J. C., Hwang H. S., Chung H., 2018, arXiv:1802.10265
- Martinet & Friedli (1997) Martinet L., Friedli D., 1997, A&A, 323, 363
- Mazzuca et al. (2008) Mazzuca L. M., Kanppen J. H., Veilleux S., Regan M. W., 2008, ApJS, 174, 337
- Mazzuca et al. (2011) Mazzuca L. M., Swaters R. A., Knapen J. H., Veilleux S., 2011, ApJ, 739, 104
- Medling et al. (2014) Medling A. M. et al., 2014, ApJ, 784, 70
- Méndez-Abreu et al. (2008) Méndez-Abreu J., Aguerri J. A. L., Corsini E. M., Simonneau E., 2008, A&A, 478, 353
- Morris & Serabyn (1996) Morris M, Serabyn E., 1996, ARA&A, 34, 645
- Mulchaey & Regan (1997) Mulchaey J. S., Regan M. W., 1997, ApJ, 482, L135
- Nair & Abraham (2010) Nair P. B., Abraham R. G., 2010, ApJS, 186, 427
- Park & Choi (2005) Park C., Choi Y.-Y., 2005, ApJ, 635, 29
- Park et al. (2007) Park C. et al., 2007, ApJ, 658, 898
- Park et al. (2008) Park C., Gott J. R., Choi, Y.-Y., 2008, ApJ, 674, 784
- Park & Choi (2009) Park C., Choi, Y.-Y., 2009, ApJ, 691, 1828
- Peng et al. (2002) Peng C. Y., Ho L. C., Impey C. D., Rix H.-W., 2002, AJ124, 266
- Schlegel et al. (1998) Schlegel D. J., Finkbeiner D. P., Davis M., 1998, ApJ, 500, 525
- Sérsic (1968) Sérsic J. L., 1968, Altas de Galaxias Australes, Cordoba: Observatorio Astronomico
- Seo & Kim (2013) Seo W.-Y., Kim W.-T., 2013, ApJ, 769, 100
- Shimasaku et al. (2001) Shimasaku K. et al., 2001, AJ, 122, 1238
- Shin et al. (2017) Shin J., Kim S. S., Baba J., Saitoh T. R., Hwang J.-S.,Chun K., Hozumi S., 2017, ApJ, 841, 74
- Shlosman et al. (1990) Shlosman I., Begelman M. C., Frank J., 1990, Nature, 345, 679
- Simard et al. (2002) Simard L. et al., 2002, ApJS, 142, 1
- Simard et al. (2011) Simard L., Mendel J. T., Patton D. R., Ellison S. L., McConnachie A. W., 2011, ApJS, 196, 11
- Strateva et al. (2001) Strateva I. et al., 2001, AJ122, 1861
- Tegmark et al. (2004) Tegmark M. et al., 2004, ApJ, 606, 702
- van Dokkum (2005) van Dokkum P. G., 2005, AJ130, 2647
- Wang et al. (2012) Wang J. et al., 2012, MNRAS, 423, 3486
- York et al. (2000) York D. G. et al., 2000, AJ, 120, 1579
- Zaritsky & Lo (1986) Zaritsky D., Lo K. Y. 1986, ApJ, 303, 66