Seismic signatures of magnetic activity in solar-type stars observed by Kepler
Abstract
The properties of the acoustic modes are sensitive to magnetic activity. The unprecedented long-term Kepler photometry, thus, allows stellar magnetic cycles to be studied through asteroseismology. We search for signatures of magnetic cycles in the seismic data of Kepler solar-type stars. We find evidence for periodic variations in the acoustic properties of about half of the 87 analysed stars. In these proceedings, we highlight the results obtained for two such stars, namely KIC 8006161 and KIC 5184732.
keywords:
stars: oscillations, stars: activity, methods: data analysis1 Introduction
As a result of the magnetic activity, the properties of the solar acoustic modes are observed to vary periodically. In particular, mode frequencies and amplitudes show a temporal anti-correlation, with frequencies increasing with increasing activity, while amplitudes decrease (e.g.,[Woodard, Woodard & Noyes 1985]; [Elsworth et al. (1990), Elsworth et al. 1990]; [Libbrecht et al. (1990), Libbrecht & Woodard 1990]; [Chaplin et al. (1998), Chaplin et al. 1998]; [Howe et al. (2015), Howe et al. 2015]). [García et al. (2010), García et al. (2010)] detected, for the first time, activity-related variations in the acoustic properties of a star other than the Sun: HD 49933 observed by CoRoT. Taking advantage of the long-term Kepler photometric time-series, temporal frequency shifts, possibly activity-related, have been measured for a number of solar-type stars ([Salabert et al. (2016), Salbert2018, Salabert et al. 2016, 2018]; [Régulo et al. (2016), Régulo et al. 2016]; [Kiefer et al. (2017), Kiefer et al. 2017]).
We have searched for temporal variations in the seismic properties of Kepler solar-type stars. To that end, we developed a Bayesian peak-bagging tool. In these proceedings, we summarize the methodology and highlight the results for two stars in the target sample.
2 Observational data
We analysed Kepler short-cadence data for 87 solar-type stars. The pixel data were collected from KASOC (Kepler Asteroseismic Science Operations Center) and corrected using the KASOC filter ([Handberg & Lund (2014), Handberg & Lund 2014]). The time series were then split in 90-day sub-series and, for each, the power density spectrum is obtained. For the photometric activity proxy, (e.g., [Mathur et al. (2014), Mathur et al. 2014]), we use KADACS (Kepler Asteroseismic Data Analysis and Calibration Software; [García et al. (2011), García et al. 2011]) long-cadence light curves.
3 Modelling of the power density spectrum
Stellar brightness varies on different timescales, due to the contribution from different phenomena, such as magnetic features, granulation, and stellar oscillations. We start by describing the background signal as the sum of three components: an exponential decay of active regions; a Harvey-like profile for granulation; and a constant photon shot-noise.
Having the background model, we proceed with the peak-bagging analysis and perform a global fit of the acoustic modes. For each mode, the power spectrum is modelled as a Lorentzian profile. The final set of free parameters is composed of the mode frequencies (where and denote the radial order and angular degree), the heights and linewidths of the radial modes, the rotational splitting, and the stellar inclination angle.
To finally obtain the mode parameters, we adopt a Bayesian approach. One of the advantages of a Bayesian approach is the possibility of using prior knowledge to constrain the parameters. Thus, in this work, the prior probability functions (namely for mode frequencies, rotational splitting, and inclination) are based on previous results from the analysis of the full, multi-year time-series ([Davies et al. (2015), Lund et al. (2017), Davies et al. 2016; Lund et al. 2017]).
The optimization method makes use of the algorithm emcee ([Foreman-Mackey et al. 2013]), based on the Affine Invariant Markov Chain Monte Carlo Ensemble sampler ([Goodman & Weare 2010]). From this analysis, we obtain the posterior distribution for each parameter and the corresponding parameter estimates.
4 Results and Discussion
Having the mode parameters, we then compute the mean temporal frequency shifts and mode heights. The individual frequency shifts, , are computed with respect to the reference frequencies (weighted averages of the mode frequencies, ). The final mean frequency shifts, , and uncertainties, , are obtained as
| (1) |
| (2) |
For the mode heights, we follow the same approach, but using logarithmic values.
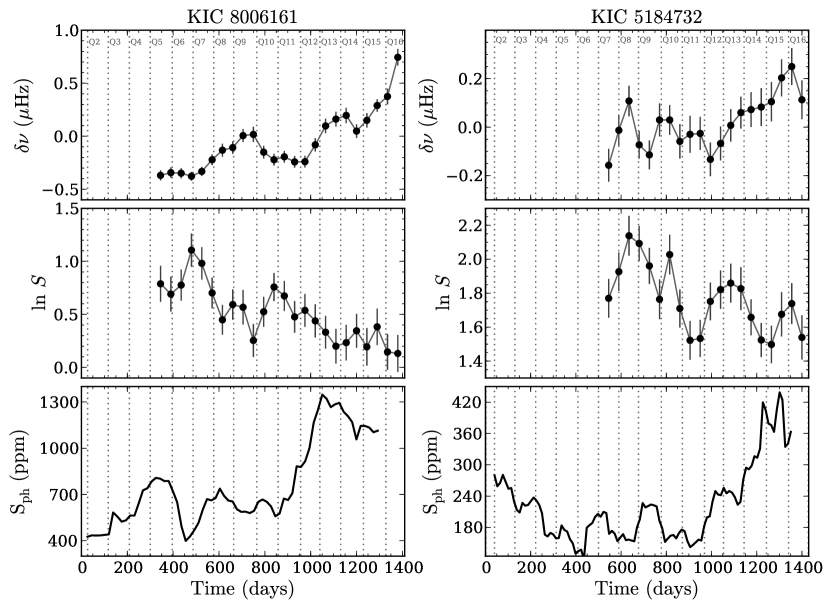
We perform the analysis, summarized above, for all 87 solar-type stars. In these proceedings, in Fig. 1, we present the results for the two stars KIC 8006161 and KIC 5184732. The seismic indicators (frequency shifts, , and logarithmic heights, ) are shown in the top two rows. For comparison, the bottom panels show the photometric activity proxy, , which is a measure of the stellar brightness variations due to the presence of spots on the stellar surface. Similarly to what is observed in the Sun, for both stars, the frequency shifts and mode heights vary in anti-phase, with the frequency shifts increasing with increasing . Therefore, our results are consistent with the rising phase of an activity cycle in both stars. further suggests that, over the time span of the Kepler observations, a given cycle ended and new cycle began in KIC 5184732. A detailed study of the enhanced activity and strong surface differential rotation of KIC 8006161 is presented in [Karoff et al. (2018)].
Over of the stars in the target sample show evidence for quasi-periodic variations in the frequency shifts. For part of those, the frequency shifts are accompanied by variations in other stellar properties, such as mode heights, granulation timescale, and/or photometric activity proxy. Further details will be provided in [Santos et al. (2018), Santos et al. (2018)].
Acknowledgements.
This work was supported by Fundação para a Ciência e a Tecnologia (FCT) through national funds (UID/FIS/04434/2013) and by FEDER through COMPETE2020 (POCI-01-0145-FEDER-007672). ARGS acknowledges the support from the IAU travel grant, from NASA grant NNX17AF27G, from the fellowship SFRH/BD/88032/2012 funded by FCT (Portugal) and POPH/FSE (EC), and from University of Birmingham. TLC acknowledges support from grant CIAAUP-12/2018-BPD. TLC, WJC, GRD, EY, and RH acknowledge the support from the UK Science and Technology Facilities Council (STFC). MSC acknowledges the support from FCT through the Investigador FCT Contract No. IF/00894/2012 and the fellowship SFRH/BD/88032/2012 and by FEDER through COMPETE2020 (POCI-01-0145- FEDER-007672). MNL acknowledges the support of The Danish Council for Independent Research — Natural Science (Grant DFF-4181-00415). Funding for the Stellar Astrophysics Centre (SAC) is provided by The Danish National Research Foundation (Grant agreement no.: DNRF106). RK acknowledges that the research leading to these results received funding from the European Research Council under the European Unions Seventh Framework Program (FP/2007-2013)/ERC Grant Agreement no. 307117. DS and RAG acknowledge the support from the CNES GOLF grant. The research leading to these results has received funding from EC, under FP7, through the grant agreement FP7-SPACE-2012-312844 (SPACEINN) and PIRSES-GA-2010-269194 (ASK). The peak-bagging was performed using the University of Birmingham’s BlueBEAR HPC service (http://www.birmingham.ac.uk/bear).References
- [Chaplin et al. (1998)] Chaplin, W. J., Elsworth, Y., Isaak, G. R., et al. 1998, MNRAS, 300, 1077
- [Davies et al. (2015)] Davies, G. R., Silva Aguirre, V., Bedding, T. R., et al. 2016, MNRAS, 456, 2183
- [Elsworth et al. (1990)] Elsworth, Y., Howe, R., Isaak, G. R., McLeod, C. P., & New, R. 1990, Nat., 345, 322
- [Foreman-Mackey et al. 2013] Foreman-Mackey, D., Hogg, D. W., Lang, D., & Goodman, J. 2013, PASP, 125, 306
- [García et al. (2010)] García, R. A., Mathur, S., Salabert, D., et al. 2010, Sci., 329, 1032
- [García et al. (2011)] García, R. A., Hekker, S., Stello, D., et al. 2011, MNRAS, 414, L6
- [Goodman & Weare 2010] Goodman, J., & Weare, J. 2010, Comm. App. Math. and Comp. Sci., 5, 65
- [Handberg & Lund (2014)] Handberg, R., & Lund, M. N. 2014, MNRAS, 445, 2698
- [Howe et al. (2015)] Howe, R., Davies, G. R., Chaplin, W. J., et al. 2015, MNRAS, 454, 4120
- [Karoff et al. (2018)] Karoff, C., Metcalfe, T. S., Santos, A. R. G., et al. 2018, ApJ, 852, 46
- [Kiefer et al. (2017)] Kiefer, R., Schad, A., Davies, G., & Roth, M. 2017, A&A, 598, A77
- [Libbrecht et al. (1990)] Libbrecht, K. G., & Woodard, M. F. 1990, Nat., 345, 779
- [Lund et al. (2017)] Lund, M. N., Silva Aguirre, V., Davies, G. R., et al. 2017, ApJ, 835, 172
- [Mathur et al. (2014)] Mathur, S., García, R. A., Ballot, J., et al. 2014, A&A, 562, A124
- [Régulo et al. (2016)] Régulo, C., García, R. A., & Ballot, J. 2016, A&A, 589, A103
- [Salabert et al. (2018)] Salabert, D., Régulo, C., Pérez Hernández, F., & García, R. A. 2018, A&A, 611, A84
- [Salabert et al. (2016)] Salabert, D., Régulo, C., García, R. A., et al. 2016, A&A, 589, A118
- [Santos et al. (2018)] Santos, A. R. G., Campante, T. L., Chaplin, W. J., Cunha, M. S., et al. 2018, arXiv:1806.00136
- [Woodard & Noyes (1985)] Woodard, M. F., & Noyes, R. W. 1985, Nat., 318, 449