The Local Group on FIRE: Dwarf galaxy populations across a suite of hydrodynamic simulations
Abstract
We present a new set of high-resolution hydrodynamic cosmological zoom-in simulations that apply the Feedback In Realistic Environments (FIRE) physics to both Local Group (LG)-like and isolated Milky Way (MW)-like volumes (ten host systems in total with baryonic particle mass ). We study the stellar mass functions, circular velocity or mass profiles, and velocity dispersions of the dwarf galaxy populations. The simulations reproduce the stellar mass function and central densities of MW satellite dwarfs for and predict the existence of unidentified galaxies with within of the MW. Overall, we find no evidence for the classical missing satellites or too-big-to-fail (TBTF) problems for satellite galaxies in our sample. Among the satellites, TBTF is resolved primarily by subhalo disruption and overall mass loss; central density profiles of subhalos are of secondary importance. For non-satellite galaxies, our LG-like simulations predict as many as as-of-yet unseen galaxies at distances from both hosts, with (in halos with ), albeit with large halo-to-halo variance. None of our simulations produces a compact, baryon-dominated, high-density dwarf elliptical-type galaxy (with at kpc), of which six may appear in the LG (but none in the MW). It may therefore remain a challenge to reproduce the full diversity of the dwarf population, including both the highest and lowest density systems.
keywords:
galaxies: dwarf – galaxies: Local Group – galaxies: formation – cosmology: theory1 Introduction
Our location within the Local Group (LG) affords it a unique importance in astronomy. It remains the only part of the Universe where we can detect tiny dwarf galaxies (stellar mass ), let alone use resolved stellar observations to study their internal properties and kinematics. As the most dark matter-dominated galaxies in the Universe (e.g. McConnachie, 2012), these dwarf galaxies provide crucial tests of the standard structure formation paradigm, cold dark matter with a cosmological constant (CDM), and may ultimately indirectly reveal the nature of DM itself (e.g. Ackermann et al., 2015).
While CDM reproduces large-scale observations extraordinarily well (e.g. Springel et al., 2005), explaining the dwarf galaxy population within the CDM framework has historically proven difficult (see Bullock & Boylan-Kolchin, 2017 for a recent review). Perhaps most famously, the “missing satellites” problem (MSP; Moore et al., 1999; Klypin et al., 1999) points out that dark matter-only (DMO) simulations of MW-mass hosts in CDM predict orders of magnitude more bound subhalos within than known luminous satellites of the MW. While the MSP is usually accounted for by a combination of photoionization during reionization (Bullock et al., 2000; Somerville, 2002), observational bias and incompleteness (e.g. Tollerud et al., 2008), and subhalo destruction due to the MW disk (D’Onghia et al., 2010; Sawala et al., 2017; Garrison-Kimmel et al., 2017b), these solutions typically resolve the disparity by placing the known MW satellites in the largest subhalos predicted around MW-mass hosts and leaving the smallest clumps undetected or entirely dark. This picture is further supported by the success of applying extrapolations of the abundance matching paradigm, which successfully reproduces large-scale clustering statistics by assuming a relatively tight relationship between halo mass and , to the LG environment (Garrison-Kimmel et al., 2014a).
However, the too-big-to-fail (TBTF) problem notes that the circular velocity profiles of the largest subhalos in DMO simulations of MW-mass galaxies (i.e. the subhalos assumed to host the luminous satellites) are incompatible with observational constraints on the MW dwarf satellites (Boylan-Kolchin et al., 2011, 2012). A similar discrepancy exists when comparing with the satellite galaxies of M31 (Tollerud et al., 2014) or the dwarf galaxies in the Local Field (defined here as within of the MW or M31, but more than from both; Garrison-Kimmel et al., 2014b), and TBTF even appears to exist beyond the LG entirely (Papastergis et al., 2015; Papastergis & Shankar, 2016): dwarf galaxies () have less mass within than DMO simulations of the halos expected to host those galaxies predict.
Recent simulations have begun to jointly resolve the MSP111The Auriga simulations (Grand et al., 2017), high-resolution magneto-hydrodynamic zoom-ins focusing on isolated MW-mass galaxies, also reproduce the MW/M31 satellite luminosity functions down to (Simpson et al., 2017), though to date there have been no analyses of the internal structure of those satellites. and TBTF by more realistically modeling gas cooling, star formation, and stellar/supernovae feedback. For example, Brooks & Zolotov (2014), using simulations from Zolotov et al. (2012), demonstrated a reduction in the peak circular velocity of the halos associated with TBTF due to a combination of supernovae feedback (modeled via the “blastwave” scheme of Stinson et al., 2006) and tidal disruption, such that their simulations were free of both TBTF and the MSP. More recently, Dutton et al. (2016) and Buck et al. (2018) showed that the NIHAO simulation suite, which also adopts the blastwave scheme, is similarly free of the MSP and TBTF.
The conclusion that TBTF and the MSP can be explained via baryonic physics, even using non-blastwave feedback implementations, is growing increasingly robust. The APOSTLE simulations (Fattahi et al., 2016; Sawala et al., 2016b), for example, apply the EAGLE models for galaxy formation, which are tuned to reproduce the stellar mass function and sizes of galaxies at (Crain et al., 2015; Schaye et al., 2015), to 12 LG-like volumes,222The APOSTLE simulations follow in the spiritual footsteps of the CLUES (Constrained Local UniversE Simulations) project (e.g. Gottloeber et al., 2010) in targeting LG-like pairs in hydrodynamic, cosmological zoom-in simulations. The CLUES simulations, however, constrain the environment around the targeted hosts to match that of the actual LG. demonstrating that extrapolations of models that match the statistics of larger galaxies can also duplicate the LG. The APOSTLE dwarf galaxy populations generally do not exhibit the MSP: the simulated volumes contain a similar number of galaxies with as the actual MW, M31, and LG. Moreover, the mass function of subhalos that host the luminous dwarf galaxies in APOSTLE (quantified by , the peak of the circular velocity curve) agree with the mass function implied by the Peñarrubia et al. (2008) estimates for the MW dwarf spheroidals (dSphs), implying that the APOSTLE hosts are also free of the TBTF problem.
In an alternative approach, Wetzel et al. (2016) used the Feedback In Realistic Environments (FIRE; Hopkins et al., 2014, 2017)333http://fire.northwestern.edu physics to simulate an isolated MW-mass galaxy with high enough resolution to capture the internal dynamics of the classical satellites. FIRE includes explicit models for star formation and stellar/supernovae feedback that self-consistently yield bursty star formation in dwarf galaxies (Muratov et al., 2015; Sparre et al., 2017; Faucher-Giguère, 2018; El-Badry et al., 2016) and overall agreement with a variety of galaxy-scale observables, including the star formation histories of dwarf galaxies (Oñorbe et al., 2015; Wetzel et al., 2016; Fitts et al., 2017); the mass–metallicity (Ma et al., 2016), stellar mass–halo mass (Hopkins et al., 2014, 2017), and stellar mass–star formation rate (Sparre et al., 2017) relationships; and the fraction of the stellar mass in the halos of MW-mass galaxies (Sanderson et al., 2017). Wetzel et al. (2016) showed that FIRE also yields a reasonable MW satellite population: the set of simulated dwarf galaxies falls roughly midway between that of the MW and M31 when counting galaxies either by or by the line-of-sight stellar velocity dispersion , the observable relevant to TBTF.
These works, however, have suffered from limitations. While the hosts in the APOSTLE simulations are carefully selected to match the LG environment, the majority of the APOSTLE results are drawn from their ‘L2’ simulations with baryonic particle masses , approaching the total mass of the smaller classical dwarf galaxies. In addition, the effective equation of state and the spatial/density resolution used in the APOSTLE simulations is such that the smallest resolvable Jeans/Toomre mass is ; therefore, clouds in lower mass galaxies cannot be self-consistently resolved. The simulations in Zolotov et al. (2012) and Buck et al. (2018) similarly have baryonic particle masses , with the highest resolutions reached at lower halo masses . Wetzel et al. (2016) reached higher resolutions and used a more physical subgrid model for star formation and feedback, but their results are based on a single simulation of an isolated host, rather than an LG-like environment.
Here we introduce the first in a set of simulations that apply the FIRE physics to LG-like volumes at state-of-the-art resolution. We present two simulated LG-like pairs (containing 4 MW-mass analogues), along with six isolated MW-mass galaxies for comparison. Our simulations generally reproduce the observed properties of dwarf galaxies in the LG: they do not suffer from either the missing satellites problem or TBTF when including baryonic physics.
This paper is organized as follows. In § 2, we describe the simulations and briefly review the star formation and feedback models. § 3 details our methods for compiling our observed and simulated galaxy catalogs. § 4 presents the stellar mass functions of our simulated hosts, counting both satellites and non-satellites. § 5 then examines the internal structure of our simulated dwarfs by comparing their central masses to those implied by observations via circular velocity curves. § 6 presents the relationships between stellar kinematics, stellar mass, and halo mass. We summarize our results and conclusions in § 7.
2 Simulations
| Host | , MW | ||||
|---|---|---|---|---|---|
| [kpc] | () | (DMO) | |||
| Paired hosts | |||||
| M31 | — | — | — | ||
| Milky Way | — | — | — | ||
| Romeo | 1.24 | 7.37 | 514 | 4 | 10 (7) |
| Juliet | 1.01 | 4.22 | 1196 | 0 | 15 (8) |
| Thelma | 1.32 | 7.92 | 1215 | 0 | 10 (6) |
| Louise | 1.03 | 2.86 | 894 | 0 | 8 (4) |
| Isolated hosts | |||||
| m12b | 1.31 | 9.42 | 728 | 0 | 9 (6) |
| m12c | 1.26 | 6.44 | 1247 | 0 | 14 (2) |
| m12f | 1.54 | 8.79 | 1110 | 0 | 8 (5) |
| m12i | 1.07 | 7.00 | 542 | 6 | 13 (9) |
| m12m | 1.45 | 12.62 | 671 | 3 | 15 (9) |
| m12z | 0.80 | 2.24 | 445 | 4 | 7 (5) |
We analyze hydrodynamic, cosmological zoom-in (Katz & White, 1993; Oñorbe et al., 2014) simulations, initialized with MUSIC (Hahn & Abel, 2011), from the FIRE project (Hopkins et al., 2014), run using the improved “FIRE-2” version of the code from Hopkins et al. (2017). All of the simulations were run using GIZMO (Hopkins, 2015),444http://www.tapir.caltech.edu/~phopkins/Site/GIZMO.html a multi-method gravity plus hydrodynamics code, in meshless finite-mass (“MFM”) mode. This is a mesh-free Lagrangian finite-volume Godunov method which automatically provides adaptive spatial resolution while maintaining conservation of mass, energy, and momentum (for extensive tests, see Hopkins 2015). Gravity is solved with an improved version of the Tree-PM solver from GADGET-3 (Springel, 2005), with fully-adaptive (and fully-conservative) gravitational force softenings for gas (so hydrodynamic and force softenings are always self-consistently matched), following Price & Monaghan (2007).
The FIRE physics and source code are nearly identical to those in previous FIRE-2 simulations, with the lone exception that all of our simulations additionally include subgrid turbulent metal diffusion, which produces more realistic metallicity distributions in dwarf galaxies (Escala et al., 2018) but does not alter other galaxy-wide properties (Hopkins, 2017; Su et al., 2017). The FIRE physics modules are described in detail in the papers above, but in brief, we treat radiative heating and cooling from K, allow for star formation only in gas that is dense ( cm-3), Jeans unstable, molecular and self-shielding (Krumholz & Gnedin, 2011), and self-gravitating (Hopkins et al., 2013). We then include stellar feedback via radiation pressure, Types Ia and II supernovae, metal mass loss, and photo-ionization and photo-electric heating, assuming every star particle represents a single stellar population with a Kroupa (2001) IMF.
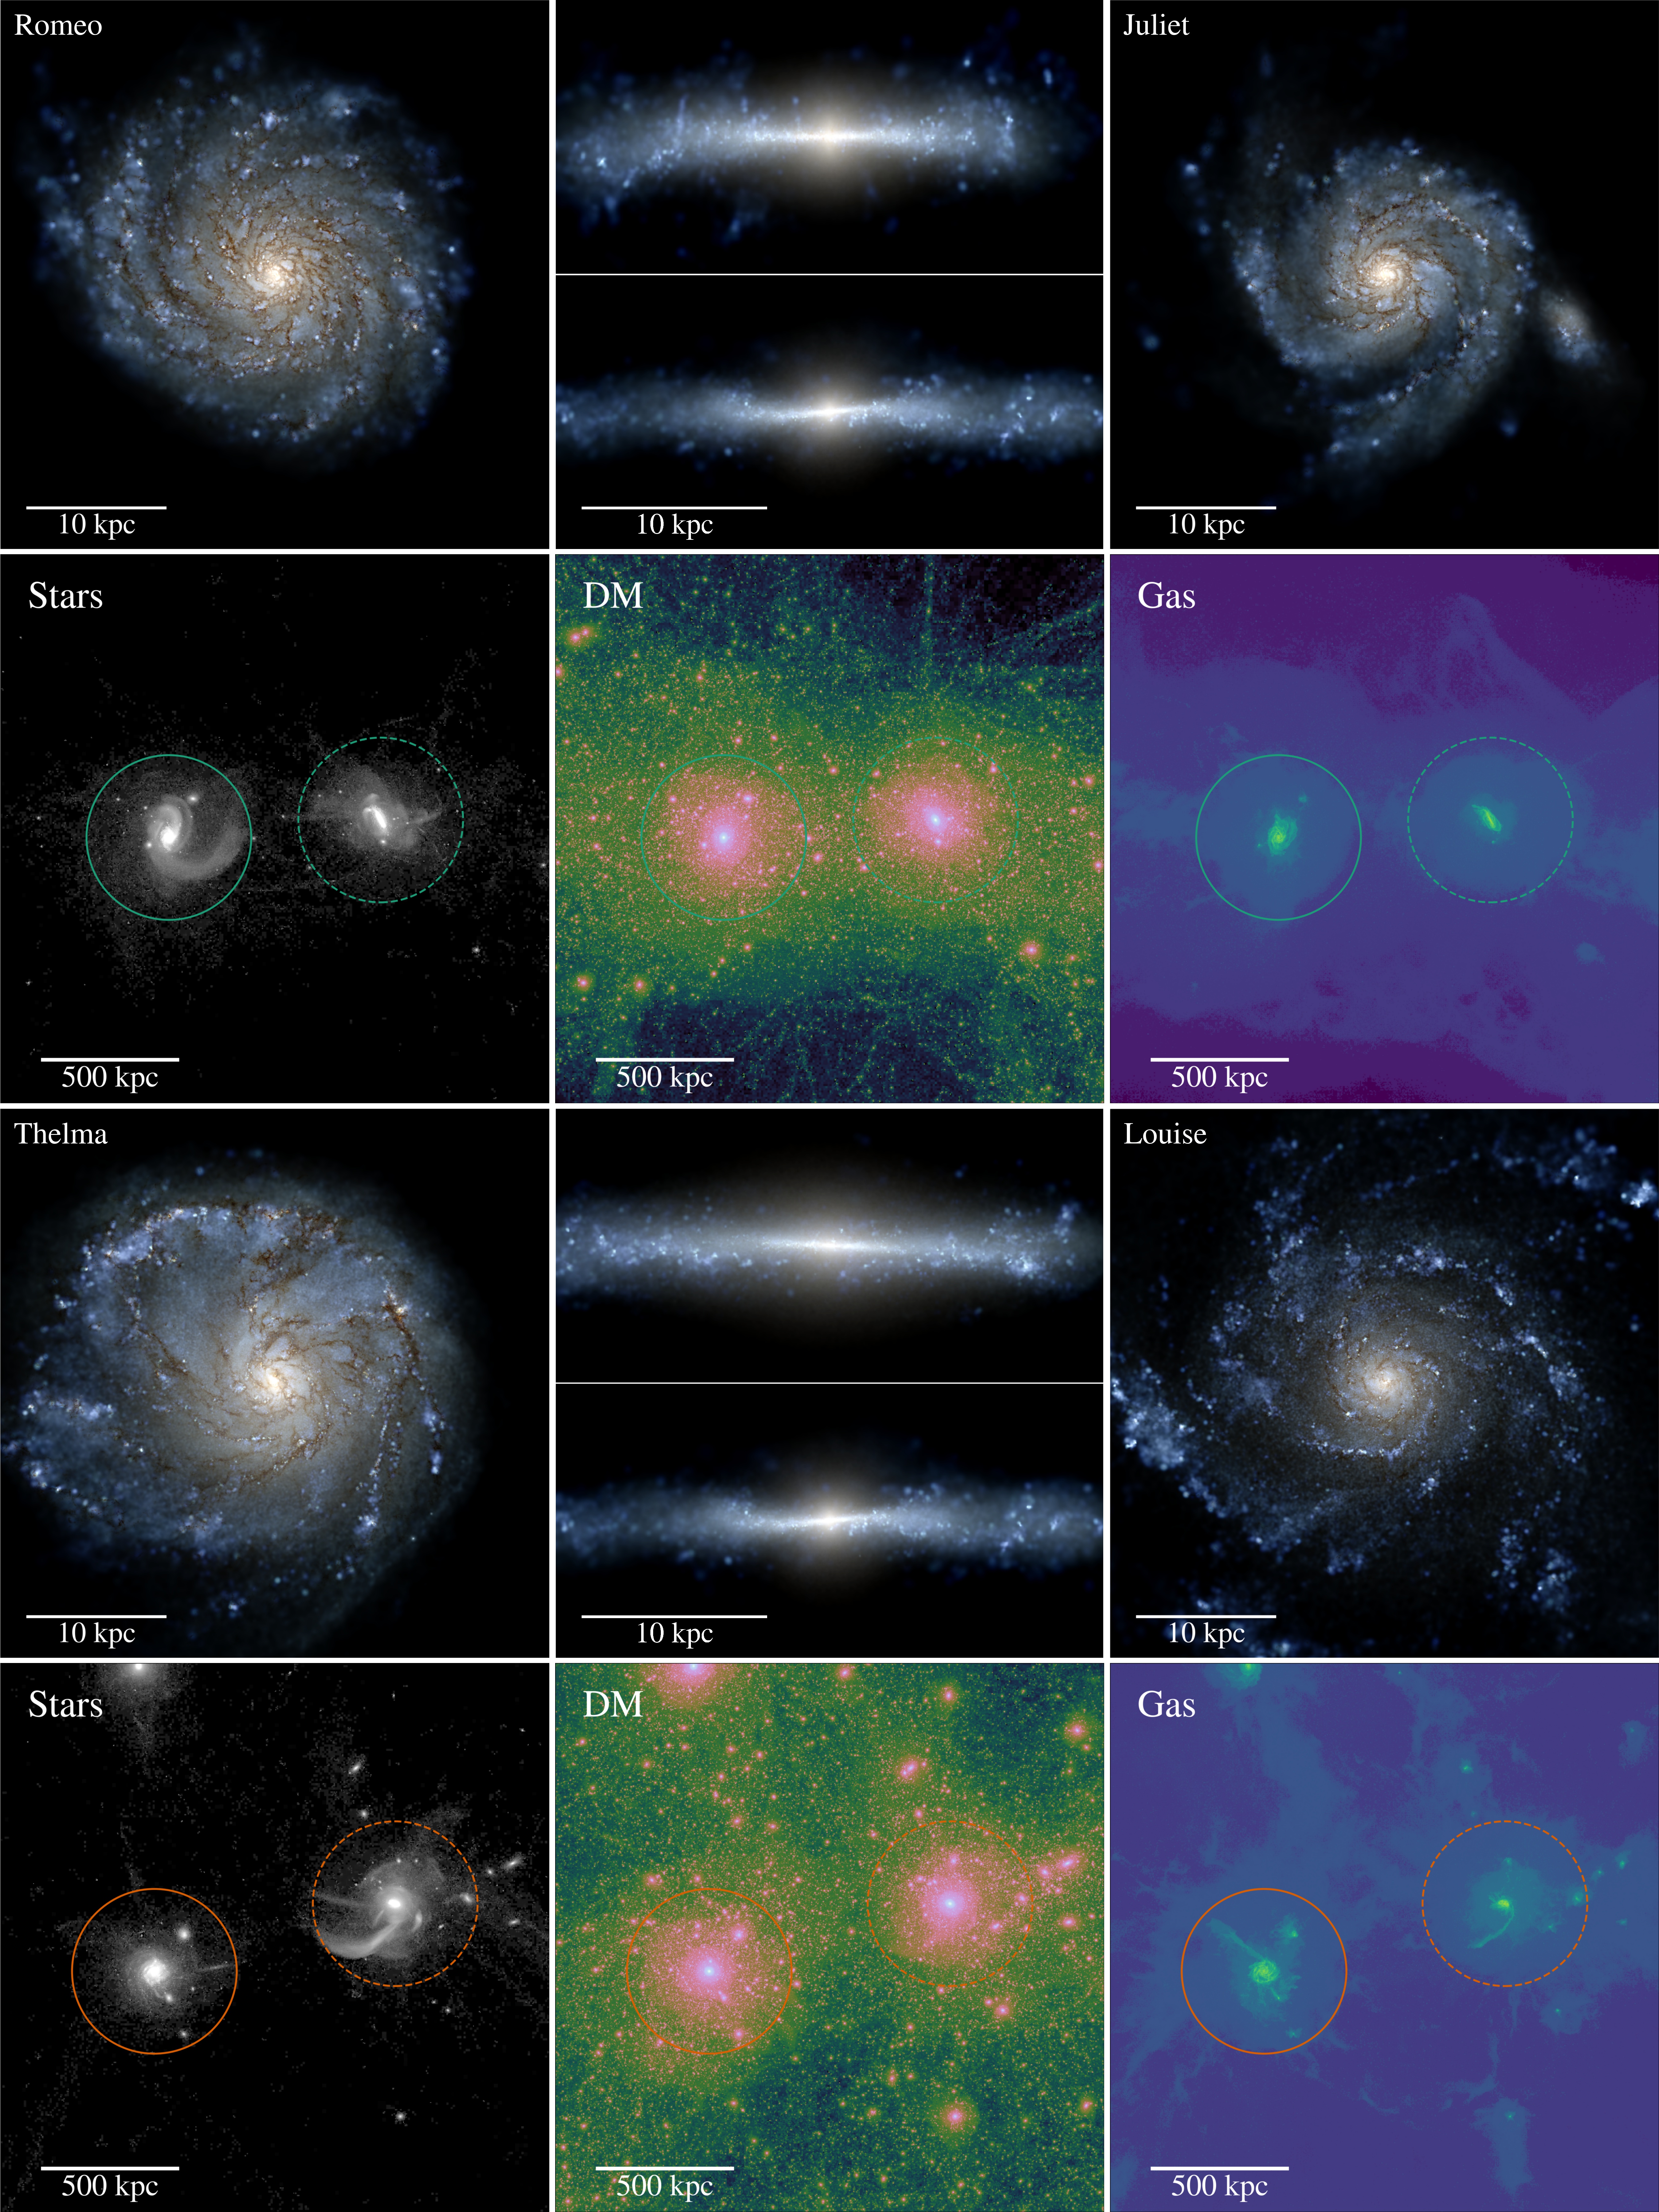
We focus on two pairs of LG-like hosts, Romeo & Juliet and Thelma & Louise, which are visualized at in Figure 1. We refer to these simulations (and additional ongoing work) as the “ELVIS on FIRE” set. The Thelma & Louise volume was first presented as a DMO simulation as part of the original Exploring the Local Volume In Simulations (ELVIS) suite (Garrison-Kimmel et al., 2014a). Both Thelma & Louise and Romeo & Juliet were also presented at lower resolution and without subgrid metal diffusion in Garrison-Kimmel et al. (2017a). We also include the results of six simulations targeting isolated MW-mass halos; all of these galaxies were also analyzed in Garrison-Kimmel et al. (2017a), but here we present higher resolution resimulations of m12b, m12c, and m12z that additionally include subgrid metal diffusion. m12b–m12m are part of the “Latte Suite,” a set of hosts homogeneously selected to be isolated and roughly the same mass as the MW: . m12i, in particular, uses the same initial conditions as the halo presented in Wetzel et al. (2016), originally taken from the AGORA project (Kim et al., 2014). The hosts in the Latte Suite were all simulated with identical resolutions: initial baryonic particle masses . Because the LG-like pairs were drawn from different box sizes and slightly different cosmologies,555All of our simulations assume flat CDM cosmologies with , , , and (e.g. Larson et al., 2011; Planck Collaboration et al., 2016). These slight differences in cosmology should have a negligible impact on the scale of the LG (e.g. Garrison-Kimmel et al., 2014c). they feature better resolutions (Romeo & Juliet has ; Thelma & Louise has ). Finally, m12z was also chosen from a separate parent box to be slightly lower mass, and is also at slightly higher resolution than the remainder of the isolated sample with . All simulations were run with gas softening lengths that are fully adaptive down to and DM force softenings .
The two central galaxies in Romeo & Juliet are separated by , are approaching one another with , and have a tangential velocity of . Thelma and Louise are separated by , have , and . For comparison, the MW and M31 are separated by (McConnachie et al., 2005) and are approaching one another with and (van der Marel et al., 2012, though see Salomon et al., 2016 and Carlesi et al., 2016). Both pairs were selected for these high resolution simulations on the basis of their low tangential velocities and relative lack of (partial) overlap in their Lagrange volumes with other massive halos outside the LG. We do not constrain or restrict the larger-scale density fields around the LG hosts; i.e. we do not necessarily expect to reproduce the -scale “Local Sheet” (McCall, 2014). Table 1 presents additional information about the individual hosts, including the distance to the nearest low-resolution particle and the number of halos within excluded from our analysis due to contamination from these particles.
3 Galaxy catalogs
In this section, we briefly discuss the observational sources we use for the properties of dwarf galaxies in the LG, along with our method for extracting the equivalent properties for dwarf galaxies from the simulations.
3.1 Observations
We build our observational sample primarily off the data compiled in an updated version of the McConnachie (2012) catalog of local dwarf galaxies. We exclude all “starred” systems in the catalog, for which debate remains about their true nature (i.e. galaxy vs. globular cluster); the majority of these are much less massive than our resolution. We take stellar mass-to-light ratios from Woo et al. (2008) where available, and otherwise assume (consistent with Martin et al., 2008b and extrapolations of Bell & de Jong, 2001). We calculate , the implied circular velocity at the 3D (deprojected) half-light radius, for the majority of our galaxies with the Wolf et al. (2010) formula, i.e. based on the velocity dispersion of the stars. For the MW dSphs, we use the velocity dispersions presented in Wolf et al. (2010). For the satellites of M31, we take and from Tollerud et al. (2014). The majority of these are based on stellar velocity dispersions, but there are a few exceptions. Most notably, the constraint on M33 only represents the mass of the dark matter halo, taken from a fit to CO and HI observations (Simon et al., 2006, using data from Corbelli & Salucci, 2000 and Corbelli, 2003); including the baryonic component roughly doubles . We adopt the total mass estimates (i.e. including baryons) for the remaining M31 satellites, including those that are baryon dominated within . For NGC 185 and NGC 147, these are based upon the dynamical modeling of Geha et al. (2010), while the constraint on IC 10 is derived from HI observations (Wilcots & Miller, 1998). Finally, for the Local Field, we adopt the values (, , and ) calculated or compiled in Kirby et al. (2014) where possible, though we adopt the modified values presented in Garrison-Kimmel et al. (2014b) for the three galaxies that display evidence of rotation: for the dwarf galaxy WLM, we use the result calculated in detail by Leaman et al. (2012), while we use the method of Weiner et al. (2006, and also see , ) to incorporate rotational support into our estimates for Pegasus and Tucana. For all other systems, we fall back on the measurements in McConnachie (2012). We list the properties of the full sample in Appendix A.
3.2 Simulations
Because publicly-available halo finders are typically tuned to capture DM (sub)halos, we find unsatisfactory performance when attempting to capture the much more compact stellar clumps (particularly when those clumps are embedded within the stellar halo of a larger host; see Figure 1). We therefore compile our simulated galaxy catalogs via a multi-step process. We first identify bound DM halos by running AHF (Knollmann & Knebe, 2011) only on the DM particles. We then assign star particles in a first pass to DM clumps via a generous cut on stellar positions and velocities along the direction of motion of the (sub)halo. In a second pass, stars are iteratively removed based on their velocities relative to the velocity dispersion of the system until the latter stabilizes. We then examine each galaxy by hand and repeat the final step with a small maximum radius if necessary. Finally, we iteratively compute stellar velocity dispersions independently along the , , and axes, eliminating stars offset by more than from the mean until the dispersion along each axis changes by less than ; this step typically alters particle counts at the percent level. However, this step is important for velocity dispersions because contamination by even a single background halo star, with high relative velocity to the satellite, can significantly bias properties such as the radius or velocity dispersion of the satellites. We define as the sum of the masses of all the star particles that remain assigned to each galaxy in this way and as the RMS average of the , , and , velocity dispersions of those particles (calculated via the interquartile spacing). Finally, we recompute and , the radius at which occurs, using all particles around each host; this step is unimportant for low mass galaxies, but matters in the higher stellar mass dwarfs where the star particles are a non-negligible fraction of the mass within .666In cases where the circular velocity curve has no peak/turnover, we instead adopt the inflection point of the curve, i.e. the radius/circular velocity where the curve becomes convex due to the contribution from a background host halo, as and . We compute all properties and profiles relative to a halo/galaxy center defined using a “shrinking spheres” approach on the stars (Power et al., 2003). Though there is no explicit requirement at any step that star particles assigned to a given galaxy be bound to the associated halo, our final velocity distributions suggest this is typically the case.
Our approach is similar to Wetzel et al. (2016), but we base our galaxy catalogs on AHF halo catalogs (rather than rockstar; Behroozi et al., 2013) and the cuts placed on stellar particles vary slightly; most notably, Wetzel et al. (2016) did not include either our initial cut based on the motion along the direction of the subhalo or our final cut while computing velocity dispersions. Moreover, we quote total line-of-sight velocity dispersions, whereas Wetzel et al. (2016) computed total velocity dispersions at the half-mass radius. Our results are similar: for example, we find an identical number of galaxies with when applying our method to m12i as Wetzel et al. (2016) identify in the same halo (simulated without metal diffusion).
In the figures that follow, we plot stellar mass functions down to , corresponding to approximately 10 star particles in the lower resolution Latte simulations. While the existence and stellar masses of galaxies above this cut is robust, the internal properties, such as density or velocity dispersion, are more sensitive to resolution and may change with higher resolution simulations (Hopkins et al., 2017). We therefore adopt a slightly higher cut, , corresponding to star particles, when quoting galaxy counts or investigating internal structure.
4 Stellar mass functions
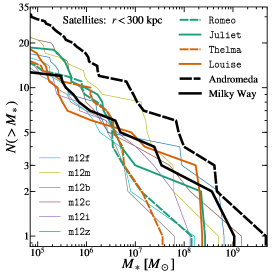
Figure 2 presents the stellar mass functions (SMFs) of dwarf galaxies throughout the Local Volume. As expected from Garrison-Kimmel et al. (2014a), the satellite SMFs (host distance ) of the isolated and paired halos overlap well. Our ten hosts contain between and satellites with , with a 66% scatter of galaxies. For comparison, the scatter in the number of subhalos around the DMO ELVIS hosts (Garrison-Kimmel et al., 2014a) above an equivalent peak halo mass (using the zero-scatter stellar mass vs. peak halo mass relationship from that work) is . However, the host masses from ELVIS also vary more widely than the sample presented here: the DMO ELVIS host masses have a 66% scatter of , while that of our sample is only . Naively scaling the two values by one another (i.e. scatter in scatter in host ) yields nearly identical values, such that our results are consistent with the FIRE simulations predicting the same degree of scatter in the number of luminous satellites as DMO simulations.
The FIRE satellite populations also provide a good match to the MW satellite SMF, particularly below the masses of the LMC and SMC,777The worse agreement at the high-mass end is not particularly unexpected: none of our hosts were selected to contain an LMC-mass satellite, and a randomly selected MW/M31-mass halo is statistically unlikely to have LMC or M33-mass satellites (Busha et al., 2011; Tollerud et al., 2011). though the agreement is not perfect: the simulated galaxies host a median of satellites with , compared with the such known MW satellites, and we typically predict a SMF that continues to rise between the relatively bright classical dSphs () and the ultra-faints dwarfs () identified in deep surveys such as SEGUE (Belokurov et al., 2009) and DES (Drlica-Wagner et al., 2015). The difference is small relative to the order-of-magnitude difference referred to by the missing satellites problem – we predict a median of 4 satellites with – but it may suggest additional, relatively luminous, undetected satellites (also see Tollerud et al., 2008). Rather than a sign of observational incompleteness, the flattening of the MW SMF may instead reflect a feature from reionization (see Bose et al., 2018); if so, our simulations do not capture such a feature overall.
In contrast to the relative agreement with the MW SMF, all of the simulated satellite SMFs lie slightly below that of M31. Our hosts have, on average, as many satellites with as are already known around M31. The offset in the mean counts relative to M31 is roughly constant for (at which point the mean difference becomes even larger), indicating that M31 contains systematically more satellites at fixed stellar mass than our simulated hosts. For comparison, the mean offset between the simulated satellite populations and that of the MW is at the mass of CVnI () and remains under over two orders of magnitude (up to the mass of Fornax, ). The difference in satellite counts is clear, but not extreme: our host with the largest number of satellites (m12m, with ) contains as many galaxies above with an average of from – . As we show in Appendix B, this result is only marginally sensitive to the radial cut used to separate satellites from non-satellites. It is also qualitatively independent of the assumed mass-to-light ratio for the observed dwarf galaxies: even adopting a stellar mass-to-light ratio of unity for the galaxies not included in Woo et al. (2008) yields a mean of as many satellites as M31 with .
The abundance of dwarf galaxies around M31 (relative both to the MW and to our simulated hosts) may point towards a higher M31 halo mass. Large-scale estimates for the mass of M31 typically suggest ; for example, Diaz et al. 2014 used the net momentum of the LG to estimate . However, Kafle et al. (2018) recently argued for by applying a Bayesian framework to high-velocity planetary nebulae. Figure 3 shows the number of dwarf galaxies near each host, as a function of host virial mass. Though the trends with mass are weak (e.g. our lowest mass host contains the fifth most satellites), our results suggest that it is difficult to match both the SMF of the MW and of M31 without a higher virial mass for M31.

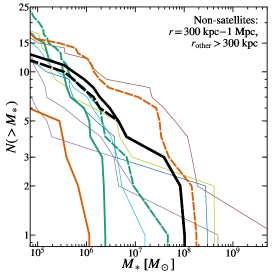
Broadly speaking, the non-satellite SMFs in Figure 2 (, and excluding satellites of the paired host if applicable) generally agree with counts in the fields around the MW/M31. However, there are again hints of undetected galaxies with : we predict a median of galaxies with , compared to the known around the MW. Furthermore, increasing the mass of our M31 analogue may result in even more predicted dwarfs; our predictions in the Local Field may be a lower limit. If ultra-diffuse galaxies (UDGs) are prevalent in the field (as predicted by Di Cintio et al., 2017 and Chan et al., 2017), with central surface brightnesses (van Dokkum et al., 2015), then some of this incompleteness may even arise at . Surprisingly (as Garrison-Kimmel et al., 2014a predict more halos above fixed in DMO halo counts), there is no clear offset in the Local Field SMFs between the isolated and paired hosts, though all of the latter except Louise are on the upper edge of the distribution. However, our statistics remain relatively small, and we require a larger, mass-selected sample to make strong statements regarding the efficiency of galaxy formation in dwarfs within of an LG-like pair vs. an isolated MW-mass galaxy. We caution that the lines representing Romeo and Juliet (Thelma and Louise) are not completely independent, with the volumes probed overlapping by 42% (37%).
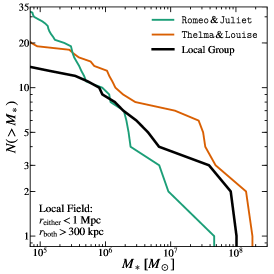
Finally, the right panel of Figure 2 plots the SMF of the “Local Field” (all non-satellite galaxies within of either of the hosts). The observed Local Field SMF lies roughly in between our two simulated LGs for . Consistent with the center panel, some amount of observational incompleteness is possible, and perhaps even likely, but more simulations are required: both the real Local Field and Thelma & Louise contain 5 non-satellite galaxies with , while Romeo & Juliet contains 19. Thelma & Louise, however, does overproduce the observed SMF at all masses, predicting a total of 18 galaxies with compared to the only 13 known in the LG. However the comparison with the field around our larger sample of isolated hosts clearly demonstrates very large systematic halo-to-halo variations in this prediction.
In Appendix B we consider the effects of a slightly larger (kpc) radial cut used to assign satellites their hosts, and show this does not qualitatively alter our conclusions above. However, it somewhat decreases the tension with both M31 and the Local Field by re-assigning a few galaxies from the field to the M31-analogue.
5 Too-big-to-fail (TBTF)
Due to the resolution required to study the inner of simulated dwarf subhalos, TBTF was originally defined using DMO simulations. Boylan-Kolchin et al. (2011) therefore focused on the dSph satellites of the MW. Because dSphs are dispersion supported, a measurement of provides a robust estimate of . Moreover, the high dynamical mass-to-light ratios implied by suggest that dSphs are strongly DM-dominated, indicating that the estimates on may be fairly compared to the subhalo masses provided by DMO simulations. Later work on TBTF that expanded beyond the MW satellites (e.g. Garrison-Kimmel et al., 2014b; Tollerud et al., 2014) typically sought to recast observational measurements for non-dispersion supported systems into similar constraints on , and either excluded or treated separately galaxies with significant baryonic mass within (for which is not fairly comparable to the results of DMO simulations).
Approaches to TBTF using baryonic simulations have varied. For example, Sawala et al. (2016b) showed that the number of luminous subhalos in the APOSTLE simulations above a given agree with estimates for the MW satellite population from Peñarrubia et al. (2008). They then obtain separate estimates for the MW satellites by matching them with dwarf galaxies in their simulations based on , , and ; the relationship implied by these estimates is in good agreement with the simulated relationship. Wetzel et al. (2016), conversely, sought to compare directly with the data: they showed good agreement between the dwarf satellites of m12i and those of the MW/M31 when counting galaxies by stellar velocity dispersion and when viewed in velocity dispersion – stellar mass space.
Here, we adopt a hybrid approach. We first demonstrate that the DMO simulations of our host halos suffer from TBTF by reproducing the Garrison-Kimmel et al. (2014b) analysis on the DMO simulations, then show that the same analysis applied to the luminous dwarf galaxies in the FIRE simulations yields no such discrepancy. Because direct comparisons with data are ideal, we will demonstrate in § 6 that the simulated dwarfs also broadly reproduce the observed relationship between stellar mass and stellar velocity dispersion. However, because we will compare our simulated dwarfs to non-satellite galaxies and to more massive systems, for which the assumption of dispersion-dominated kinematics is not well-motivated, we begin by inspecting the central masses of our simulated systems and their observational counterparts.
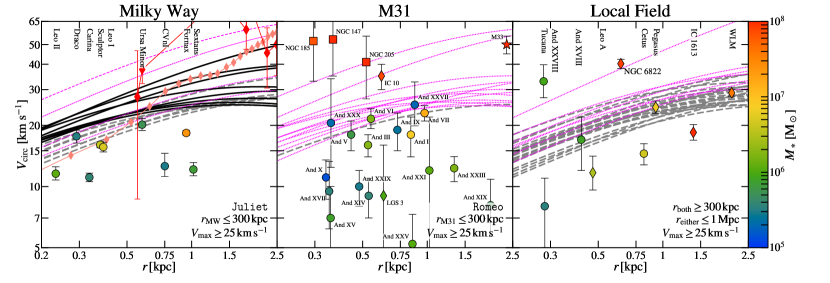
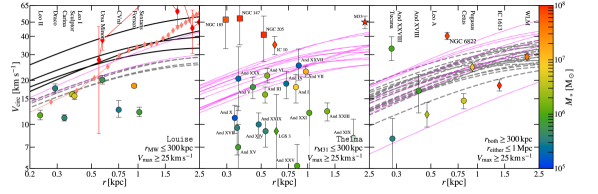
We therefore begin by generally replicating the analyses of Boylan-Kolchin et al. (2012); Tollerud et al. (2012), and Garrison-Kimmel et al. (2014b), who identified problematic (sub)halos by comparing the circular velocity curves of simulated systems with constraints on observed dwarf galaxies. Before presenting the results of this analysis, we first describe our methods for calculating the rotation curves in the DMO and hydrodynamic simulations, then briefly review the galaxies included on each plot, and finally summarize our nomenclature and methods for identifying and counting the problematic (sub)halos.
5.1 Methods
5.1.1 Calculating circular velocity curves
For the DMO simulations, we follow previous TBTF analyses in computing circular velocity curves for the (sub)halos by normalizing a fixed density profile to the large-scale properties of each system. We assume NFW (Navarro et al., 1996) profiles for the DMO systems, scaled to and of each halo, but, as we discuss in § 5.4, this has a second-order effect on our conclusions – adopting the raw particle data from the DMO simulations and ignoring the impact of gravitational softening does not alter our conclusions.
Meanwhile, for the hydrodynamic simulations, we follow Boylan-Kolchin et al. (2012) in fitting density profiles (here taken to be the model; e.g. Jaffe, 1983; Hernquist, 1990; Merritt et al., 2006 or Di Cintio et al., 2014b) to the resolved portion of each halo, then extrapolating the fits inward to compute . Based on § 4.1.4 of Hopkins et al. (2017), who argued that the usual Power et al. (2003) relaxation time criterion is equivalent to a limit on the number of enclosed particles, we take (the minimum radius used in fitting the density and the radius within which we adopt the extrapolated ) as the radius containing 300 DM particles; we adopt an outer radius for the fit of . Appendix C directly examines the (minimal) impact of varying , and compares from the extrapolated fits to the raw data and to NFW profiles. Importantly, as with the DMO simulations, we show in § 5.4 that the shape of the central profile has only a marginal impact on the number of massive failures that we identify in the hydrodynamic simulations, even among non-satellite galaxies.
5.1.2 Selecting galaxies and halos
We separately analyze satellites of the MW, satellites of M31, and galaxies in the Local Field, where satellites are again defined as galaxies within of each host. We include every galaxy that meets each distance cut and has velocity information that is representative of the mass of the galaxy. This breaks slightly from the analyses of Boylan-Kolchin et al. (2011, 2012) and Garrison-Kimmel et al. (2014b), who eliminated the LMC, the SMC, and NGC 6822 for various reasons. In contrast, we eliminate only the Sagittarius dSph. Because Sagittarius is in the process of tidally disrupting, stellar kinematics do not necessarily probe the underlying dynamical mass. Consequently, we may identify a single subhalo as a “massive failure” (defined in detail in §5.1.3) that could be associated with Sagittarius, increasing our counts below by one. We generally adopt the constraints at (, ) detailed in § 3.1, but the wealth of data on the Magellanic Clouds allows us to plot rotation curves for those systems. Specifically, we adopt the HI-based rotation curve for the SMC from Stanimirović et al. (2004) and the proper motion-based rotation curve for the LMC from van der Marel & Kallivayalil (2014). Finally, we note that M32 lies outside the limits of the central panel (in the upper left, at , ), and Leo T lies outside the limits of the right panel (at , ). Though these points are not shown on the axes, they are included when identifying massive failures.
For the DMO simulations, we seek to reproduce the cuts adopted by previous TBTF analyses. However, because we lack evolutionary histories for our (sub)halos, we select on present day instead of adopting the cut used in, e.g. Garrison-Kimmel et al. (2014b). Based on Figure 1 of Boylan-Kolchin et al. (2012) and the results of Garrison-Kimmel et al. (2014b), we consider (sub)halos with . For satellites, this cut is typically more conservative than the criteria of Garrison-Kimmel et al. (2014b) as many subhalos that reached can be stripped to today (e.g. Sawala et al., 2016a). In principle, however, we may include some systems (particularly in the Local Field) that only recently reached their present day mass, and which may therefore be expected to remain “dark” (e.g. Fitts et al., 2017). However, as we will show below, there are enough systems with in the field that this is unlikely to change our conclusions.888Our results with respect to the DMO simulations are insensitive to these cuts. For example, we find qualitatively identical results if we select potential massive failures by their circular velocity at fixed radius, rather than by . Specifically, selecting the twelve subhalos with the largest circular velocities at , rather than all subhalos with , still yields at least one, and typically , satellites with profiles that are incompatible with all of the MW dSphs (i.e., massive failures).
For the hydrodynamic simulations, we opt to reproduce the cuts placed on the observed galaxies. That is, we select galaxies based on , rather than .999Note, however, that we do assign galaxies to host the LMC and SMC based on their , rather than , which is a more stringent cut (see Figure 6). We select all luminous galaxies with . As we show explicitly in § 6, this cut is less restrictive than a -based cut: it includes many halos with , and only excludes three with . Based on Figure 2, this is a conservative estimate for a stellar mass-based cut: the simulations all match or slightly exceed the MW SMF at . The same is true in the Local Field: while observational completeness in the Local Field is poorly defined, Figure 2 shows that there are likely undetected galaxies at .
5.1.3 Identifying massive failures
We adopt the nomenclature of Garrison-Kimmel et al. (2014b) in defining “strong massive failures” and “massive failures” separately. Around the MW, the former are subhalos that are too dense to host any of the MW dSphs, while the latter have rotation curves consistent with either Draco or Ursa Minor (or both), but cannot be associated with those galaxies because they have already been assigned to other subhalos. In other words, strong massive failures have circular velocity curves that lie above all of the MW dSphs, while massive failures are “leftover” systems that are otherwise consistent with either Draco or Ursa Minor, but that are kinematically incompatible with the remainder of the MW dSphs.
Due to the wide variability in the internal structures of dwarfs around M31 and in the Local Field, we opt to apply the same nomenclature to those volumes but insist that every galaxy be associated with a single halo (rather than just Draco and Ursa Minor). In practice, we therefore identify massive, unaccounted-for halos. As demonstrated by Garrison-Kimmel et al. (2014b), applying a stellar mass vs. halo mass relationship that reproduces counts in the Local Group (when applied to DMO simulations) to these unaccounted-for halos assigns them . Therefore, the massive failures we identify around M31 and in the Local Field would be nominally expected to host bright galaxies.
5.2 Results: dark matter-only simulations
Figure 4 presents the results of performing these analyses on the DMO simulations. We compare the satellites of the lower (higher) mass host in each pair to those of the MW (M31) in the left (central) panel, and show the Local Field population in the right panel. Strong massive failures (which only exist in comparison with the MW satellites) are plotted as black lines, while massive failures are indicated by the dashed grey lines. These latter set are massive, dense (sub)halos that we nominally expect to form stars, yet which lack an observational counterpart. Halos assigned to host a galaxy (which are not counted as massive failures) are indicated by magenta lines. Juliet contains analogues for both the LMC and SMC; these subhalos are indicated in the long and short dashed magenta lines, respectively.
As expected, we identify several (strong) massive failures in the left panel. However, our analysis identifies only one massive failure when comparing Romeo to the M31 satellite population, and none among the satellites of Thelma, though our analysis places several galaxies in subhalos that are likely not massive enough to host them. As a glaring example, none of the satellites of Thelma have , but four are assigned to host M33, M32, NGC 205, and NGC 147, all of which have . Moreover, our criteria identifies massive failures (relative to the M31 satellites) in Juliet (7) and in several of the isolated hosts: m12c contains 6, m12i contains 3, and m12m contains 7. We also remind the reader that the hydrodynamic versions of these halos underproduce the SMFs; if this is due to the masses of our hosts, then we would expect to also underproduce the halo mass function, which scales closely with host mass (e.g. Boylan-Kolchin et al., 2010). Finally, both pairs contain a glut of unaccounted for, massive halos in their Local Field populations. Moreover, in both pairs, at least two of those leftover halos are too dense to be associated with any of the known galaxies other than Tucana or NGC 6822.
We emphasize that all of our DMO hosts suffer from TBTF (as formulated by Garrison-Kimmel et al., 2014b) when comparing their satellite populations with the satellites of the MW. Though we only directly plot Juliet and Louise against the MW satellites, we list the number of massive failures (and, in parentheses, strong massive failures) in the final column of Table 1: in the DMO simulations, all of our hosts contain at least two strong massive failures.
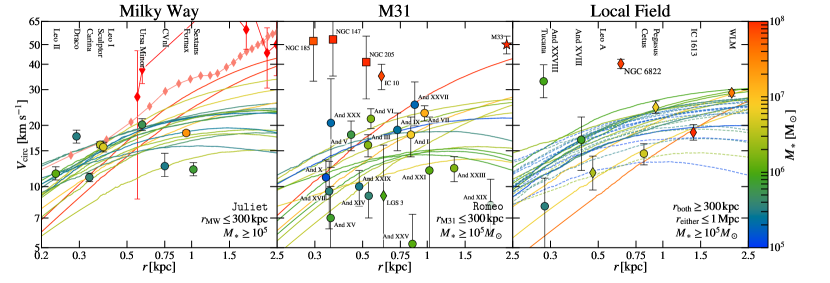
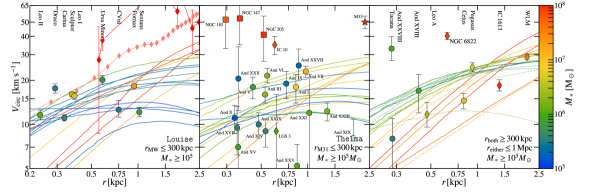
5.3 Results: FIRE simulations
Figure 5 is analogous to Figure 4, but it plots curves of the luminous galaxies in the FIRE simulations (i.e. including baryons). Because we color the lines by stellar mass, we separate massive failures and halos that are matched with observed dwarfs via line-style: massive failures are plotted with dashed lines and the halos assigned to host galaxies with solid lines. The addition of baryonic physics to the simulations eliminates the TBTF problem around the MW and M31. In particular there are neither ‘strong massive failures’ nor ‘massive failures’ within the virial radius of either host according to the definitions applied to the DMO simulations above. While the M31 population looks good in comparison to the TBTF problem, our hosts do not contain quite as many satellites as M31 overall: matching the stellar mass function may result in additional galaxies that cannot be matched one-to-one with observed systems.
There do remain a number of “failures,” according to our formal definition in the Local Field population (dotted lines), all with stellar masses . However, we emphasize their circular velocities are still much lower than in the DMO simulations; in fact, they have profiles quite similar to the typical observed systems in both the MW, M31, and Local Field. Given that the completeness of the Local Field out to Mpc at these masses is rather uncertain, one possibility is that there is a population of undetected dwarf galaxies in this region, with stellar masses and dark matter densities similar to those of known dwarf galaxies (e.g. And XVIII).101010Specifically, there are 17 (7) of these missing systems in the Local Field of Romeo & Juliet (Thelma & Louise) with and 7 (6) with . However, we also note that this tension, like that in the Local Field stellar mass function, can be reduced (decreasing the number of discrepant halos by a few), without introducing significant tension in the comparison with TBTF around M31, if we use a larger radial cut as in Appendix B to associate galaxies with M31 and the MW.
Note that the relative impact of supernovae feedback is such that more massive dwarfs () almost universally have lower central masses than their less luminous counterparts (), particularly in the Local Field. Measuring dynamical masses within across a range of stellar masses (e.g. with thirty meter-class telescopes) will test this prediction.
Aside from the the Local Field, our hydrodynamic simulations are free of TBTF: all of the simulated dwarf satellites are consistent with even the lower density MW dSphs and the satellites of M31. As we will show more quantitatively in § 6, the stellar kinematics of the simulated galaxies are also in line with those of dwarfs throughout the LG.
The agreement between the central masses of the simulated and observed galaxies is not perfect, however: the satellite populations do not contain any systems quite as dense as NGC 205, NGC 147, NGC 185, or IC 10.111111They also do not contain any as dense as M32, but the high density of M32 may be at least partially explained by a nuclear supermassive black hole (van der Marel & van den Bosch, 1998), which we do not model in these simulations. This result holds across our entire sample: none of our hosts have satellites (or field galaxies) that reach even the lower error on NGC 205, the least dense of the dEs. Though this may be due to a lack of high mass dwarf galaxies, the trend is typically in the opposite direction, such that our high mass dwarf galaxies have relatively low at . An examination of Figure 6 of Sawala et al. (2016b) and Figure 3 of Dutton et al. (2016) suggests that the APOSTLE and NIHAO simulations, respectively, may also lack analogues of the high density M31 satellites (halos with at ). These high density galaxies may represent a manifestation of the “diversity problem” (Oman et al., 2015; Creasey et al., 2017) in the LG.
Producing such high density galaxies, with , may prove to be an important test of galaxy formation physics. In particular, while abundance matching arguments suggest that these galaxies are at the centers of halos that reached (Garrison-Kimmel et al., 2014a), previous work has shown that mass scale to be the most susceptible to core formation and stellar migration due to supernovae feedback (Di Cintio et al., 2014b; Chan et al., 2015; El-Badry et al., 2016). Some of these could be the stripped cores of previously more massive galaxies: for example, McConnachie et al. (2004) identified a stream that is likely originating from NGC 205. However, they estimate the total mass in that stream to be only of the mass of NGC 205. Moreover, this option is unlikely for at least IC 10, which is gas rich and star forming today. Furthermore, the galaxies in the LG that are more massive than this sample, the LMC and M33, lack these high density central clumps. An additional, constant source of feedback (e.g. cosmic rays; Jubelgas et al., 2008) that acts to smooth out the burstiness in the star formation, leading to less-violent feedback episodes, may be required to explain these objects. For a more detailed discussion of the structure of isolated galaxies at this mass scale in the FIRE-2 simulations, we refer the reader to Chan et al. (2017), who studied the evolution of the stellar effective radius; El-Badry et al. (2017a), who explored the gas morphologies as a function of galaxy mass; and El-Badry et al. (2018), who showed that galaxies are, on average, overly dispersion supported relative to spatially unresolved HI gas kinematics.
However, more detailed comparison of our existing simulations to these observations is also warranted, particularly to forward-model the actual observed rotation curves and velocity dispersions. Some of the observed systems with high apparent velocities are clearly tidally disturbed or strongly interacting (e.g. IC 10, Ashley et al. 2014, and NGC 205, above), and Teyssier et al. (2012) argue NGC 147, 185, 6822, and Tucana, have all had a previous passage through the MW or M31 disk. Some of these also feature recent starbursts, in which case El-Badry et al. (2017b) argue that feedback-driven perturbations to the potential (the same which flatten the DM profile) can lead to the observationally-inferred Jeans masses (hence ) being over-estimated by up to a factor (sufficient to explain most of the discrepancy). We will show below, for example, that the actual line-of-sight stellar velocity dispersions in the simulations reach values similar to those observed even in the high-density systems.

5.4 The impact of the shape of the density profile
In summary, Figures 4 and 5 demonstrate that, while the DMO analogues to the ELVIS on FIRE simulations all suffer from TBTF, the problem is strongly alleviated or entirely eliminated in the fully hydrodynamic runs. Specifically, we find no TBTF problem around the MW analogues, a result consistent with observational incompleteness in the Local Field, and a set of dwarf galaxies consistent with the dSphs around M31 (though we find no analogues to the higher density satellites of M31).
However, the analysis above was performed with two caveats: first, we assume NFW profiles for the DMO (sub)halos but calculate for the FIRE simulations by joining fitted density profiles to the raw particle data, and second, we compare only the lower mass host in each pair to the MW dSphs. The second choice has no effect on our results: by the metrics defined above, none of our hosts, paired or isolated, have any massive failures in their luminous satellites when compared with the MW dSphs.
The first choice is similarly irrelevant to our conclusions, but it does have relatively large consequences for the number of ‘strong’ massive failures identified in the satellite populations of the DMO simulations: without correcting for the numerical impact of gravitational softening, we identify only 11 strong massive failures across the ten DMO hosts, compared with 61 when we assume NFW profiles. The number of massive failures in the DMO runs, however, is much more stable to this assumption and only decreases by 1–4 in all but two of our hosts, with the total count decreasing by only from 114 to 79. That is, by the Garrison-Kimmel et al. (2014b) metrics, we would still have identified a TBTF problem, even drawing directly from the particle data. We also emphasize that the assumption of NFW (or NFW-like) profiles for the DMO subhalos is theoretically well-motivated. Nevertheless, we plot the raw DMO curves for Romeo & Juliet in Appendix B for illustrative purposes.
More importantly, the results for the FIRE simulations are also only weakly sensitive shape of the central density profile. Specifically, adopting a cuspy NFW profile vs. using the corrected (or raw) mass profile has a relatively minor influence on the number of massive failures identified in the FIRE simulations, particularly when compared with the MW satellites. Assuming NFW profiles for the luminous satellites in the hydrodynamic runs (similarly normalized to and of each subhalo) yields a total of only 13 massive failures across our ten hosts when compared with the MW dSph sample, only three of which are ‘strong.’
Therefore, even though there is now substantial evidence that supernovae feedback can flatten the central density profiles of galaxies (e.g. Pontzen & Governato, 2012; Di Cintio et al., 2014a; Chan et al., 2015) we find that this effect is typically of second-order importance for solving TBTF among the satellite populations in these simulations (in agreement with Sawala et al., 2016b). Instead, the problem is primarily alleviated by removing mass from the subhalos overall (lowering ) and destroying otherwise luminous satellites through enhanced tidal interactions with the disk (D’Onghia et al., 2010; Sawala et al., 2017; Garrison-Kimmel et al., 2017b). However, we cannot completely dismiss the importance of feedback induced core formation; for example, subhalos cored by internal processes are then more susceptible to further mass loss from external interactions (e.g. Peñarrubia et al., 2010; Brooks & Zolotov, 2014, but also see Garrison-Kimmel et al., 2017b, who showed that much of the differences in subhalo counts between DMO and FIRE simulations can be accounted for purely by the gravitational potential of the central galaxy with only a weak dependence on subhalo mass or ).
Changes to the internal profile are also relatively unimportant in the Local Field, even though tidal effects are minimal in that volume: assuming NFW profiles for the non-satellite sample within of each host increases the total number of massive failures (defined in this volume as galaxies with without observational kinematic counterparts) across the entire simulated sample from to . However, this difference is still small compared to the overall impact of baryonic physics: the same volumes contain halos identified as massive failures when simulated without baryons (nearly independent of whether we assume NFW profiles or use the raw particle data). Therefore, even in the Local Field, feedback induced cores are only a small piece of resolving TBTF: overall baryonic mass loss, enhanced disruption (both from other field galaxies and in the sample of “backsplash” halos), and changes to the halo sample due to selecting on rather than all play a significant role, even for non-satellite galaxies.
6 Stellar velocity dispersions
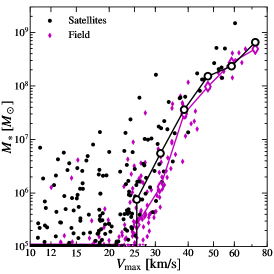
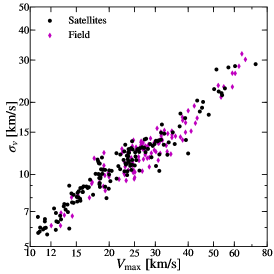
We have shown separately that the distributions of stellar masses and rotation curves of our simulated dwarf populations broadly agree with that of the LG. One can additionally ask whether our simulations predict the correct joint relation between these; that is, whether our individual dwarf galaxies are indeed realistic. Figure 6 directly compares the stellar velocity dispersions (defined as the RMS line-of-sight dispersion of all the stars associated with a galaxy) as a function of stellar mass for all of the satellite galaxies (defined as ) and non-satellite galaxies in the simulations, together with dwarf galaxies from throughout the LG. Though is not necessarily representative of the underlying DM halo (e.g. in the case of significant rotation, such as for the LMC, the right-most point in the plot), the overall agreement between the simulated and observed relationships support our assertion that our dwarf galaxy populations display similar kinematics as the observed LG dwarf galaxies.
However, the simulations fail to reproduce the six LG galaxies with and , all of which are within of M31. This disagreement may indicate that our resolution (for the stars, gravitational softening lengths and particle masses ) remains insufficient for resolving the coldest, and potentially most disrupted, dwarf galaxies in the LG – these systems have star particles in the simulations. The worst-case velocity kick (i.e. the maximal possible deflection) due to N-body interactions between stellar particles is of order in our simulations. Therefore, it may not be possible to maintain systems as dynamically cold as these six galaxies. There is also evidence for a partial separation between the satellite and non-satellite populations, such that satellite galaxies lose dynamical mass and scatter to lower at fixed . If, as suggested by Brooks & Zolotov (2014) and Zolotov et al. (2012), this is due to tidal effects, then the simulated analogues of the outlying galaxies in Figure 6 may be (spuriously) destroyed due to finite mass resolution (van den Bosch & Ogiya, 2018). However, those authors demonstrated artificial numerical disruption could be minimized with aggressive gravitational force softenings, and we remind the reader that our simulations adopt physical DM force softenings of .
We also note that, while we do not plot it, our simulations typically agree reasonably well with the distribution of the LG population at fixed or , but they do not reproduce the spatially smallest/most compact systems at a given . The results of even higher resolution FIRE simulations of isolated dwarf galaxies suggest that our smallest simulated dwarfs () will likely become more compact with increased resolution (Fitts et al., 2017), but higher mass dwarf galaxies simulated with FIRE maintain large effective radii even for gas particle masses (Chan et al., 2017) as their sizes are set by feedback “puffing up” the system. Given the insensitivity of our results to the internal profiles of the simulated satellites, we do not expect that increasing the resolution will significantly alter our conclusions with respect to TBTF. Moreover, in lower resolution FIRE simulations, the higher mass (i.e. resolved) dwarf galaxies also yield a reasonable relationship.
The right two panels in Figure 6 plot the stellar mass and stellar velocity dispersion as a function of . The relationship between and is relatively tight for isolated galaxies, where is more likely to represent the largest mass the halo ever reached, but it is clear that tidal interactions shift galaxies to the left on the plot by removing dark matter from the outer portions of the subhalos, decreasing faster than .121212The relationship between and for non-satellite galaxies is in stark contrast to the findings of Garrison-Kimmel et al. (2014b), who found no trend between and the implied for galaxies in the Local Field. However, that analysis assumed fixed density profiles across all halos, and assigned by extrapolating from . An updated analysis that accounts for variance in the density profiles as a function of and is required to properly assign values to the Local Field systems. Both results are in good agreement with Sawala et al. (2016b). Meanwhile, the relationship between and remains remarkably tight even after tidal interactions with a larger halo.
The downward arrows at the bottom of the center panel indicate halos with , i.e. that fall below the -limit of the plot. Our analysis assigns the vast majority of these halos no stars, though a few contain a small number of star particles. These systems begin to appear for and become frequent for (in rough agreement with Sawala et al., 2016a). If these halos host ultra-faint dwarf galaxies below our resolution limits, then such galaxies should appear to be fairly dense, with central masses similar to And XVIII. Because our definition of “massive failure” includes only halos with , these dark halos contribute only marginally towards resolving TBTF, particularly within the virial radius of the MW. However, the values plotted in Figure 6 are taken from the hydrodynamic simulations; it is therefore possible that DMO halos with accreted less overall mass in the hydrodynamic simulations and appear as dark halos with .
7 Conclusions
The Local Group provides an unparalleled window into the population of dwarf galaxies in the Universe, but it is not a typical environment: the presence of two massive halos () has important implications for, e.g., the predicted halo mass function in the nearby volume (Garrison-Kimmel et al., 2014a). Here, we present the first two simulations from the ELVIS on FIRE suite, which apply the FIRE models for star formation and feedback to LG-like environments at resolution. We also include results from FIRE simulations targeting isolated MW-mass halos at similar resolutions. We present the satellite and non-satellite stellar mass functions predicted by these simulations, and compare them to an analogous set of isolated MW-mass halos also simulated with FIRE. We then compare the internal structure of our resolved galaxies to that of the dwarf galaxies in the LG, both via their implied dynamical masses within the half-light radius (the too-big-to-fail problem) and through the relationships between and .
The simulations accurately reproduce the dwarf galaxy population of the MW for . They roughly bracket the stellar mass function of the MW satellites at nearly all masses, particularly below the masses of the LMC and SMC. However, the MW SMF is unique in exhibiting a “gap” between CVnI () and the ultra-faint dwarfs with , suggesting observational incompleteness around the MW even for (typically such galaxies). The simulated satellite galaxies also have central masses consistent with those of the real MW satellites: they do not suffer from too-big-to-fail. This result is relatively insensitive to the shape of the central density profile, particularly compared to the total impact of baryonic physics: even if we (falsely) assume a cuspy, NFW profile for the hydrodynamic simulations, we identify less than two “massive failures” per host on average, while the DMO simulations contain more than 11. Therefore, supernova induced core formation is less important in resolving TBTF among the MW satellites: subhalo disruption and overall mass loss appear to be the dominant processes.
Our simulated satellites are somewhat less successful at reproducing the population of dwarf galaxies around M31. They (usually) underproduce the total count at most stellar masses: M31 contains, on average, roughly twice as many satellites with as the median simulated host. Given that the highest mass host in our sample has , this may suggest a higher virial mass for M31. Moreover, while our simulated satellites have central masses consistent with the dSphs around M31, none of our dwarf galaxies appears to have enough mass within to host the highest-density dwarf galaxies inferred around M31 (the three dEs and IC 10) – the opposite problem as TBTF. Our simulations may also lack the resolution to reproduce the six dwarf galaxies within of M31 with and . More detailed modeling to predict the kinematics that would actually be measured in both these cases is clearly warranted.
The simulated non-satellite () populations agree reasonably well with the observations: they again roughly bracket the observed SMFs, now for , and have central masses that are consistent with observations of the majority of the dwarf galaxies in the Local Field. However, while the TBTF problem is resolved for satellite systems around the MW and M31, the simulations predict the existence of low-mass dwarf galaxies within Mpc of each host that are currently unaccounted for in the data. These all have , and circular velocities broadly similar to those observed in other LG and Local Field dwarfs of the same mass, and thus may represent an as-of-yet undetected population of low-mass dwarf galaxies in the Local Field. This prediction should be testable with a combination of LSST, WFIRST, and thirty-meter class telescopes. However, we note that both this discrepancy and that with the M31 stellar mass function may be quantitatively reduced if some of our “Local Field” population should really be associated with M31 (in observations), and our non-paired halos demonstrate large systematic scatter in their field stellar mass functions.
Other than the very low dwarf galaxies near M31, our simulated dwarfs broadly overlap the observations in vs. . We find a tight relationship between and for both satellites and non-satellites. The relationship between and is also relatively tight for non-satellites, but tidal interactions introduce substantial scatter among the satellite populations.
In short, neither the isolated, MW-mass FIRE simulations nor the ELVIS on FIRE simulations suffer from the traditional small-scale problems identified for satellites within the virial radius of the MW or M31. Further, the ELVIS on FIRE simulations alleviate the TBTF problem in the Local Field, though there remains some tension that needs to be tested with future observations.
Our simulations are not free of flaws. They ignore some physical processes that may be important at these scales (e.g. supermassive black holes and cosmic rays), they include a reionization history that on the early edge of constraints from Planck (Oñorbe et al., 2017), they appear to lack the necessary resolution to capture the half-mass radii of the smallest galaxies (), and they may fail to reproduce the highest density dwarf galaxies in the LG. Given that supernovae feedback appears to be most effective at these mass scales, their existence may point towards physics that reduces the burstiness in star formation (lessening the violent feedback episodes associated with strong bursts). Altogether, however, our results indicate that a meta-galactic ionizing background, stellar/supernovae feedback, and interactions with the disks of the MW and M31 are able to transform the overly abundant, overly dense LG (sub)halo populations predicted by DMO simulations into a sample of dwarf galaxies that is largely consistent with observations of the LG within the vanilla CDM paradigm, though our work does not rule out non-standard DM physics. Future work is required to fully understand the relative contributions of internal feedback, LG-scale interactions, and the cosmological background to dwarf galaxy formation in the Local Group, to test the impact of host mass on the satellite populations, and to understand the formation of the high density dEs in the Local Group.
Acknowledgments
The authors thank Evan Kirby, Coral Wheeler, Lina Necib, Alejandro Benitez-Llambay, and Cameron Hummels for valuable discussions, and Alexander Knebe and Oliver Hahn for making AHF and MUSIC, respectively, publicly available.
Support for SGK was provided by NASA through Einstein Postdoctoral Fellowship grant number PF5-160136 awarded by the Chandra X-ray Center, which is operated by the Smithsonian Astrophysical Observatory for NASA under contract NAS8-03060. Support for PFH was provided by an Alfred P. Sloan Research Fellowship, NSF Collaborative Research Grant #1715847 and CAREER grant #1455342. AW was supported by a Caltech-Carnegie Fellowship, in part through the Moore Center for Theoretical Cosmology and Physics at Caltech, and by NASA through grants HST-GO-14734 and HST-AR-15057 from STScI. JSB was supported by NSF grant AST-1518291 and by NASA through HST theory grants (programs AR-13921, AR-13888, and AR-14282.001) awarded by STScI, which is operated by the Association of Universities for Research in Astronomy (AURA), Inc., under NASA contract NAS5-26555. MBK acknowledges support from NSF grant AST-1517226 and CAREER grant AST-1752913 and from NASA grants NNX17AG29G and HST-AR-13888, HST-AR-13896, HST-AR-14282, HST-AR-14554, HST-AR-15006, HST-GO-12914, and HST-GO-14191 from STScI. DK was supported by NSF grant AST-1715101 and the Cottrell Scholar Award from the Research Corporation for Science Advancement. CAFG was supported by NSF through grants AST-1412836, AST-1517491, AST-1715216, and CAREER award AST-1652522, by NASA through grant NNX15AB22G, and by a Cottrell Scholar Award from the Research Corporation for Science Advancement. KEB was supported by a Berkeley graduate fellowship, a Hellman award for graduate study, and an NSF Graduate Research Fellowship. EQ was supported in part by NSF grant AST-1715070 and a Simons Investigator Award from the Simons Foundation. RES is supported by an NSF Astronomy & Astrophysics Postdoctoral Fellowship under grant AST-1400989.
Numerical calculations were run on the Caltech compute cluster “Wheeler,” allocations from XSEDE TG-AST130039 and PRAC NSF.1713353 supported by the NSF, NASA HEC SMD-16-7223 and SMD-16-7592, and High Performance Computing at Los Alamos National Labs. This work also made use of Astropy, a community-developed core Python package for Astronomy (Astropy Collaboration et al., 2013), matplotlib (Hunter, 2007), numpy (van der Walt et al., 2011), scipy (Jones et al., 01), ipython (Perez & Granger, 2007), yt (Turk et al., 2011), and NASA’s Astrophysics Data System. This research was supported in part by the National Science Foundation under Grant No. NSF PHY-1748958.
References
- Ackermann et al. (2015) Ackermann M., et al., 2015, Physical Review Letters, 115, 231301
- Ashley et al. (2014) Ashley T., Elmegreen B. G., Johnson M., Nidever D. L., Simpson C. E., Pokhrel N. R., 2014, AJ, 148, 130
- Astropy Collaboration et al. (2013) Astropy Collaboration et al., 2013, A&A, 558, A33
- Behroozi et al. (2013) Behroozi P. S., Wechsler R. H., Wu H.-Y., 2013, ApJ, 762, 109
- Bell & de Jong (2001) Bell E. F., de Jong R. S., 2001, ApJ, 550, 212
- Bell et al. (2011) Bell E. F., Slater C. T., Martin N. F., 2011, ApJ, 742, L15
- Bellazzini et al. (2004) Bellazzini M., Gennari N., Ferraro F. R., Sollima A., 2004, MNRAS, 354, 708
- Bellazzini et al. (2005) Bellazzini M., Gennari N., Ferraro F. R., 2005, MNRAS, 360, 185
- Belokurov et al. (2009) Belokurov V., et al., 2009, MNRAS, 397, 1748
- Bernard et al. (2009) Bernard E. J., et al., 2009, ApJ, 699, 1742
- Bernard et al. (2010) Bernard E. J., et al., 2010, ApJ, 712, 1259
- Bland-Hawthorn & Gerhard (2016) Bland-Hawthorn J., Gerhard O., 2016, ARA&A, 54, 529
- Bonanos et al. (2004) Bonanos A. Z., Stanek K. Z., Szentgyorgyi A. H., Sasselov D. D., Bakos G. Á., 2004, AJ, 127, 861
- Bose et al. (2018) Bose S., Deason A. J., Frenk C. S., 2018, preprint, (arXiv:1802.10096)
- Boylan-Kolchin et al. (2010) Boylan-Kolchin M., Springel V., White S. D. M., Jenkins A., 2010, MNRAS, 406, 896
- Boylan-Kolchin et al. (2011) Boylan-Kolchin M., Bullock J. S., Kaplinghat M., 2011, MNRAS, 415, L40
- Boylan-Kolchin et al. (2012) Boylan-Kolchin M., Bullock J. S., Kaplinghat M., 2012, MNRAS, 422, 1203
- Brasseur et al. (2011) Brasseur C. M., Martin N. F., Rix H.-W., Irwin M., Ferguson A. M. N., McConnachie A. W., de Jong J., 2011, ApJ, 729, 23
- Brooks & Zolotov (2014) Brooks A. M., Zolotov A., 2014, ApJ, 786, 87
- Bryan & Norman (1998) Bryan G. L., Norman M. L., 1998, ApJ, 495, 80
- Buck et al. (2018) Buck T., Macciò A. V., Dutton A. A., Obreja A., Frings J., 2018, preprint, (arXiv:1804.04667)
- Bullock & Boylan-Kolchin (2017) Bullock J. S., Boylan-Kolchin M., 2017, ARA&A, 55, 343
- Bullock et al. (2000) Bullock J. S., Kravtsov A. V., Weinberg D. H., 2000, ApJ, 539, 517
- Busha et al. (2011) Busha M. T., Wechsler R. H., Behroozi P. S., Gerke B. F., Klypin A. A., Primack J. R., 2011, ApJ, 743, 117
- Carlesi et al. (2016) Carlesi E., Hoffman Y., Sorce J. G., Gottlöber S., Yepes G., Courtois H., Tully R. B., 2016, MNRAS, 460, L5
- Carrera et al. (2002) Carrera R., Aparicio A., Martínez-Delgado D., Alonso-García J., 2002, AJ, 123, 3199
- Chan et al. (2015) Chan T. K., Kereš D., Oñorbe J., Hopkins P. F., Muratov A. L., Faucher-Giguère C.-A., Quataert E., 2015, MNRAS, 454, 2981
- Chan et al. (2017) Chan T. K., Kereš D., Wetzel A., Hopkins P. F., Faucher-Giguère C.-A., El-Badry K., Garrison-Kimmel S., Boylan-Kolchin M., 2017, preprint, (arXiv:1711.04788)
- Chapman et al. (2013) Chapman S. C., et al., 2013, MNRAS, 430, 37
- Clementini et al. (2003) Clementini G., Gratton R., Bragaglia A., Carretta E., Di Fabrizio L., Maio M., 2003, AJ, 125, 1309
- Collins et al. (2010) Collins M. L. M., et al., 2010, MNRAS, 407, 2411
- Collins et al. (2013) Collins M. L. M., et al., 2013, ApJ, 768, 172
- Conn et al. (2012) Conn A. R., et al., 2012, ApJ, 758, 11
- Cook et al. (1999) Cook K. H., Mateo M., Olszewski E. W., Vogt S. S., Stubbs C., Diercks A., 1999, PASP, 111, 306
- Corbelli (2003) Corbelli E., 2003, MNRAS, 342, 199
- Corbelli & Salucci (2000) Corbelli E., Salucci P., 2000, MNRAS, 311, 441
- Crain et al. (2015) Crain R. A., et al., 2015, MNRAS, 450, 1937
- Creasey et al. (2017) Creasey P., Sameie O., Sales L. V., Yu H.-B., Vogelsberger M., Zavala J., 2017, MNRAS, 468, 2283
- D’Onghia et al. (2010) D’Onghia E., Springel V., Hernquist L., Keres D., 2010, ApJ, 709, 1138
- Dale et al. (2007) Dale D. A., et al., 2007, ApJ, 655, 863
- Di Cintio et al. (2014a) Di Cintio A., Brook C. B., Macciò A. V., Stinson G. S., Knebe A., Dutton A. A., Wadsley J., 2014a, MNRAS, 437, 415
- Di Cintio et al. (2014b) Di Cintio A., Brook C. B., Dutton A. A., Macciò A. V., Stinson G. S., Knebe A., 2014b, MNRAS, 441, 2986
- Di Cintio et al. (2017) Di Cintio A., Brook C. B., Dutton A. A., Macciò A. V., Obreja A., Dekel A., 2017, MNRAS, 466, L1
- Diaz et al. (2014) Diaz J. D., Koposov S. E., Irwin M., Belokurov V., Evans N. W., 2014, MNRAS, 443, 1688
- Drlica-Wagner et al. (2015) Drlica-Wagner A., et al., 2015, ApJ, 813, 109
- Dutton et al. (2016) Dutton A. A., Macciò A. V., Frings J., Wang L., Stinson G. S., Penzo C., Kang X., 2016, MNRAS, 457, L74
- El-Badry et al. (2016) El-Badry K., Wetzel A., Geha M., Hopkins P. F., Kereš D., Chan T. K., Faucher-Giguère C.-A., 2016, ApJ, 820, 131
- El-Badry et al. (2017a) El-Badry K., et al., 2017a, preprint, (arXiv:1705.10321)
- El-Badry et al. (2017b) El-Badry K., Wetzel A. R., Geha M., Quataert E., Hopkins P. F., Kereš D., Chan T. K., Faucher-Giguère C.-A., 2017b, ApJ, 835, 193
- El-Badry et al. (2018) El-Badry K., et al., 2018, preprint, (arXiv:1801.03933)
- Escala et al. (2018) Escala I., et al., 2018, MNRAS, 474, 2194
- Fattahi et al. (2016) Fattahi A., et al., 2016, MNRAS, 457, 844
- Faucher-Giguère (2018) Faucher-Giguère C.-A., 2018, MNRAS, 473, 3717
- Fiorentino et al. (2010) Fiorentino G., et al., 2010, ApJ, 708, 817
- Fitts et al. (2017) Fitts A., et al., 2017, MNRAS, 471, 3547
- Fraternali et al. (2009) Fraternali F., Tolstoy E., Irwin M. J., Cole A. A., 2009, A&A, 499, 121
- Frinchaboy et al. (2012) Frinchaboy P. M., Majewski S. R., Muñoz R. R., Law D. R., Łokas E. L., Kunkel W. E., Patterson R. J., Johnston K. V., 2012, ApJ, 756, 74
- Garrison-Kimmel et al. (2014a) Garrison-Kimmel S., Boylan-Kolchin M., Bullock J. S., Lee K., 2014a, MNRAS, 438, 2578
- Garrison-Kimmel et al. (2014b) Garrison-Kimmel S., Boylan-Kolchin M., Bullock J. S., Kirby E. N., 2014b, MNRAS, 444, 222
- Garrison-Kimmel et al. (2014c) Garrison-Kimmel S., Horiuchi S., Abazajian K. N., Bullock J. S., Kaplinghat M., 2014c, MNRAS, 444, 961
- Garrison-Kimmel et al. (2017a) Garrison-Kimmel S., et al., 2017a, preprint, (arXiv:1712.03966)
- Garrison-Kimmel et al. (2017b) Garrison-Kimmel S., et al., 2017b, MNRAS, 471, 1709
- Geha et al. (2006) Geha M., Guhathakurta P., Rich R. M., Cooper M. C., 2006, AJ, 131, 332
- Geha et al. (2010) Geha M., van der Marel R. P., Guhathakurta P., Gilbert K. M., Kalirai J., Kirby E. N., 2010, ApJ, 711, 361
- Gieren et al. (2006) Gieren W., Pietrzyński G., Nalewajko K., Soszyński I., Bresolin F., Kudritzki R.-P., Minniti D., Romanowsky A., 2006, ApJ, 647, 1056
- Gottloeber et al. (2010) Gottloeber S., Hoffman Y., Yepes G., 2010, preprint, (arXiv:1005.2687)
- Grand et al. (2017) Grand R. J. J., et al., 2017, MNRAS, 467, 179
- Hahn & Abel (2011) Hahn O., Abel T., 2011, MNRAS, 415, 2101
- Harris & Zaritsky (2006) Harris J., Zaritsky D., 2006, AJ, 131, 2514
- Hernquist (1990) Hernquist L., 1990, ApJ, 356, 359
- Ho et al. (2012) Ho N., et al., 2012, ApJ, 758, 124
- Hopkins (2015) Hopkins P. F., 2015, MNRAS, 450, 53
- Hopkins (2017) Hopkins P. F., 2017, MNRAS, 466, 3387
- Hopkins et al. (2013) Hopkins P. F., Narayanan D., Murray N., 2013, MNRAS, 432, 2647
- Hopkins et al. (2014) Hopkins P. F., Kereš D., Oñorbe J., Faucher-Giguère C.-A., Quataert E., Murray N., Bullock J. S., 2014, MNRAS, 445, 581
- Hopkins et al. (2017) Hopkins P. F., et al., 2017, preprint, (arXiv:1702.06148)
- Howley et al. (2012) Howley K., et al., 2012, preprint, (arXiv:1202.2897)
- Hunter (2007) Hunter J. D., 2007, Computing In Science & Engineering, 9, 90
- Hunter & Elmegreen (2006) Hunter D. A., Elmegreen B. G., 2006, ApJS, 162, 49
- Ibata et al. (2007) Ibata R., Martin N. F., Irwin M., Chapman S., Ferguson A. M. N., Lewis G. F., McConnachie A. W., 2007, ApJ, 671, 1591
- Jaffe (1983) Jaffe W., 1983, MNRAS, 202, 995
- Jones et al. (01 ) Jones E., Oliphant T., Peterson P., et al., 2001–, SciPy: Open source scientific tools for Python, http://www.scipy.org/
- Jubelgas et al. (2008) Jubelgas M., Springel V., Enßlin T., Pfrommer C., 2008, A&A, 481, 33
- Kafle et al. (2018) Kafle P. R., Sharma S., Lewis G. F., Robotham A. S. G., Driver S. P., 2018, MNRAS,
- Katz & White (1993) Katz N., White S. D. M., 1993, ApJ, 412, 455
- Kim et al. (2014) Kim J.-h., et al., 2014, ApJS, 210, 14
- Kirby et al. (2014) Kirby E. N., Bullock J. S., Boylan-Kolchin M., Kaplinghat M., Cohen J. G., 2014, arXiv:1401.1208 [astro-ph],
- Klypin et al. (1999) Klypin A., Kravtsov A. V., Valenzuela O., Prada F., 1999, ApJ, 522, 82
- Knollmann & Knebe (2011) Knollmann S. R., Knebe A., 2011, AHF: Amiga’s Halo Finder, Astrophysics Source Code Library (ascl:1102.009)
- Koch et al. (2007) Koch A., Kleyna J. T., Wilkinson M. I., Grebel E. K., Gilmore G. F., Evans N. W., Wyse R. F. G., Harbeck D. R., 2007, AJ, 134, 566
- Kroupa (2001) Kroupa P., 2001, MNRAS, 322, 231
- Krumholz & Gnedin (2011) Krumholz M. R., Gnedin N. Y., 2011, ApJ, 729, 36
- Larson et al. (2011) Larson D., et al., 2011, ApJS, 192, 16
- Leaman et al. (2012) Leaman R., et al., 2012, ApJ, 750, 33
- Lee et al. (2009) Lee M. G., Yuk I.-S., Park H. S., Harris J., Zaritsky D., 2009, ApJ, 703, 692
- Ma et al. (2016) Ma X., Hopkins P. F., Faucher-Giguère C.-A., Zolman N., Muratov A. L., Kereš D., Quataert E., 2016, MNRAS, 456, 2140
- Martin et al. (2008a) Martin N. F., et al., 2008a, ApJ, 672, L13
- Martin et al. (2008b) Martin N. F., de Jong J. T. A., Rix H.-W., 2008b, ApJ, 684, 1075
- Martin et al. (2009) Martin N. F., et al., 2009, ApJ, 705, 758
- Martin et al. (2013a) Martin N. F., et al., 2013a, ApJ, 772, 15
- Martin et al. (2013b) Martin N. F., et al., 2013b, ApJ, 779, L10
- Martínez-Delgado et al. (1999) Martínez-Delgado D., Gallart C., Aparicio A., 1999, AJ, 118, 862
- Mateo et al. (1998) Mateo M., Olszewski E. W., Morrison H. L., 1998, ApJ, 508, L55
- Mateo et al. (2008) Mateo M., Olszewski E. W., Walker M. G., 2008, ApJ, 675, 201
- McCall (2014) McCall M. L., 2014, Monthly Notices of the Royal Astronomical Society, 440, 405
- McConnachie (2012) McConnachie A. W., 2012, AJ, 144, 4
- McConnachie & Irwin (2006) McConnachie A. W., Irwin M. J., 2006, MNRAS, 365, 1263
- McConnachie et al. (2004) McConnachie A. W., Irwin M. J., Lewis G. F., Ibata R. A., Chapman S. C., Ferguson A. M. N., Tanvir N. R., 2004, MNRAS, 351, L94
- McConnachie et al. (2005) McConnachie A. W., Irwin M. J., Ferguson A. M. N., Ibata R. A., Lewis G. F., Tanvir N., 2005, MNRAS, 356, 979
- McConnachie et al. (2008) McConnachie A. W., et al., 2008, ApJ, 688, 1009
- Merritt et al. (2006) Merritt D., Graham A. W., Moore B., Diemand J., Terzić B., 2006, AJ, 132, 2685
- Monaco et al. (2004) Monaco L., Bellazzini M., Ferraro F. R., Pancino E., 2004, MNRAS, 353, 874
- Moore et al. (1999) Moore B., Ghigna S., Governato F., Lake G., Quinn T., Stadel J., Tozzi P., 1999, ApJ, 524, L19
- More et al. (2015) More S., Diemer B., Kravtsov A. V., 2015, ApJ, 810, 36
- Muñoz et al. (2005) Muñoz R. R., et al., 2005, ApJ, 631, L137
- Muratov et al. (2015) Muratov A. L., Kereš D., Faucher-Giguère C.-A., Hopkins P. F., Quataert E., Murray N., 2015, MNRAS, 454, 2691
- Navarro et al. (1996) Navarro J. F., Frenk C. S., White S. D. M., 1996, ApJ, 462, 563
- Oñorbe et al. (2014) Oñorbe J., Garrison-Kimmel S., Maller A. H., Bullock J. S., Rocha M., Hahn O., 2014, MNRAS, 437, 1894
- Oñorbe et al. (2015) Oñorbe J., Boylan-Kolchin M., Bullock J. S., Hopkins P. F., Kereš D., Faucher-Giguère C.-A., Quataert E., Murray N., 2015, MNRAS, 454, 2092
- Oñorbe et al. (2017) Oñorbe J., Hennawi J. F., Lukić Z., 2017, ApJ, 837, 106
- Oman et al. (2015) Oman K. A., et al., 2015, MNRAS, 452, 3650
- Papastergis & Shankar (2016) Papastergis E., Shankar F., 2016, A&A, 591, A58
- Papastergis et al. (2015) Papastergis E., Giovanelli R., Haynes M. P., Shankar F., 2015, A&A, 574, A113
- Patel et al. (2018) Patel E., Besla G., Mandel K., Sohn S. T., 2018, preprint, (arXiv:1803.01878)
- Peñarrubia et al. (2008) Peñarrubia J., McConnachie A. W., Navarro J. F., 2008, ApJ, 672, 904
- Peñarrubia et al. (2010) Peñarrubia J., Benson A. J., Walker M. G., Gilmore G., McConnachie A. W., Mayer L., 2010, MNRAS, 406, 1290
- Perez & Granger (2007) Perez F., Granger B. E., 2007, Computing in Science Engineering, 9, 21
- Pietrzyński et al. (2008) Pietrzyński G., et al., 2008, AJ, 135, 1993
- Pietrzyński et al. (2009) Pietrzyński G., Górski M., Gieren W., Ivanov V. D., Bresolin F., Kudritzki R.-P., 2009, AJ, 138, 459
- Planck Collaboration et al. (2016) Planck Collaboration et al., 2016, A&A, 594, A13
- Pontzen & Governato (2012) Pontzen A., Governato F., 2012, MNRAS, 421, 3464
- Power et al. (2003) Power C., Navarro J. F., Jenkins A., Frenk C. S., White S. D. M., Springel V., Stadel J., Quinn T., 2003, MNRAS, 338, 14
- Price & Monaghan (2007) Price D. J., Monaghan J. J., 2007, MNRAS, 374, 1347
- Richardson et al. (2011) Richardson J. C., et al., 2011, ApJ, 732, 76
- Salomon et al. (2016) Salomon J.-B., Ibata R. A., Famaey B., Martin N. F., Lewis G. F., 2016, MNRAS, 456, 4432
- Sanderson et al. (2017) Sanderson R. E., et al., 2017, preprint, (arXiv:1712.05808)
- Saviane et al. (1996) Saviane I., Held E. V., Piotto G., 1996, VizieR Online Data Catalog, 331
- Sawala et al. (2016a) Sawala T., et al., 2016a, MNRAS, 456, 85
- Sawala et al. (2016b) Sawala T., et al., 2016b, MNRAS, 457, 1931
- Sawala et al. (2017) Sawala T., Pihajoki P., Johansson P. H., Frenk C. S., Navarro J. F., Oman K. A., White S. D. M., 2017, MNRAS, 467, 4383
- Schaye et al. (2015) Schaye J., et al., 2015, MNRAS, 446, 521
- Sick et al. (2015) Sick J., Courteau S., Cuillandre J.-C., Dalcanton J., de Jong R., McDonald M., Simard D., Tully R. B., 2015, in Cappellari M., Courteau S., eds, IAU Symposium Vol. 311, Galaxy Masses as Constraints of Formation Models. pp 82–85 (arXiv:1410.0017), doi:10.1017/S1743921315003440
- Simon & Geha (2007) Simon J. D., Geha M., 2007, ApJ, 670, 313
- Simon et al. (2006) Simon J. D., Prada F., Vílchez J. M., Blitz L., Robertson B., 2006, ApJ, 649, 709
- Simpson et al. (2017) Simpson C. M., Grand R. J. J., Gómez F. A., Marinacci F., Pakmor R., Springel V., Campbell D. J. R., Frenk C. S., 2017, preprint, (arXiv:1705.03018)
- Somerville (2002) Somerville R. S., 2002, ApJ, 572, L23
- Sparre et al. (2017) Sparre M., Hayward C. C., Feldmann R., Faucher-Giguère C.-A., Muratov A. L., Kereš D., Hopkins P. F., 2017, MNRAS, 466, 88
- Springel (2005) Springel V., 2005, MNRAS, 364, 1105
- Springel et al. (2005) Springel V., et al., 2005, Nature, 435, 629
- Stanimirović et al. (2004) Stanimirović S., Staveley-Smith L., Jones P. A., 2004, ApJ, 604, 176
- Stinson et al. (2006) Stinson G., Seth A., Katz N., Wadsley J., Governato F., Quinn T., 2006, MNRAS, 373, 1074
- Su et al. (2017) Su K.-Y., Hopkins P. F., Hayward C. C., Faucher-Giguère C.-A., Kereš D., Ma X., Robles V. H., 2017, MNRAS, 471, 144
- Teyssier et al. (2012) Teyssier M., Johnston K. V., Kuhlen M., 2012, MNRAS, 426, 1808
- Tikhonov & Galazutdinova (2009) Tikhonov N. A., Galazutdinova O. A., 2009, Astronomy Letters, 35, 748
- Tollerud et al. (2008) Tollerud E. J., Bullock J. S., Strigari L. E., Willman B., 2008, ApJ, 688, 277
- Tollerud et al. (2011) Tollerud E. J., Boylan-Kolchin M., Barton E. J., Bullock J. S., Trinh C. Q., 2011, ApJ, 738, 102
- Tollerud et al. (2012) Tollerud E. J., et al., 2012, ApJ, 752, 45
- Tollerud et al. (2013) Tollerud E. J., Geha M. C., Vargas L. C., Bullock J. S., 2013, ApJ, 768, 50
- Tollerud et al. (2014) Tollerud E. J., Boylan-Kolchin M., Bullock J. S., 2014, MNRAS, 440, 3511
- Turk et al. (2011) Turk M. J., Smith B. D., Oishi J. S., Skory S., Skillman S. W., Abel T., Norman M. L., 2011, The Astrophysical Journal Supplement Series, 192, 9
- Udalski et al. (1999) Udalski A., Szymanski M., Kubiak M., Pietrzynski G., Soszynski I., Wozniak P., Zebrun K., 1999, Acta Astron., 49, 201
- Walker et al. (2009) Walker M. G., Mateo M., Olszewski E. W., 2009, AJ, 137, 3100
- Weiner et al. (2006) Weiner B. J., et al., 2006, ApJ, 653, 1027
- Wetzel et al. (2016) Wetzel A. R., Hopkins P. F., Kim J.-h., Faucher-Giguère C.-A., Kereš D., Quataert E., 2016, ApJ, 827, L23
- Wilcots & Miller (1998) Wilcots E. M., Miller B. W., 1998, AJ, 116, 2363
- Wolf et al. (2010) Wolf J., Martinez G. D., Bullock J. S., Kaplinghat M., Geha M., Muñoz R. R., Simon J. D., Avedo F. F., 2010, MNRAS, 406, 1220
- Woo et al. (2008) Woo J., Courteau S., Dekel A., 2008, MNRAS, 390, 1453
- Yang & Sarajedini (2012) Yang S.-C., Sarajedini A., 2012, MNRAS, 419, 1362
- Zolotov et al. (2012) Zolotov A., et al., 2012, ApJ, 761, 71
- de Jong et al. (2008) de Jong J. T. A., et al., 2008, ApJ, 680, 1112
- de Vaucouleurs et al. (1991) de Vaucouleurs G., de Vaucouleurs A., Corwin Jr. H. G., Buta R. J., Paturel G., Fouqué P., 1991, Third Reference Catalogue of Bright Galaxies. Volume I: Explanations and references. Volume II: Data for galaxies between 0h and 12h. Volume III: Data for galaxies between 12h and 24h.
- van Dokkum et al. (2015) van Dokkum P. G., Abraham R., Merritt A., Zhang J., Geha M., Conroy C., 2015, ApJ, 798, L45
- van den Bosch & Ogiya (2018) van den Bosch F. C., Ogiya G., 2018, MNRAS, 475, 4066
- van der Marel & Kallivayalil (2014) van der Marel R. P., Kallivayalil N., 2014, ApJ, 781, 121
- van der Marel & van den Bosch (1998) van der Marel R. P., van den Bosch F. C., 1998, AJ, 116, 2220
- van der Marel et al. (2002) van der Marel R. P., Alves D. R., Hardy E., Suntzeff N. B., 2002, AJ, 124, 2639
- van der Marel et al. (2012) van der Marel R. P., Fardal M., Besla G., Beaton R. L., Sohn S. T., Anderson J., Brown T., Guhathakurta P., 2012, ApJ, 753, 8
- van der Walt et al. (2011) van der Walt S., Colbert S. C., Varoquaux G., 2011, Computing in Science Engineering, 13, 22
Appendix A OBSERVATIONAL CATALOG
Table 2 lists the properties of the galaxies plotted in Figures 2, 4, 5, and 6, separated in the MW, M31, and Local Field subsamples. Columns list the distance from the MW and M31, adopted stellar mass, 3D half-light radius, line-of-sight velocity dispersion, the implied circular velocity at , and references. Galaxies without an entry for (, ) are not included in Figures 4 and 5, and galaxies without an entry for are not included in Figure 6. While we include the properties of M32 as listed in Tollerud et al. (2014), we remind the reader that it falls outside the bounds of our plots in Figures 4, 5, and 6. Dynamical values ( and ) adopted from Wolf et al. (2010) were calculated using data from Walker et al. (2009) along with Muñoz et al. (2005); Koch et al. (2007); Simon & Geha (2007) and Mateo et al. (2008).
The references in the last column are as follows: (1) de Vaucouleurs et al. (1991); (2) Clementini et al. (2003); (3) van der Marel et al. (2002); (4) Udalski et al. (1999); (5) Harris & Zaritsky (2006); (6) Monaco et al. (2004); (7) Mateo et al. (1998); (8) Frinchaboy et al. (2012); (9) Pietrzyński et al. (2009); (10) Wolf et al. (2010); (11) Bellazzini et al. (2004); (12) Pietrzyński et al. (2008); (13) Bellazzini et al. (2005); (14) Lee et al. (2009); (15) Carrera et al. (2002); (16) Bonanos et al. (2004); (17) Martin et al. (2008a); (18) McConnachie et al. (2005); (19) Simon et al. (2006); (20) Geha et al. (2006); (21) Fiorentino et al. (2010); (22) Howley et al. (2012); (23) Geha et al. (2010); (24) Tikhonov & Galazutdinova (2009); (25) Wilcots & Miller (1998); (26) McConnachie & Irwin (2006); (27) Tollerud et al. (2012); (28) Martin et al. (2013a); (29) Conn et al. (2012); (30) Ho et al. (2012); (31) Richardson et al. (2011); (32) Collins et al. (2013); (33) Martin et al. (2009); (34) Cook et al. (1999); (35) Ibata et al. (2007); (36) McConnachie et al. (2008); (37) Brasseur et al. (2011); (38) Bell et al. (2011); (39) Tollerud et al. (2013); (40) Collins et al. (2010); (41) Yang & Sarajedini (2012); (42) Chapman et al. (2013); (43) Bernard et al. (2010); (44) Kirby et al. (2014); (45) Hunter & Elmegreen (2006); (46) Gieren et al. (2006) (47) Dale et al. (2007); (48) Leaman et al. (2012); (49) Bernard et al. (2009); (50) Martin et al. (2013b); (51) Martínez-Delgado et al. (1999); (52) Saviane et al. (1996); (53) Fraternali et al. (2009); (54) de Jong et al. (2008); (55) Simon & Geha (2007).
| Name | Type | References | |||||
| [] | [] | [] | [] | [] | |||
| MW Satellites | |||||||
| LMC | dIrr | 50 | 811 | – | 20.2 | 1, 2, 3 | |
| SMC | dIrr | 61 | 812 | – | 27.6 | 1, 4, 5 | |
| Sagittarius | dSph | 19 | 792 | – | 9.9 | 6, 7, 8 | |
| Fornax | dSph | 149 | 773 | 10.7 | 9, 10 | ||
| Leo I | dSph | 257 | 922 | 9.0 | 10, 11 | ||
| Sculptor | dSph | 86 | 766 | 9.0 | 10, 12 | ||
| Leo II | dSph | 236 | 902 | 6.6 | 10, 13 | ||
| Sextans | dSph | 89 | 839 | 7.1 | 10, 14 | ||
| Ursa Minor | dSph | 78 | 758 | 11.5 | 10, 15 | ||
| Carina | dSph | 107 | 842 | 6.4 | 9, 10 | ||
| Draco | dSph | 76 | 755 | 10.1 | 10, 16 | ||
| CVnI | dSph | 218 | 864 | 7.6 | 10, 17 | ||
| M31 Satellites | |||||||
| M33 | Spiral | 814 | 206 | – | 1, 18, 19 | ||
| NGC 205 | dE | 828 | 42 | 35.0 | 1, 18, 20 | ||
| M32 | cE | 809 | 23 | 92.0 | 1, 21, 22 | ||
| NGC 147 | dE | 680 | 143 | 16.0 | 1, 18, 23 | ||
| IC 10 | dIrr | 798 | 252 | – | 1, 24, 25 | ||
| NGC 185 | dE | 621 | 188 | 24.0 | 1, 18, 23 | ||
| And VII | dSph | 765 | 218 | 13.0 | 18, 26, 27 | ||
| And XXXII | dSph | 780 | 141 | – | – | 28 | |
| And II | dSph | 656 | 184 | 7.8 | 26, 29, 30 | ||
| And I | dSph | 749 | 58 | 10.2 | 18, 26, 27 | ||
| And XXXI | dSph | 760 | 263 | – | – | 28 | |
| And III | dSph | 752 | 75 | 9.3 | 18, 26, 27 | ||
| And XXIII | dSph | 774 | 126 | 7.1 | 29, 31, 32 | ||
| And VI | dSph | 785 | 269 | 12.4 | 18, 26, 32 | ||
| And XXI | dSph | 831 | 134 | 7.2 | 27, 29, 33 | ||
| And XXV | dSph | 817 | 89 | 3.0 | 29, 31, 32 | ||
| LGS 3 | dE | 773 | 269 | 7.9 | 18, 34 | ||
| And XV | dSph | 630 | 179 | 4.0 | 27, 29, 35 | ||
| And V | dSph | 777 | 109 | 10.5 | 18, 26, 27 | ||
| And XIX | dSph | 823 | 114 | 4.7 | 29, 32, 36 | ||
| And XIV | dSph | 798 | 161 | 5.3 | 27, 29 | ||
| And XVII | dSph | 732 | 70 | 2.9 | 29, 32, 37 | ||
| And XXIX | dSph | 734 | 188 | 5.7 | 38, 39 | ||
| And IX | dSph | 770 | 40 | 10.9 | 18, 27 | ||
| And XXX | dSph | 686 | 148 | 11.8 | 29, 32 | ||
| And XXVII | dSph | 832 | 74 | 14.8 | 29, 31, 32 | ||
| And XXIV | dSph | 605 | 208 | – | – | 31 | |
| And X | dSph | 674 | 134 | 6.4 | 29, 32, 37 | ||
| And XXVI | dSph | 766 | 103 | 8.6 | 32, 37 | ||
| And XI | dSph | 738 | 111 | 4.6 | 40, 41 | ||
| And XXII | dSph | 925 | 274 | 2.8 | 29, 33, 42 | ||
| Local Field | |||||||
| IC 1613 | dIrr | 758 | 520 | 10.8 | 1, 43, 44, 45 | ||
| NGC 6822 | dIrr | 452 | 898 | 23.2 | 44, 45, 46, 47 | ||
| WLM | dIrr | 933 | 836 | 17.0 | 1, 18, 48 | ||
| Pegasus | dIrr | 921 | 474 | 12.3 | 1, 18, 44, 45 | ||
| Cetus | dSph | 756 | 680 | 8.3 | 26, 44, 49 | ||
| Leo A | dIrr | 803 | 1200 | 6.7 | 1, 44, 45 | ||
| And XXXIII | dSph | 779 | 349 | – | – | 50 | |
| Phoenix | dIrr | 415 | 868 | – | – | 51 | |
| Tucana | dSph | 883 | 1356 | 15.8 | 49, 52, 53 | ||
| And XVIII | dSph | 1217 | 453 | 9.7 | 27, 29, 36 | ||
| And XVI | dSph | 480 | 323 | 3.8 | 27, 29, 35 | ||
| And XXVIII | dSph | 661 | 368 | 4.9 | 29, 35, 39 | ||
| Leo T | dIrr | 422 | 991 | 7.5 | 54, 55 | ||
Appendix B SATELLITE GALAXIES WITHIN 400 KPC
In the main text, we select as the dividing radius between satellites and non-satellite galaxies. However, this is motivated primarily by historical reasons, and is somewhat arbitrary – while the virial radius of these hosts range from , the virial radius does not have an intrinsic physical meaning. Instead, the physical boundary of the halo is more closely related to the splashback radius, which is typically , the radius that encloses an average of 200 times the background density (More et al., 2015). For our hosts, . Moreover, there are curious gaps of known satellites at around the MW and around M31 (Samuel et al., in preparation). Therefore, Figure 7 follows the left panel of Figure 2 in counting galaxies around each host, but here counts dwarf galaxies within . The exact numbers shift slightly, but the overall conclusion that our present sample of hosts (with ) underproduces the SMF of M31 is unchanged. This does, however, somewhat reduce both this tension and the apparent tension with the Local Field stellar mass function and TBTF problems, by re-assigning halos with from the Local Field to M31.
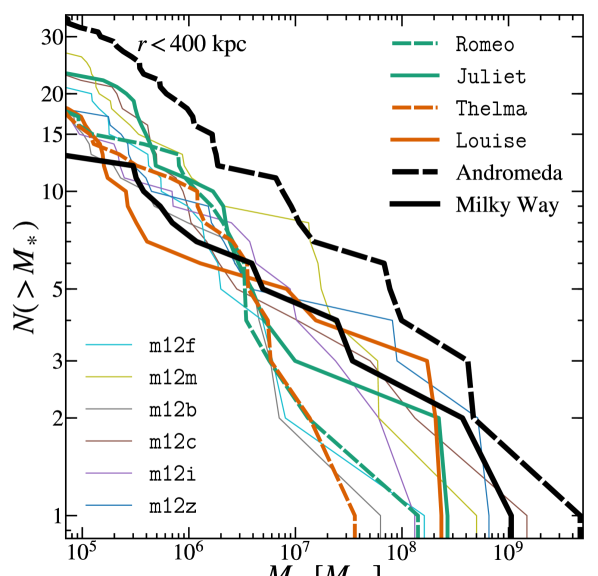
Appendix C IMPACT OF DENSITY PROFILES ON CIRCULAR VELOCITIES
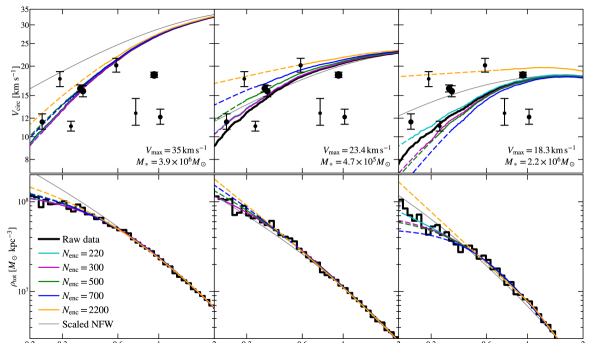
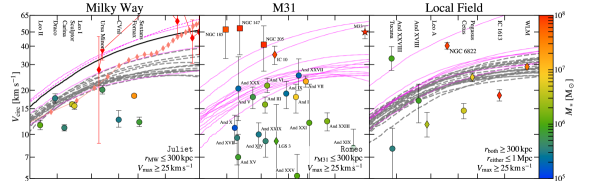
In § 5, we compute circular velocity profiles for galaxies in the hydrodynamic simulations by first fitting the resolved portion of the halo with an density profile:
| (1) |
Here, we examine the impact of using the interpolated density profile to compute the central mass vs. using the raw particle data, as well as the affect of varying , the smallest radius used in fitting and the radius within which we compute from the fits. Figure 8 shows the circular velocity profiles for three satellite galaxies of Juliet obtained from the raw particle data and from fits with varying . Following Hopkins et al. (2017, and also see , ), we determine as the radius that contains a given number of dark matter particles. Figure 8 illustrates that the correction to the circular velocity from under-resolving the central is typically only at and is nearly negligible at , regardless of the number of DM particles used to define . The lone exception, the fit with determined by in the right panel, diverges because the implied is comparable to , resulting in a poor fit to the density profile. To emphasize that our TBTF counts are insensitive to the inner profiles, such that we can still match constraints on the MW dSphs with cuspy central densities, we additionally plot NFW profiles normalized to and . The implied profiles can vary by a factor of at in subhalos with higher (where supernova feedback is more important), but a combination of overall mass loss from surviving subhalos and enhanced subhalo destruction from the central galaxy (relative to the DMO simulations) are nearly sufficient to explain TBTF.
In order to explicitly demonstrate that our assumption of NFW profiles for the DMO simulations does not effect our overall results, Figure 9 shows the circular velocity profiles for Romeo & Juliet, but here using the raw particle data. Even without correcting for the effects of gravitational softening or assuming a density profile, the DMO simulations contain subhalos that can only host Draco and Ursa Minor.