Detection of the Far-infrared [O iii] and Dust Emission in a Galaxy at Redshift 8.312:
Early Metal Enrichment in the Heart of the Reionization Era
Abstract
We present the Atacama Large Millimeter/submillimeter Array (ALMA) detection of the [O iii] 88 line and rest-frame 90 dust continuum emission in a -dropout Lyman break galaxy (LBG), MACS0416_Y1, lying behind the Frontier Field cluster MACS J0416.12403. This [O iii] detection confirms the LBG with a spectroscopic redshift of , making this object one of the furthest galaxies ever identified spectroscopically. The observed 850 flux density of Jy corresponds to a de-lensed total infrared (IR) luminosity of if assuming a dust temperature of K and an emissivity index of , yielding a large dust mass of . The ultraviolet-to-far IR spectral energy distribution modeling where the [O iii] emissivity model is incorporated suggests the presence of a young ( Myr), star-forming (SFR yr-1), moderately metal-polluted () stellar component with a mass of . An analytic dust mass evolution model with a single episode of star-formation does not reproduce the metallicity and dust mass in Myr, suggesting a pre-existing evolved stellar component with and Gyr as the origin of the dust mass.
1 Introduction
How and when metal enrichment happened in the epoch of reionization (EoR) is one of the most fundamental questions in modern astronomy. Recent Planck results suggest that the cosmic reionization occurred at an instantaneous reionization redshift of (Planck Collaboration et al., 2018), and the latest Hubble Space Telescope (HST) surveys have revealed more than a hundred of candidate Lyman break galaxies (LBGs, e.g., Bouwens et al., 2015; Ishigaki et al., 2018, see Stark 2016 for a review) out to (Oesch et al., 2016). Furthermore, based on the samples of LBGs, Oesch et al. (2018) reported a strong evolution of the ultraviolet (UV) luminosity function by one order of magnitude from to , implying a rapid increase of the cosmic star-formation rate density by an order of magnitude within a very short time-scale ( Myr). It is likely that this steep evolution compared to lower- can be explained by the fast build-up of the dark matter halo mass function at (Oesch et al., 2018).
However, it is still a challenge to characterize baryonic physics of the galaxies. One of the major obstacles is that these LBGs are yet to be confirmed through spectroscopy; since the rest-frame UV continuum is typically not sufficiently bright for detection with current instruments, it is often assumed that the Lyman- (Ly) emission line might be the best tool for spectroscopic confirmation. A large amount of 8–10 m telescope time have been invested in Ly searches for candidates, but so far this resulted in only a few detections (, 8.38, 9.11, Zitrin et al., 2015b; Laporte et al., 2017; Hashimoto et al., 2018a, respectively), likely indicating that the Ly signal is substantially attenuated by the largely-neutral intergalactic medium at this epoch.
Alternative UV indicators such as C iii] 1907,1909 Å serve as a workhorse for redshift identification (e.g., Zitrin et al., 2015a; Stark et al., 2015a). These lines, in addition to the rest-frame optical oxygen and nitrogen lines, are also useful for characterizing the metal enrichment of interstellar medium (ISM) and stellar components of the galaxies (e.g., Stark et al., 2015a, b, 2017; Mainali et al., 2018). These diagnostic lines will provide a unique insight into the physical properties of ionized gas in the Universe when the James Webb Space Telescope (JWST) comes online, although their use is currently limited to bright galaxies in a certain redshift range, because most of the lines are intrinsically faint and/or are redshifted outside the wavelength range where the atmospheric transmittance is good for ground-based facilities.
With this in mind, Inoue et al. (2014a) have investigated the potential use of redshifted nebular emission lines in the rest-frame far-infrared (FIR) in determining spectroscopic redshift of galaxies. The [O iii] 88 line, which is often observed as the brightest FIR line in local H ii regions (e.g., Takami et al., 1987; Kawada et al., 2011), can be used as an instantaneous tracer of massive star formation, since ionization of O O++ requires hard ( eV) ionizing photons from hot, short-lived O-type stars. Inoue et al. (2014a) predicted the line fluxes from high- galaxies on the basis of a cosmological hydrodynamic simulation of galaxy formation (Shimizu et al., 2014) by incorporating an [O iii] emission line model as a function of metallicity calibrated by ISO, AKARI and Herschel observations of local galaxies (Brauher et al., 2008; Kawada et al., 2011; Madden et al., 2012, 2013, see also Cormier et al. 2015). Since the metallicity of a typical galaxy with mag (AB) reaches even at , the [O iii] line of such galaxies is as bright as 1–5 mJy, which is bright enough to be detected with existing submillimeter facilities, such as the Atacama Large Millimeter/submillimeter Array (ALMA).
Indeed, it is becoming clear that galaxies at are bright in [O iii] 88 (Inoue et al., 2016; Carniani et al., 2017; Laporte et al., 2017; Marrone et al., 2018; Hashimoto et al., 2018a, b, c; Walter et al., 2018). The first detection in the EoR has been made for a Ly emitter, SXDF-NB1006-2 (Inoue et al., 2016), in which only 2 hr integration of ALMA Band 8 was invested, implying the [O iii] line as a promising tool to pin down the spectroscopic redshift even for galaxies. More recently, two LBGs, A2744_YD4 at (Laporte et al., 2017) and MACS1149-JD1 at (Hashimoto et al., 2018a), have been confirmed in [O iii] at and , respectively. A2744_YD4 was also detected in 850- continuum with mJy, suggesting the presence of a chemically-evolved ISM. It should also be noted that MACS1149-JD1 was identified without any prior information of a redshift inferred from a spectral line, demonstrating the [O iii] line as the redshift indicator complementing the role of the Ly and other UV lines.
In addition, the [O iii] 88 flux places a unique constraint on the stellar and ISM properties, since the [O iii] line is extinction-free and sensitive to the electron density, ionization parameter, and gas-phase oxygen abundance of the ionized media, which also depend on the global properties such as the star-formation rate (SFR) and stellar age. Inoue et al. (2016) have carried out comprehensive modeling of the UV-to-FIR spectral energy distribution (SED) of SXDF-NB1006-2, in which the [O iii] flux and submillimeter continuum upper limits are taken into account. They found this to be a young ( Myr) star-forming ( yr-1) galaxy with a somewhat high best-fitting metallicity of 0.05–1 . In contrast, Hashimoto et al. (2018a) revealed that MACS1149-JD1 has a more evolved (290 Myr) stellar component with a metallicity of , suggesting a formation redshift of . The non-detection of dust continuum in both galaxies suggests low dust-to-metal mass ratios in their ISM (Inoue et al., 2016) compared to the Milky Way’s value (, e.g., Inoue, 2011b), which could indicate that a substantial fraction of ISM metals is not stored in grains.
In this paper, we report the detections of the [O iii] 88 line and dust continuum in a modestly-magnified -dropout LBG, confirming the spectroscopic redshift to be , i.e., corresponding to an epoch when the age of the Universe was only 600 Myr. This is one of the furthest galaxies ever identified spectroscopically by exploiting the brightness of the [O iii] line. This paper is organized as follows: § 2 explains how the target was selected. § 3 describes the ALMA and VLT/X-shooter observations. § 4 demonstrates the detection of dust and [O iii] emission in MACS0416_Y1. In § 5, we perform an analysis of the SED to constrain the physical properties of MACS0416_Y1. In § 6, we discuss the model prediction of the dust mass, whereby we demonstrate that some parameter degeneracies obtained in the SED analysis can be resolved by incorporating a dust mass evolution model. Finally, our conclusions are presented in § 7.
Throughout this paper, we adopt a concordance cosmology with , and km s-1 Mpc-1. An angular scale of corresponds to the physical scale of 4.7 kpc at . A redshift corresponds to an age of the Universe of 0.60 Gyr.
| UT start time$\sharp$$\sharp$footnotemark: | Baseline lengths | Center frequency | Integration time | PWV | |
|---|---|---|---|---|---|
| (YYYY-MM-DD hh:mm:ss) | (m) | $\dagger$$\dagger$footnotemark: | (GHz) | (min) | (mm) |
| 2016-10-25 05:11:40 | 19–1399 | 43 | 351.40 (T2) | 32.76 | 0.62 |
| 2016-10-26 09:25:43 | 19–1184 | 46 | 351.40 (T2) | 32.76 | 0.30 |
| 2016-10-28 09:15:52 | 19–1124 | 39 | 355.00 (T3) | 38.30 | 0.35 |
| 2016-10-29 07:10:42 | 19–1124 | 41 | 347.80 (T1) | 33.77 | 1.27 |
| 2016-10-30 07:36:05 | 19–1124 | 39 | 355.00 (T3) | 38.30 | 0.93 |
| 2016-10-30 08:55:42 | 19–1124 | 40 | 347.80 (T1) | 33.77 | 0.78 |
| 2016-11-02 04:23:49 | 19–1124 | 40 | 358.60 (T4) | 30.23 | 0.64 |
| 2016-11-02 05:31:01 | 19–1124 | 40 | 358.60 (T4) | 30.23 | 0.97 |
| 2016-12-17 05:37:41 | 15–460 | 44 | 347.80 (T1) | 33.77 | 0.90 |
| 2016-12-18 05:21:55 | 15–492 | 47 | 347.80 (T1) | 33.77 | 1.29 |
| 2017-04-28 21:51:39 | 15–460 | 39 | 355.00 (T3) | 38.30 | 0.72 |
| 2017-07-03 12:28:53 | 21–2647 | 40 | 358.60 (T4) | 30.23 | 0.24 |
| 2017-07-04 12:40:06 | 21–2647 | 40 | 358.60 (T4) | 30.23 | 0.41 |
2 Target
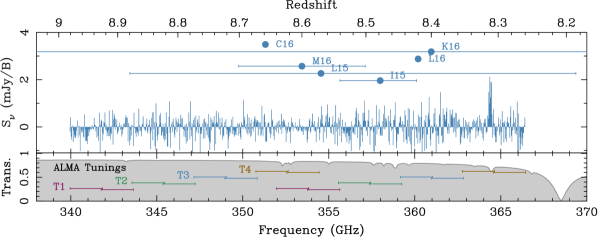
Among a hundred of candidates from treasury HST programs (e.g., BoRG, CANDELS, CLASH, HFF, HUDF), we carefully selected a bright (, AB) galaxy candidate with an accurate photometric redshift () which is accessible from ALMA () with good atmospheric transmission. The criteria finally leave MACS0416_Y1 (, Laporte et al., 2015; Infante et al., 2015). MACS0416_Y1 lies behind the MACS J0416.12403 cluster, one of the Hubble Frontier Fields (HFF, Lotz et al., 2017), while the magnification of the LBG is moderate (e.g., magnification factor, , Kawamata et al., 2016). Thanks to the deepest HST and Spitzer photometry, the photo- is well constrained by six independent studies to be (Infante et al., 2015), (Laporte et al., 2015), (Laporte et al., 2016), (McLeod et al., 2015), 8.66 (Castellano et al., 2016) and (Kawamata et al., 2016). The most-likely redshift interval can be covered by four tunings of ALMA Band 7, which offer a wide redshift coverage of for [O iii] 88 .
3 Observations
3.1 ALMA Observations and Reduction
The ALMA observations were carried out from 2016 October to December and 2017 May to July as a Cycle 4 program (program ID: 2016.1.00117.S). The observation log is given in Table 1. Four different tunings were assigned to cover contiguous frequency range between 340.0 and 366.4 GHz. The local oscillators of the Band 7 receivers were tuned at 347.80, 351.40, 355.00, and 358.60 GHz, and we hereafter denote these tunings as T1, T2, T3, and T4, respectively. The correlator was configured with the frequency-division mode, in which the four spectral windows (SPWs) cover 7.5 GHz with respect to the central frequencies with a channel spacing of 7.8125 MHz. The phase tracking center was set to the LBG position, , which was determined by the HST observations (Laporte et al., 2015; Infante et al., 2015). The on-source time was 436 min in total. Two quasars, J03482749 and J04532807, were used for complex gain calibration. J05223627 was used for bandpass calibration. Flux was scaled using J05223627 (for the tunings T2 and T3, –4 Jy) and J0334-4008 (for the tunings T1 and T4, Jy), yielding an absolute accuracy better than 10%.
The calibration and flagging were made using a standard pipeline running on casa (McMullin et al., 2007) version 4.7.2, while manual flagging was needed for some outlier antennas. Four tuning data are combined to make the continuum image using the casa task, clean, with the natural weighting. Note that spectral channels where the [O iii] line is detected were not used for continuum imaging. The resulting synthesized beam size in full width at half maximum (FWHM) is (position angle PA = ). Synthesized beam deconvolution is made down to .
Each tuning data set was also imaged to produce a cube with a frequency resolution of 31.25 MHz ( km s-1) to search for the [O iii] line. As the data sets were obtained in different array configurations and some SPWs with long baselines may resolve out the emission, we optimally-taper the image with a Gaussian kernel to maximize the signal-to-noise ratio (SNR) of the emission. The resulting beam size and r.m.s. noise level measured at 364 GHz are (PA = ) and mJy beam-1, respectively (Figures 1 and 3).
3.2 ALMA and Hubble Astrometry
The position of the LBG was originally determined by the HFF HST images which are aligned to the existing CLASH catalogs (Postman et al., 2012); the CLASH astrometry was based on Subaru’s Suprime-Cam catalogs which are registered onto the Two-Micron All Sky Survey (2MASS) frame. We find, however, that the optical-to-NIR astrometry does not fully match the International Celestial Reference System (ICRS), on which ALMA relies. In order to correct the astrometry of the HST images, we use four positions of objects (3 stars and 1 cluster elliptical) accurately measured in the Gaia first data release (DR1) catalog (Gaia Collaboration et al., 2016a, b). We also compare the positions of the three quasars used as ALMA phase calibrators, J03482749, J04532807 and J05223627, which are determined by the Gaia DR1 catalog and by phase solutions from our ALMA calibration. We find that the relative offsets between the ALMA and Gaia coordinates are typically mas. All of the HST images are corrected for astrometry on the basis of the Gaia coordinates using the iraf (Tody, 1993) task, ccsetwcs, confirming those two frames coincide with each other down to the accuracy of mas. The resulting centroid of the LBG in the ICRS coordinate is at . We hereafter use this coordinate as the formal position of MACS0416_Y1.
3.3 X-shooter Observations and Reduction
To verify the redshift of MACS0416_Y1 we aimed to detect the redshifted UV emission lines from either Ly, C iv 1548, 1550 Å, C iii] 1907,1909 Å or O iii] 1661, 1666 Å.
We observed MACS0416_Y1 with VLT/X-shooter (Vernet et al., 2011) for a total of 10 hours on target. The observations were carried out at 10 different nights between 2017 December 8 and 2018 January 21 (Program ID: 0100.A-0529(A), PI: Zackrisson). A blind offset from a neighboring star was used to place the slit on the galaxy using the coordinates from HST images. A wide slit was chosen at optical and near-IR wavelengths in order to capture the rest-frame UV emission from the galaxy, and the slit was aligned along the parallactic angles (between 95–100 East of North). The observations were carried out in an ABBA nodding mode pattern with s integrations. During the observations, the sky transmission was clear or photometric and the seeing varied between and , yielding the best possible conditions for detecting faint emission lines.
The data were reduced with esorex scripts (Modigliani et al., 2010) using adjacent positions in the nodding sequence for sky background subtraction. Corrections for telluric absorption lines were applied from models with Molecfit (Kausch et al., 2015) applied to observations of hot stars following the science integrations. Errors were propagated throughout the data processing stpdf. Since the seeing FWHM was smaller than the slit widths, we measured the spectral resolutions from telluric absorption lines, yielding effectively in the near-IR spectra. Observations of spectrophotometric standard stars on each of the 10 nights were used to flux calibrate each spectrum before they were co-added.
4 Results
4.1 Detection of 850 Dust Continuum
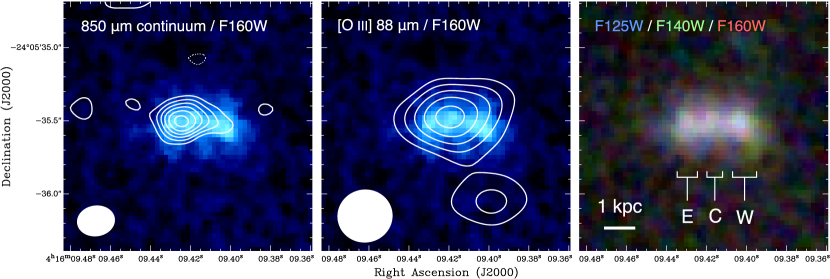
We detect 850- (i.e., rest-frame 90 ) continuum emission at the position of MACS0416_Y1 as shown in Figure 1 (left). The peak ICRS position is . The r.m.s. noise level after combining all of the SPWs is Jy beam-1, yielding the significance of on the resulting image. The flux density and the image component size deconvolved with the synthesized beam are measured using a casa task imfit with an assumption that the source is 2-dimensional Gaussian and are found to be Jy and in FWHM (PA = +84), respectively. This elongation is not likely due to the cluster magnification but the intrinsic shape of the LBG, because its elongation does not align with the lensing shear direction. The overall spatial distribution of the 850 continuum is similar to that of the rest-frame UV emission, while the bulk of dust emission is likely to be associated with the eastern ‘E’ knot (or a gap between the ‘E’ and central ‘C’ knots) seen in the HST/WFC3 image (Figure 1 right).
We also retrieve a previous 1.14 mm imaging result obtained for the MACS J0416.12403 cluster (González-López et al., 2017). No 1.14 mm emission is found with the upper limit of 116 Jy. This places an upper limit on the spectral index between 1.14 mm and 850 to be (2), where is defined such that . Despite a relatively weak constraint, this could rule out a low- interloper with non-thermal emission from an active galactic nucleus, where is expected. Instead, the spectral index is consistent with dust continuum emission with a temperature of K. The observed flux density of Jy corresponds to a de-lensed total IR luminosity of [] and a dust mass of [(] when assuming a dust temperature of K (40 K) and the magnification factor of (see Table 2 for more details).
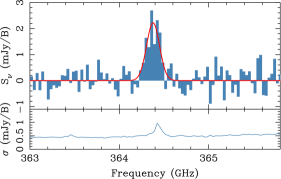
4.2 Blind Detection of [O III] 88
At the position of the dust emission, we detect an emission line feature at GHz, strongly suggesting the [O iii] 88 emission line at (Figure 2). This redshift is slightly lower than, but yet consistent with, the photometric redshifts. This is a rather common feature seen in LBGs in the reionization era (e.g., MACS1149-JD1 Zheng et al., 2017; Hashimoto et al., 2018a); the slight offset is likely due to the fact that the largely-neutral interstellar/intergalactic medium attenuates the edge of Lyman break and makes the photo- estimates higher. Figure 1 (center) shows the integrated intensity image where the [O iii] line is detected at . The intensity peak is associated with the ‘E’–‘C’ clumps seen in the HST/F160W image (Figure 1 right). The apparent flux is Jy km s-1, corresponding to the de-lensed luminosity of . The image may barely be resolved and has a beam-deconvolved size of (PA = ) despite a large uncertainty. The line width is estimated by a Gaussian fit (Figure 3) and is found to be km s-1 in FWHM, which is consistent with those predicted for dark halos hosting a bright () galaxy at in a cosmological hydrodynamic simulation (Shimizu et al., 2014; Inoue et al., 2014a). The line width is also similar to those found in SXDF-NB1006-2 at ( km s-1, Inoue et al., 2016) and MACS1149-JD1 at ( km s-1, Hashimoto et al., 2018a), but broader than that of A2744-YD4 ( km s-1, Laporte et al., 2017). The observed quantities are summarized in Table 2.
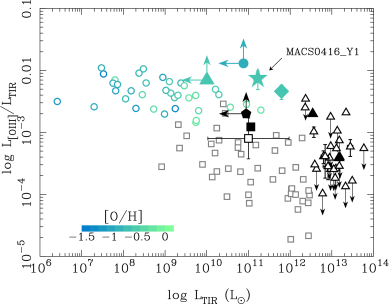
Figure 4 shows the [O iii]-to-IR luminosity ratio, , found in local and high- galaxies as a function of .111Here we assume K for of galaxies for which is unknown. The ratio increases by a factor of 1.5 if assuming K. It is known that the ratios exhibit a possible weak anti-correlation with as suggested by earlier studies of local galaxies (De Looze et al., 2014; Cormier et al., 2015; Díaz-Santos et al., 2017). The of MACS0416_Y1 is estimated to be and is comparable to those found in the Herschel Dwarf Galaxy Survey (, Cormier et al., 2015). The ratio is as high as those found for –9 UV-selected galaxies, such as SXDF-NB1006-2 (, Inoue et al., 2016), MACS1149-JD1 (, Hashimoto et al., 2018a), B14-65666 (, Hashimoto et al., 2018b), BDF-3299 (, Carniani et al., 2017), and A2744_YD4 at (, Laporte et al., 2017), although SXDF-NB1006-2 and MACS1149-JD1 may have much higher values. The ratio of MACS0416_Y1, however, exhibits a sharp contrast to those found in local spirals, ultra-luminous IR galaxies (Herrera-Camus et al., 2018a, b, see the gray open squares in Figure 4), –7 submillimeter galaxies ( or less, Ferkinhoff et al., 2010; Valtchanov et al., 2011; Marrone et al., 2018; Vishwas et al., 2018), and an IR-luminous quasar APM 08279+5255 (, Ferkinhoff et al., 2010).
| K | K | |||||||||
|---|---|---|---|---|---|---|---|---|---|---|
| FWHM$\dagger$$\dagger$footnotemark: | $\sharp$$\sharp$footnotemark: | $\sharp$$\sharp$footnotemark: | $\sharp$$\sharp$footnotemark: | $\sharp$$\sharp$footnotemark: | $\sharp$$\sharp$footnotemark: | |||||
| (Jy) | (arcsec) | () | () | () | () | (Jy km s-1) | (km s-1) | () | ||
Note. — The error represents the 68% confidence interval.
4.3 UV emission line detection limits
The final 2-dimensional spectrum from X-shooter covering near-IR wavelengths at 1–2.4 was inspected for emission lines. At the redshift of [O iii] 88 from ALMA () no rest-frame UV emission lines were detected. Furthermore, no emission lines could be visually identified at other wavelengths. To determine detection limits, we added artificial emission lines with varying FWHM at the expected wavelengths and extracted 1-dimensional spectra and their associated error spectra. To enhance the S/N detection limit, we binned the data in the spectral dimension by varying factors between 3 and 7 pixels (see Watson et al., 2015). To confidently detect an emission line we require a S/N = 5 detection. Table 3 summarizes the detection limits for lines with FWHM ranging from 50 to 150 km s-1 for the brighter of the doublet lines. Since Ly is a resonance line, we also compute the detection limit for a larger width of 250 km s-1. Typical limits are of the order of a few times erg s-1 cm-2. The reported limits have not been corrected for lens magnifications.
| detection limits | |||
|---|---|---|---|
| Lines | 250 km s-1 | 150 km s-1 | 50 km s-1 |
| Ly | |||
| C iv 1548, 1550 Å | |||
| O iii] 1666 Å${\dagger}$${\dagger}$footnotemark: | |||
| C iii] 1907 Å${\dagger}$${\dagger}$footnotemark: | |||
Note. — The detection limits are measured for line widths (FWHM) of 250, 150 and 50 km s-1. The limits are not corrected for magnification. The flux limits are in units of erg s-1 cm-2.
5 Physical Properties of MACS0416_Y1
The ALMA observations clearly show that MACS0416_Y1 has a substantial amount of dust which exhibits a similar spatial distribution to the rest-frame UV emission on a 1 kpc scale. This is somewhat surprising because the UV slope is blue () and earlier studies have actually suggested small dust extinction with (e.g., Laporte et al., 2015). Furthermore, the Spitzer/IRAC photometry shows a red color in the rest-frame optical (; see Table 4). The attribution includes (i) the stellar population with the Balmer break at and (ii) a substantial contribution of the optical [O iii] Å lines to the 4.5 band (e.g., Labbé et al., 2013; Smit et al., 2015). The former case is expected for a relatively-evolved stellar component, while the latter requires a much younger stellar population where OB stars are dominant in luminosity.
| Wavelength | AB magnitude$\dagger$$\dagger$footnotemark: | Flux density$\ddagger$$\ddagger$footnotemark: | ||
|---|---|---|---|---|
| Instrument | () | (mag) | Value | Unit |
| HST/F435W | 0.431 | nJy | ||
| HST/F606W | 0.589 | nJy | ||
| HST/F814W | 0.811 | nJy | ||
| HST/F105W | 1.05 | nJy | ||
| HST/F125W | 1.25 | nJy | ||
| HST/F140W | 1.40 | nJy | ||
| HST/F160W | 1.55 | nJy | ||
| VLT/HAWK-I () | 2.152 | nJy | ||
| Spitzer/IRAC (ch1) | 3.6 | nJy | ||
| Spitzer/IRAC (ch2) | 4.5 | nJy | ||
| ALMA/Band 7 | 850 | … | Jy | |
| ALMA/Band 6 | 1140 | … | Jy | |
Note. — All values are not corrected for cluster lensing magnification.
5.1 Spectral Energy Distribution Model
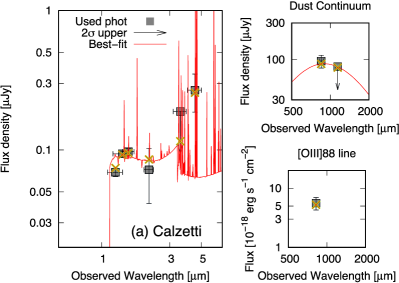
Here we characterize the SED to investigate the physical properties of MACS0416_Y1 by template fits where stellar populations, UV-to-FIR nebular emission, and dust thermal emission are taken into account. We use the photometric data of the 850 continuum and [O iii] line in addition to the rest-frame UV-to-optical bands (Table 4) to model the SED of MACS0416_Y1. The model is based on the prescription presented by Mawatari et al. (2016) and Mawatari et al. in preparation,222Panchromatic Analysis for Nature of HIgh- galaxies Tool (PANHIT), http://www.icrr.u-tokyo.ac.jp/~mawatari/PANHIT/PANHIT.html. where emission components of a stellar continuum (Bruzual & Charlot, 2003), rest-frame UV-to-optical nebular lines (Inoue, 2011a), and dust continuum (Rieke et al., 2009) are accounted for. In addition, we take into account the [O iii] 88 line (Inoue et al., 2014a) and nebular continuum in the UV-to-optical wavelengths Inoue (2011a). We use the stellar population synthesis model from Bruzual & Charlot (2003) with the Chabrier initial mass function (IMF) defined in the range of 0.1–100 (Chabrier, 2003). We assume exponentially declining and rising SFRs expressed as
| (1) |
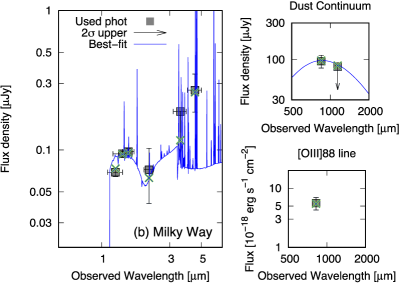
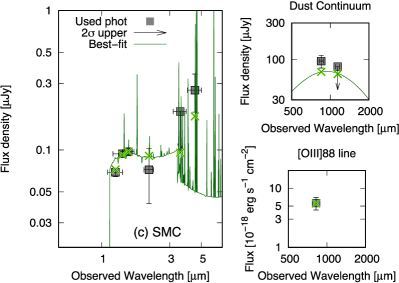
where is the age of the galaxy which ranges from 0.1 Myr to the age of the Universe at , is the -folding time-scale of SFR and is set to , , , and Gyr. The positive and negative time-scales represent declining and rising SFRs, respectively. For rising SFRs (i.e., ), we just fix at to avoid SFRs diverging. We also explore five metallicity values of , 0.0004, 0.004, 0.008, and 0.02 (ranging 1/200–). Three extinction laws from Calzetti et al. (2000), Small Magellanic Cloud (SMC, Prevot et al., 1984; Bouchet et al., 1985) and Milky Way (MW, Fitzpatrick & Massa, 1986, who fit data obtained by Seaton 1979) are employed in the range of –5 to account for dust extinction.
The nebular continuum and lines arising from ionized gas are modeled by relating the Lyman continuum (LyC) photon rate, metallicity and nebular emissivity. The ionizing photon rate is determined for each grid of stellar age and metallicity in the stellar population synthesis model. Following Inoue (2011a), we derive the electron temperature, the nebular continuum emissivity for a unit LyC photon rate, and the nebular line emissivities for a unit H flux, as a function of metallicity. H flux is derived by assuming the case B recombination. The escape fraction of LyC photons, , is treated as a free parameter, while that of Ly photons is fixed to 1. We accordingly attenuate the flux densities at Å by a factor of . We ignored LyC absorption by dust for simplicity. The intergalactic H i transmission model of Inoue et al. (2014b) is also adopted with an extrapolation from to . This simply diminishes the flux below the Ly wavelength including the Ly emission line. For [O iii] 88 , we use the prescription of Inoue et al. (2014a), where the [O iii] emissivity for a unit SFR (i.e., ) is assumed to be modeled as a function of metallicity. This ()-to-metallicity relation is calibrated by ISO, Herschel and AKARI observations of local dwarfs and spirals (Brauher et al., 2008; Kawada et al., 2011; Madden et al., 2013; De Looze et al., 2014; Cormier et al., 2015). We do not use the X-shooter upper limits on the individual UV line fluxes for the model constraint, because the UV line intensities are sensitive to physical properties of ionized media, such as electron density and ionization parameter (e.g., Inoue, 2011a), which could induce large uncertainties in the UV nebular line emissivities.
We compute the 5-to-1000 luminosity for each stellar model grid and extinction by assuming that is equivalent to the luminosity of stellar and nebular emission at 0.01–2.2 absorbed by dust. We then assign an IR-to-millimeter SED for each stellar component and extinction on the basis of . The shapes of the SEDs were determined for local luminous infrared galaxies (LIRGs) and modeled as a function of (Rieke et al., 2009).
| Extinction law | |||
|---|---|---|---|
| Items | Calzetti | MW | SMC |
| 7.1 | 6.8 | 8.4 | |
| Degree of freedom | 3 | 3 | 3 |
| Dust attenuation (mag) | |||
| Age (Myr) | |||
| SFH (Gyr-1)${}^{\sharp}$${}^{\sharp}$footnotemark: | |||
| Metallicity () | |||
| LyC escape fraction | |||
| Stellar mass ()${}^{\dagger}$${}^{\dagger}$footnotemark: | |||
| SFR ( yr-1)${}^{\dagger}$${}^{\dagger}$footnotemark: | |||
| ()${}^{\dagger}$${}^{\dagger}$footnotemark: | |||
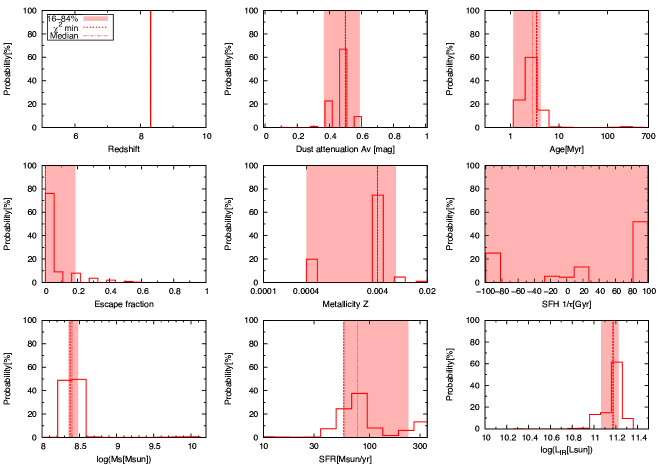
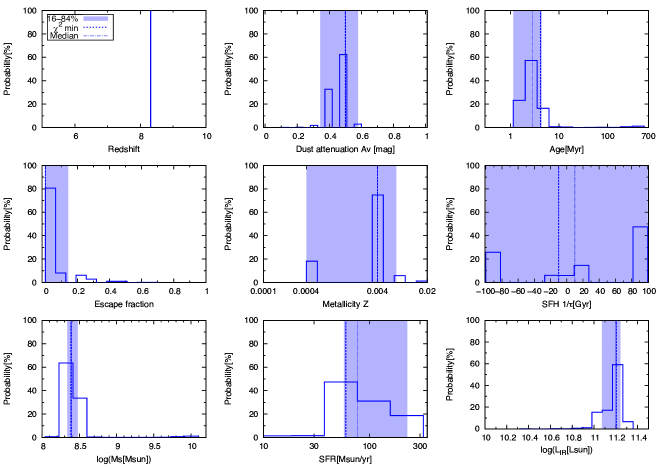
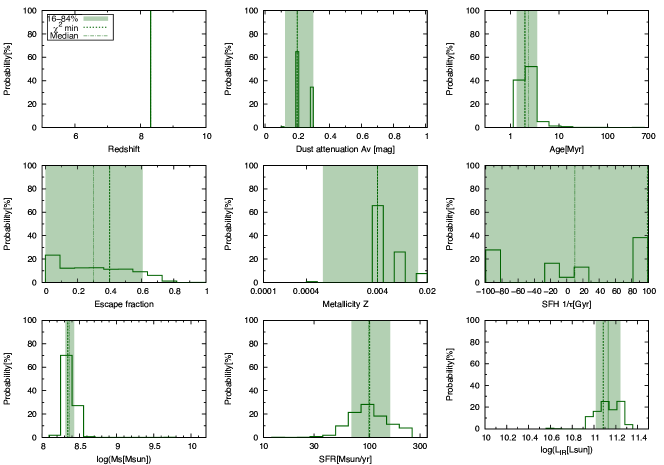
Note. — The error bars represent the 68 confidence interval estimated from probability distribution functions (PDFs) on the basis of a Monte Carlo technique following the prescription presented by Hashimoto et al. (2018a). The probability distributions for the fitting parameters are presented in Appendix A.
5.2 Results
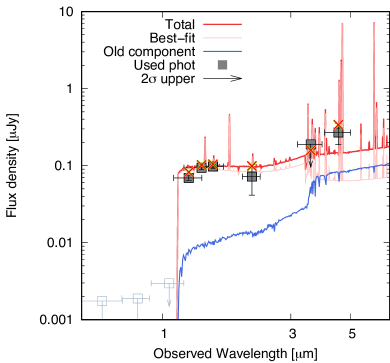
The results are shown in Figure 5 and Table 5333See also Appendix A for the probability distributions for the SED parameters.. One of the important outcomes is that there exist solutions which reasonably explain the large amount of dust coexisting with the young stellar components. Regardless of the extinction law, the SED fits favor a young, high-SFR solution, where large equivalent widths of the enhanced [O iii] 4959, 5007 Å and H lines contribute to the color. The SFR and age are estimated to be yr-1 and Myr, respectively, suggesting that MACS0416_Y1 is at the onset of a starburst phase. The carbonaceous absorption feature of the MW extinction law at Å can explain the blue color, although the predicted flat UV spectrum assuming the Calzetti or SMC law is not ruled out because of a large uncertainty in band photometry. The best-fitting metallicity already reaches at despite a large uncertainty, suggesting rapid enrichment of heavy elements in the middle of the reionization era.
This does not, however, explain how the galaxy has obtained the large amount of dust, even though the SED model explains the energy budget self-consistently if assuming that the dust preexists. The dust-to-stellar mass ratio inferred from the SED fits is . This is 1–2 orders of magnitude higher compared to the median value obtained for 29 local dwarf galaxies from the Herschel Dwarf Galaxy Survey (Madden et al., 2013; Rémy-Ruyer et al., 2015), which is , where the error bar represents the 90 percentile. The ratio would even be an order of magnitude higher than those of dusty star-forming galaxies (e.g., da Cunha et al., 2010; Smith et al., 2012; Clark et al., 2015; De Vis et al., 2017); for instance, a median of is observed for 1402 250- selected normal star-forming galaxies at from the Herschel-ATLAS survey (Smith et al., 2012). These facts suggest that the stellar mass of MACS0416_Y1 could significantly be underestimated if only ongoing star-formation is taken into account, implying the presence of a more massive, evolved stellar population. Note that a very high dust temperature (e.g., K) could only reduce the dust mass by a factor of and does not fully explain the high ratio. The evolved stellar component as a result of past star-formation activity is also expected as the origin of the dust mass, which will be discussed in the following section § 6.
6 Discussions
The stellar SED analysis presented in § 5 has highlighted an extremely-young, star-forming stellar component. The solution also explains the IR luminosity if the dust mass preexists, while it needs to be discussed whether the large dust mass can be attained in the very short duration ( Gyr). The high ratio implies the presence of a more massive, evolved stellar component which does not contribute significantly to the rest-frame UV. However, it is not clear how the evolved component plays a role in dust mass assembly. In this section, we discuss how our current understanding of dust formation and evolution reproduces the dust mass observed in MACS0416_Y1.
6.1 Dust mass evolution model
In the past decade, substantial amounts of dust ranging from to have been identified in the galaxies and quasars (Venemans et al., 2012, 2017; Watson et al., 2015; Laporte et al., 2017; Hashimoto et al., 2018b), which poses a challenge to the current theory of dust formation (Michałowski, 2015). In the local Universe, the origins of dust grains are the stellar winds of asymptotic giant branch (AGB) stars and ejecta of type II supernovae (SNe II), although accretion of gas-phase metal onto the grains should play a dominant role. In fact, grain growth in dense, metal-polluted ISM is considered to be a major contributor to the dust mass in the MW (e.g., Dwek, 1998; Zhukovska et al., 2008; Draine, 2009). Furthermore, processes in diffuse gas, such as dust destruction by SN shocks and shattering by grain collisions, control the effective dust yield per SN and the size distribution (Draine & Salpeter, 1979). In the Universe, SNe II ejecta with a typical dust yield per SN of are claimed to be more important because at least some of intermediate and low-mass stars did not reach the AGB phase. In fact, large dust masses have been reported in some nearby young SN remnants (SNRs), which could explain the high dust yield (e.g., Dunne et al., 2003, 2009; Barlow et al., 2010; Matsuura et al., 2011, 2015; Indebetouw et al., 2014; Gomez et al., 2012; Temim & Dwek, 2013; De Looze et al., 2017), although the other SNRs typically have much smaller dust masses of to (Michałowski, 2015, and references therein). It is likely that the discrepancy is due to the difference in evolutionary phases of SNRs, in which most of dust grains are destroyed by reverse shocks associated with the SN and do not survive in the later SNR phase (Micelotta et al., 2018, and references therein). If this is the case, it dramatically reduces the yield of dust grains per SN compared to previous beliefs. A top-heavy IMF is also claimed to explain a high dust yield per unit SFR (Gall et al., 2011), although this could lead to a higher rate of dust destruction by more frequent SN shocks. In recent years, a microscopic process of grain growth in dense ISM has been studied to overcome the problem of explaining the high- dust reservoirs (e.g. Liffman & Clayton, 1989; Dwek, 1998; Draine, 2009; Jones & Nuth, 2011). In these models, accretion of gas-phase metal onto dust grains becomes more efficient in dense molecular clouds as the ISM is metal-polluted by stellar ejecta and eventually increases the dust mass for fixed SFR (e.g. Asano et al., 2013a; Zhukovska, 2014), allowing one to require neither extreme dust yield per SN nor unusual IMFs.
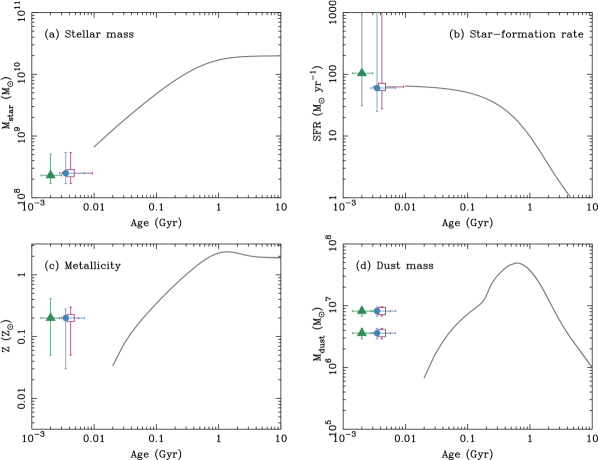
Here we employ a dust formation model developed by Asano et al. (2013a, b, 2014) and Nozawa et al. (2015) to assess if the dust mass observed in MACS0416_Y1 is reproduced in the stellar age of Myr. In this model, time evolution of masses of stars, ISM, metal and dust are solved by 4 independent equations in which SFR, dust injection into (ejection from) stars, dust destruction by SNe, grain growth in dense ISM are considered. The formation and destruction of dust grains are assumed to be processed in three phases of ISM; warm neutral media (WNM, K, cm-3), cold neutral media (CNM, K, cm-3) and molecular clouds (MC, K, cm-3). We assume the mass fractions of WNM, CNM and MC to be following Nozawa et al. (2015). We use the IMF from Chabrier (2003). The star formation time-scale is set to = 0.3 Gyr, which is well within the 68% confidence intervals of the best-fitting (Table 5). The total baryon mass is scaled to such that the model stellar mass and SFR at the galaxy age of 4 Myr roughly match the best-fitting values and , respectively (Table 5). Note that except this scaling, we made no parameter optimization nor fine-tuning with respect to the best-fitting values obtained by the SED fits.
The results are shown in Figure 6. Although the model does not compute the physical properties at the earliest ages ( Gyr), the predicted stellar mass and SFR extrapolated from the dust evolution model with a single episode of star-formation (Figure 6a, b) are well aligned with the results from the SED analysis. The predicted metallicity is, however, much lower (Figure 6d), suggesting that the ISM fed to ongoing star formation is already metal-polluted by past star formation.
Furthermore, the model fails to reproduce the dust mass (Figure 6d) if assuming that the observed would be produced by the ongoing star formation traced by the rest-frame UV continuum and the [O iii] 88 line. At the age of Gyr, the predicted metallicity and dust mass increase almost linearly with increasing the cumulative number of SNe II. At Gyr, the ISM is sufficiently metal-polluted and triggers a rapid interstellar growth of dust grains, resulting in non-linear evolution of at = 0.3 Gyr. The dust mass evolution peaks at Gyr and gives (similar to low- normal star-forming galaxies, see also § 5.2), which is followed by a decrement due to grain consumption for star-formation at Gyr. The galaxy age of Myr is too short to reproduce the observed , and any reasonable modification of the model cannot explain the dust mass.
6.2 Potential co-existence of an evolved stellar component
Obviously, the disagreement discussed above should be mitigated if assuming the presence of an underlying ‘old’ stellar component assembled in a past star-formation activity. In what follows, we show that there is at least one solution which reasonably explains the physical properties required to reproduce the observed dust mass without any substantial change in the SED shape.
As for a single episode of star-formation starting with zero metallicity, the time-evolution of metallicity only depends on the elapsed time since the episode started. From Figure 6c, the past star-formation lasting for Gyr is necessary to reach . The dust evolution model also predicts that an initial gas mass of will produce a dust mass of in 0.1 Gyr. This stellar population has a virtually-constant SFR of yr-1 for the duration of 0.1 Gyr and attains a stellar mass of .
This massive, old stellar component does not conflict with the best-fitting SED (§ 5.2), if the old component has stopped the star-formation activity at a certain point of time in the past and then has been passively evolving for a time duration comparable to the lifetimes of OB stars ( Gyr). Figure 7 shows the predicted SED of the old component with built by constant star-formation starting 0.3 Gyr ago and lasting for 0.1 Gyr, which exhibits the Balmer break due to the lack of OB stars. The UV continuum of the old component is much fainter than that of the best-fit stellar component presented in § 5.2, suggesting that the addition of the old component does not substantially change the stellar SED in the rest-frame UV-to-optical. A similar star formation history is advocated to account for an excess in the rest-frame optical observed in MACS1149-JD (Hashimoto et al., 2018a) or the presence of dust in B14-65666 (Hashimoto et al., 2018b). Therefore, it is likely that the mature (the age of Gyr) stellar population with no or little ongoing star-formation may be the origin of the very early enrichment of metal and dust.
7 Conclusions
We report the ALMA detections of the [O iii] 88 line and the 850 dust continuum emission in the Y-dropout LBG MACS0416_Y1 located behind the Frontier Field cluster MACS J0416.12403. Four independent tunings of ALMA were assigned to cover the contiguous frequency range between 340.0 and 366.4 GHz (a bandwidth of 26.4 GHz, corresponding to the redshift interval of around ), which reveals the spectroscopic redshift of . The observed 850 flux of Jy corresponds to the intrinsic IR luminosity of if assuming the dust temperature of K and an emissivity index of , suggesting the fast assembly of a dust mass of when the age of the Universe was 600 Myr. The [O iii] flux and the de-lensed luminosity are Jy km s-1 and , respectively. The inferred [O iii]-to-IR luminosity ratio of is comparable to those found in local dwarf galaxies, even if the uncertainty in dust temperature is taken into account. The rest-frame UV-to-FIR SED modeling where the [O iii] emissivity model is incorporated suggests the presence of a young, but moderately metal-polluted stellar component with , , Myr. The analytic dust mass evolution model with Gyr, where interstellar grain growth and destruction are fully accounted for, does not reproduce the metallicity and the dust mass in a galaxy age of Myr, suggesting the presence of a past star-formation episode as the origin of dust. We show that if a stellar population with past star formation triggered 0.3 Gyr ago and lasting for 0.1 Gyr is taken into account, it reproduces the metallicity and the dust mass without any substantial change in the observed stellar SED.
Obviously, the ionized and neutral ISM in MACS0416_Y1 are yet to be characterized completely. The rest-frame FIR and optical fine-structure lines such as [C ii] 158 , [O i] 146 and [N ii] 122/205 , [O iii] 52 and 4959/5007 Å, in addition to multi-wavelength photometry of the continuum emission, will offer a unique opportunity for the better understanding of the fundamental processes of metal/dust enrichment and star-formation activity in MACS0416_Y1. Future ALMA and JWST observations of them will allow this to be investigated further.
Appendix A The probability distribution functions of SED fitting parameters
Figures 8, 9 and 10 show the probability distribution functions (PDFs) for the SED fitting parameters. See § 5.2 for details.
References
- Asano et al. (2013a) Asano, R. S., Takeuchi, T. T., Hirashita, H., & Inoue, A. K. 2013a, Earth, Planets, and Space, 65, 213
- Asano et al. (2013b) Asano, R. S., Takeuchi, T. T., Hirashita, H., & Nozawa, T. 2013b, MNRAS, 432, 637
- Asano et al. (2014) Asano, R. S., Takeuchi, T. T., Hirashita, H., & Nozawa, T. 2014, MNRAS, 440, 134
- Barlow et al. (2010) Barlow, M. J., Krause, O., Swinyard, B. M., et al. 2010, A&A, 518, L138
- Bouchet et al. (1985) Bouchet, P., Lequeux, J., Maurice, E., Prevot, L., & Prevot-Burnichon, M. L. 1985, A&A, 149, 330
- Bouwens et al. (2015) Bouwens, R. J., Illingworth, G. D., Oesch, P. A., et al. 2015, ApJ, 803, 34
- Brammer et al. (2016) Brammer, G. B., Marchesini, D., Labbé, I., et al. 2016, ApJS, 226, 6
- Brauher et al. (2008) Brauher, J. R., Dale, D. A., & Helou, G. 2008, ApJS, 178, 280-301
- Bruzual & Charlot (2003) Bruzual, G., & Charlot, S. 2003, MNRAS, 344, 1000
- Calzetti et al. (2000) Calzetti, D., Armus, L., Bohlin, R. C., et al. 2000, ApJ, 533, 682
- Castellano et al. (2016) Castellano, M., Amorín, R., Merlin, E., et al. 2016, A&A, 590, A31
- Carniani et al. (2017) Carniani, S., Maiolino, R., Pallottini, A., et al. 2017, A&A, 605, A42
- Chabrier (2003) Chabrier, G. 2003, PASP, 115, 763
- Clark et al. (2015) Clark, C. J. R., Dunne, L., Gomez, H. L., et al. 2015, MNRAS, 452, 397
- Cormier et al. (2015) Cormier, D., Madden, S. C., Lebouteiller, V., et al. 2015, A&A, 578, A53
- da Cunha et al. (2010) da Cunha, E., Eminian, C., Charlot, S., & Blaizot, J. 2010, MNRAS, 403, 1894
- da Cunha et al. (2013) da Cunha, E., Groves, B., Walter, F., et al. 2013, ApJ, 766, 13
- De Looze et al. (2014) De Looze, I., Cormier, D., Lebouteiller, V., et al. 2014, A&A, 568, A62
- De Looze et al. (2017) De Looze, I., Barlow, M. J., Swinyard, B. M., et al. 2017, MNRAS, 465, 3309
- De Vis et al. (2017) De Vis, P., Dunne, L., Maddox, S., et al. 2017, MNRAS, 464, 4680
- Díaz-Santos et al. (2017) Díaz-Santos, T., Armus, L., Charmandaris, V., et al. 2017, ApJ, 846, 32
- Draine & Salpeter (1979) Draine, B. T., & Salpeter, E. E. 1979, ApJ, 231, 438
- Draine (2009) Draine, B. T. 2009, Cosmic Dust - Near and Far, 414, 453
- Dunne et al. (2003) Dunne, L., Eales, S., Ivison, R., Morgan, H., & Edmunds, M. 2003, Nature, 424, 285
- Dunne et al. (2009) Dunne, L., Maddox, S. J., Ivison, R. J., et al. 2009, MNRAS, 394, 1307
- Dwek (1998) Dwek, E. 1998, ApJ, 501, 643
- Ferkinhoff et al. (2010) Ferkinhoff, C., Hailey-Dunsheath, S., Nikola, T., et al. 2010, ApJ, 714, L147
- Fitzpatrick & Massa (1986) Fitzpatrick, E. L., & Massa, D. 1986, ApJ, 307, 286
- Gaia Collaboration et al. (2016a) Gaia Collaboration, Brown, A. G. A., Vallenari, A., et al. 2016a, A&A, 595, A2
- Gaia Collaboration et al. (2016b) Gaia Collaboration, Prusti, T., de Bruijne, J. H. J., et al. 2016b, A&A, 595, A1
- Gall et al. (2011) Gall, C., Hjorth, J., & Andersen, A. C. 2011, A&A Rev., 19, 43
- Gomez et al. (2012) Gomez, H. L., Krause, O., Barlow, M. J., et al. 2012, ApJ, 760, 96
- González-López et al. (2017) González-López, J., Bauer, F. E., Romero-Cañizales, C., et al. 2017, A&A, 597, A41
- Hashimoto et al. (2018a) Hashimoto, T., Laporte, N., Inoue, A. K., et al. 2018a, Nature, 557, 392.
- Hashimoto et al. (2018b) Hashimoto, T., Inoue, A. K., Mawatari, K., et al. 2018b, arXiv:1806.00486
- Hashimoto et al. (2018c) Hashimoto, T., Inoue, A. K., Tamura, Y., et al. 2018c, arXiv:1811.00030
- Herrera-Camus et al. (2018a) Herrera-Camus, R., Sturm, E., Graciá-Carpio, J., et al. 2018a, ApJ, 861, 94
- Herrera-Camus et al. (2018b) Herrera-Camus, R., Sturm, E., Graciá-Carpio, J., et al. 2018b, ApJ, 861, 95
- Infante et al. (2015) Infante, L., Zheng, W., Laporte, N., et al. 2015, ApJ, 815, 18
- Indebetouw et al. (2014) Indebetouw, R., Matsuura, M., Dwek, E., et al. 2014, ApJ, 782, L2
- Inoue (2011a) Inoue, A. K. 2011a, MNRAS, 415, 2920
- Inoue (2011b) Inoue, A. K. 2011b, Earth, Planets, and Space, 63, 1027
- Inoue et al. (2014a) Inoue, A. K., Shimizu, I., Tamura, Y., et al. 2014a, ApJ, 780, L18
- Inoue et al. (2014b) Inoue, A. K., Shimizu, I., Iwata, I., & Tanaka, M. 2014b, MNRAS, 442, 1805
- Inoue et al. (2016) Inoue, A. K., Tamura, Y., Matsuo, H., et al. 2016, Science, 352, 1559
- Ishigaki et al. (2018) Ishigaki, M., Kawamata, R., Ouchi, M., et al. 2018, ApJ, 854, 73
- Ivison et al. (2010) Ivison, R. J., Swinbank, A. M., Swinyard, B., et al. 2010, A&A, 518, L35
- Kausch et al. (2015) Kausch, W., Noll, S., Smette, A., et al. 2015, A&A, 576, A78
- Kawada et al. (2011) Kawada, M., Takahashi, A., Yasuda, A., et al. 2011, PASJ, 63, 903
- Kawamata et al. (2016) Kawamata, R., Oguri, M., Ishigaki, M., Shimasaku, K., & Ouchi, M. 2016, ApJ, 819, 114
- Jones & Nuth (2011) Jones, A. P., & Nuth, J. A. 2011, A&A, 530, A44
- Labbé et al. (2013) Labbé, I., Oesch, P. A., Bouwens, R. J., et al. 2013, ApJ, 777, L19
- Laporte et al. (2015) Laporte, N., Streblyanska, A., Kim, S., et al. 2015, A&A, 575, A92
- Laporte et al. (2016) Laporte, N., Infante, L., Troncoso Iribarren, P., et al. 2016, ApJ, 820, 98
- Laporte et al. (2017) Laporte, N., Ellis, R. S., Boone, F., et al. 2017, ApJ, 837, L21
- Liffman & Clayton (1989) Liffman, K., & Clayton, D. D. 1989, ApJ, 340, 853
- Lotz et al. (2017) Lotz, J. M., Koekemoer, A., Coe, D., et al. 2017, ApJ, 837, 97
- Madden et al. (2012) Madden, S. C., Rémy, A., Galliano, F., et al. 2012, The Spectral Energy Distribution of Galaxies - SED 2011, 284, 141
- Madden et al. (2013) Madden, S. C., Rémy-Ruyer, A., Galametz, M., et al. 2013, PASP, 125, 600
- Mainali et al. (2018) Mainali, R., Zitrin, A., Stark, D. P., et al. 2018, arXiv:1804.00041
- Maiolino et al. (2015) Maiolino, R., Carniani, S., Fontana, A., et al. 2015, MNRAS, 452, 54
- Marrone et al. (2018) Marrone, D. P., Spilker, J. S., Hayward, C. C., et al. 2018, Nature, 553, 51
- Matsuura et al. (2011) Matsuura, M., Dwek, E., Meixner, M., et al. 2011, Science, 333, 1258
- Matsuura et al. (2015) Matsuura, M., Dwek, E., Barlow, M. J., et al. 2015, ApJ, 800, 50
- Mawatari et al. (2016) Mawatari, K., Yamada, T., Fazio, G. G., Huang, J.-S., & Ashby, M. L. N. 2016, PASJ, 68, 46
- McLeod et al. (2015) McLeod, D. J., McLure, R. J., Dunlop, J. S., et al. 2015, MNRAS, 450, 3032
- McMullin et al. (2007) McMullin, J. P., Waters, B., Schiebel, D., Young, W., & Golap, K. 2007, Astronomical Data Analysis Software and Systems XVI, 376, 127
- Micelotta et al. (2018) Micelotta, E. R., Matsuura, M., & Sarangi, A. 2018, Space Sci. Rev., 214, #53
- Michałowski (2015) Michałowski, M. J. 2015, A&A, 577, A80
- Modigliani et al. (2010) Modigliani, A., Goldoni, P., Royer, F., et al. 2010, Proc. SPIE, 7737, 773728
- Nozawa et al. (2015) Nozawa, T., Asano, R. S., Hirashita, H., & Takeuchi, T. T. 2015, MNRAS, 447, L16
- Oesch et al. (2016) Oesch, P. A., Brammer, G., van Dokkum, P. G., et al. 2016, ApJ, 819, 129
- Oesch et al. (2018) Oesch, P. A., Bouwens, R. J., Illingworth, G. D., Labbé, I., & Stefanon, M. 2018, ApJ, 855, 105
- Planck Collaboration et al. (2018) Planck Collaboration, Aghanim, N., Akrami, Y., et al. 2018, arXiv:1807.06209
- Postman et al. (2012) Postman, M., Coe, D., Benítez, N., et al. 2012, ApJS, 199, 25
- Prevot et al. (1984) Prevot, M. L., Lequeux, J., Maurice, E., Prevot, L., & Rocca-Volmerange, B. 1984, A&A, 132, 389
- Rémy-Ruyer et al. (2015) Rémy-Ruyer, A., Madden, S. C., Galliano, F., et al. 2015, A&A, 573, C1
- Rieke et al. (2009) Rieke, G. H., Alonso-Herrero, A., Weiner, B. J., et al. 2009, ApJ, 692, 556
- Seaton (1979) Seaton, M. J. 1979, MNRAS, 187, 73P
- Shimizu et al. (2014) Shimizu, I., Inoue, A. K., Okamoto, T., & Yoshida, N. 2014, MNRAS, 440, 731
- Smith et al. (2012) Smith, D. J. B., Dunne, L., da Cunha, E., et al. 2012, MNRAS, 427, 703
- Smit et al. (2015) Smit, R., Bouwens, R. J., Franx, M., et al. 2015, ApJ, 801, 122
- Stark et al. (2015a) Stark, D. P., Richard, J., Charlot, S., et al. 2015a, MNRAS, 450, 1846
- Stark et al. (2015b) Stark, D. P., Walth, G., Charlot, S., et al. 2015b, MNRAS, 454, 1393
- Stark (2016) Stark, D. P. 2016, ARA&A, 54, 761
- Stark et al. (2017) Stark, D. P., Ellis, R. S., Charlot, S., et al. 2017, MNRAS, 464, 469
- Takami et al. (1987) Takami, H., Maihara, T., Mizutani, K., et al. 1987, PASP, 99, 832
- Temim & Dwek (2013) Temim, T., & Dwek, E. 2013, ApJ, 774, 8
- Tody (1993) Tody, D. 1993, Astronomical Data Analysis Software and Systems II, 52, 173
- Valtchanov et al. (2011) Valtchanov, I., Virdee, J., Ivison, R. J., et al. 2011, MNRAS, 415, 3473
- Venemans et al. (2012) Venemans, B. P., McMahon, R. G., Walter, F., et al. 2012, ApJ, 751, L25
- Venemans et al. (2017) Venemans, B. P., Walter, F., Decarli, R., et al. 2017, ApJ, 851, L8
- Vernet et al. (2011) Vernet, J., Dekker, H., D’Odorico, S., et al. 2011, A&A, 536, A105
- Vishwas et al. (2018) Vishwas, A., Ferkinhoff, C., Nikola, T., et al. 2018, ApJ, 856, 174
- Watson et al. (2015) Watson, D., Christensen, L., Knudsen, K. K., et al. 2015, Nature, 519, 327
- Walter et al. (2018) Walter, F., Riechers, D., Novak, M., et al. 2018, arXiv:1811.12836
- Weingartner & Draine (2001) Weingartner, J. C., Draine, B. T. 2001, ApJ, 548, 296
- Zheng et al. (2017) Zheng, W., Zitrin, A., Infante, L., et al. 2017, ApJ, 836, 210
- Zhukovska et al. (2008) Zhukovska, S., Gail, H.-P., & Trieloff, M. 2008, A&A, 479, 453
- Zhukovska (2014) Zhukovska, S. 2014, A&A, 562, A76
- Zitrin et al. (2015a) Zitrin, A., Ellis, R. S., Belli, S., & Stark, D. P. 2015a, ApJ, 805, L7
- Zitrin et al. (2015b) Zitrin, A., Labbé, I., Belli, S., et al. 2015b, ApJ, 810, L12