Departure from the Wiedemann-Franz Law in WP2 Driven by Mismatch in T-square Resistivity Prefactors
Abstract
The Wiedemann-Franz (WF) law establishes a link between heat and charge transport due to electrons in solids. The extent of its validity in presence of inelastic scattering is a question raised in different contexts. We report on a study of the electrical, , and thermal, , conductivities in WP2 single crystals. The WF holds at 2 K, but a downward deviation rapidly emerges upon warming. At 13 K, there is an exceptionally large mismatch between Lorenz number and the Sommerfeld value. We show that this is driven by a fivefold discrepancy between the -square prefactors of electrical and thermal resistivities, both caused by electron-electron scattering. This implies the existence of abundant small-scattering-angle collisions between electrons, due to strong screening. By quantifying the relative frequency of collisions conserving momentum flux, but degrading heat flux, we identify a narrow temperature window where the hierarchy of scattering times may correspond to the hydrodynamic regime.
I Introduction
The electrical conductivity of a metal and its thermal counterpart are linked to each other by the Wiedemann-Franz (WF) law, provided that the heat carried by phonons is negligible and electrons do not suffer inelastic scattering. This law states that the ratio of the two conductivities divided by temperature should be equal to a universal number set by fundamental constants. The validity of the WF law is expected both at very low temperatures, where elastic scattering by disorder dominates, and above the Debye temperature, where scattering by phonons becomes effectively elastic. At intermediate temperatures, inelastic scattering is known to degrade thermal current more efficiently than the electrical current Ziman (1972). Experiments have found a zero-temperature validity combined to a downward departure in elemental metals (due to electron-phonon scattering) White and Tainsh (1960); Yao et al. (2017) as well as in correlated metals (because of electron-electron scattering) Paglione et al. (2005); Lussier et al. (1994). During the past decade, the search for a possible breakdown of the WF law near a quantum critical point Pfau et al. (2012) motivated high-resolution experiments, which verified its zero-temperature validity within experimental margin and quantified the deviation at finite temperature Seyfarth et al. (2008); Machida et al. (2013); Reid et al. (2014); Taupin et al. (2015).
Gooth et al. Gooth et al. (2018) have recently reported on thermal transport in micrometric samples of WP2 down to 5K and found a drastic breakdown of the WF law. WP2 is a type-II Weyl semimetal with a room-temperature Residual Resistivity Ratio (RRR) expressed in five digits and an impressively large magnetoresistance Kumar et al. (2017). The observation raised fundamental questions regarding the relevance of the scattering-based theory of charge and entropy transport by mobile electrons to this non-trivial solid. The possible link between WF breakdown and electron hydrodynamics is a subject of attention Galitski et al. (2018); Lucas et al. (2016); Principi and Vignale (2015); Lucas and Das Sarma (2018); Coulter et al. (2018).
In this paper, we present a study of thermal conductivity in bulk millimetric single crystals of WP2. By performing concomitant measurements of thermal and electrical transport between 2K and 40K, we find that: (i) The WF law is obeyed at 2K, but a drastic downward deviation of exceptional amplitude emerges at higher temperatures; (ii) Thanks to the low-temperature data, one can distinguish between the contributions to the thermal and electrical resistivities arising from electron-electron and electron-phonon scattering; iii) The downward deviation arises because of a large (fivefold) difference between the amplitudes of the T-square prefactors in the two (electrical and thermal) resistivities due to electron-electron scattering. We conclude that electron-electron scattering is the origin of the exceptionally large downward deviation from the Wiedemann-Franz law. This can happen if small-angle momentum-relaxing scattering events are unusually frequent. Thus, the semi-classical transport theory is able to explain a large mismatch between Lorenz number and Sommerfeld number at finite temperature. However, the large T-square thermal resistivity caused by momentum-conserving scattering among electrons, together with the long mean-free-path of the electrons, opens a window for entering into the hydrodynamic regime.
II Results
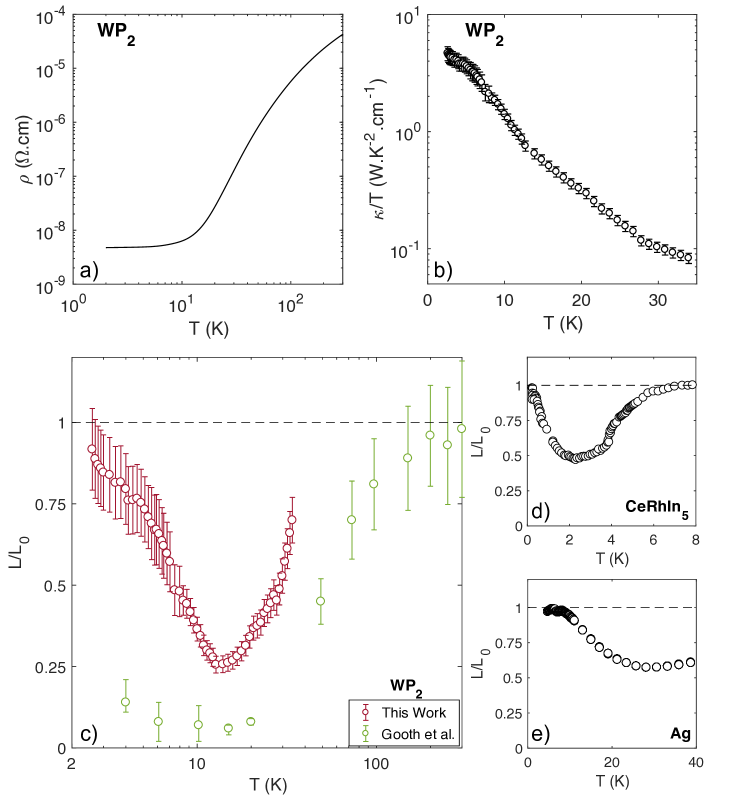
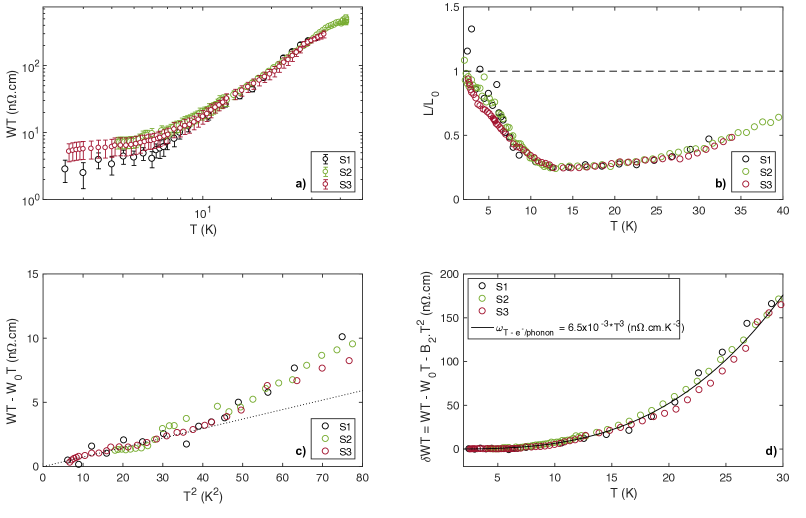
Fig.1.a shows the resistivity as a function of temperature in a WP2 single crystal. The RRR for this sample is . The residual resistivity of the different samples was found to lie between 4 and 6 n.cm. With a carrier density of cm-3 Gooth et al. (2018), this implies a mean-free-path in the range of 70 to 140 m, and, given the dimensions of the sample, a proximity to the ballistic limit.
The temperature dependence of , the thermal conductivity divided by temperature, is plotted in panel (b) of the Figure 1. Note that in our whole temperature range of study, the phonon contribution to heat transport is negligible (See the Supplemental Material). The extracted Lorenz number, , is to be compared with the Sommerfeld number . As seen in Fig.1.c, according to our data, is close to 0.5 at 40K and decreases with decreasing temperature until it becomes as low as 0.25 at 13K, in qualitative agreement with the observation originally reported by Gooth et al. Gooth et al. (2018), who first reported on a very low magnitude of the ratio in WP2. As seen in the Figure 1.c, however, the two sets of data diverge at low temperature and we recover the expected equality between and at low temperature.
Comparison with two other metals, Ag and CeRhIn5, is instructive. Fig.1.d displays the temperature dependence of L/L0 in the heavy fermion antiferromagnet, CeRhIn5 as reported by Paglione et al. Paglione et al. (2005). The ratio, close to unity at 8K, decreases with decreasing temperature and becomes as low as 0.5 at 2K, before shooting upwards and attaining unity around 100mK. In Ag, as seen in Fig.1.e, which presents our data obtained on a silver wire, a similar downward deviation of the L/L0 ratio is detectable. Close to unity below 8K, it decreases with warming and attains a minimum of 0.6 at 30K before increasing again.
It is also instructive to recall the case of semi-metallic bismuth, in which thermal transport is dominated by phonons. In such a compensated system, an ambipolar contribution to the thermal conductivity, arising from a counter-flow of heat-carrying electrons and holes, was expected to be present Uher and Goldsmid (1974); Korenblit et al. (1969). An ambipolar diffusion would have led to an upward deviation of L/L0 from unity. However, Uher and Goldsmid Uher and Goldsmid (1974) found (after subtracting the lattice contribution) that L/L in bismuth, which indicates that there is no ambipolar contribution to the thermal conductivity. The absence of a significant phononic contribution in our data makes the interpretation even more straightforward, and we also find no evidence for ambipolar heat transport in WP2. The reason is that the electron and hole gases are degenerate both in Bi (below room temperature) and WP2 (for all temperatures of interest), and thus the ambipolar contribution is small in proportion to .
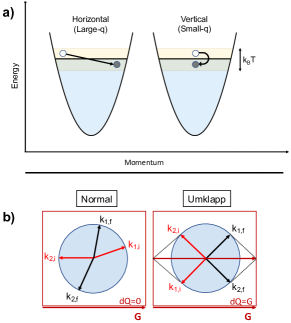
The scattering-based Boltzmann picture provides an explanation for such downward deviations. Thermal and electrical transport are affected in different ways by inelastic collisions labeled as “horizontal” and “vertical” (See Fig.2.a). In a horizontal scattering event, the change in the energy of the scattered carrier is accompanied by a drastic change of its momentum. Such a large-q process degrades both charge and heat currents. A vertical process, on the other hand, is a small-q scattering event, which marginally affects the carrier momentum, but modifies its energy as strongly as a horizontal process of similar intensity. In the case of momentum transport, the presence of a (1-) pondering factor disfavors small angle scattering. No such term exists for energy transport. This unequal importance of vertical events for electrical and thermal conductivities, pulls down the ratio at finite temperature and generates a finite-temperature breakdown of the Wiedemann-Franz law Ziman (1972). Such a behavior was observed in high-purity Cu half a century ago White and Tainsh (1960), in other elements, such as Al and Zn Yao et al. (2017), in heavy-fermion metals such as UPt3 Lussier et al. (1994), CeRhIn5 Paglione et al. (2005) or CeCoIn5 Seyfarth et al. (2008) as well as in magnetically-ordered elements like Ni White and Tainsh (1967) or Co Shiomi et al. (2010).
On the microscopic level, two distinct types of vertical scattering have been identified. The first is electron-phonon scattering Ziman (1972), relevant in elemental metals. At low-temperatures, the Bloch-Grüneisen picture of electron-phonon scattering yields a electric resistivity and a thermal resistivity. The higher exponent for charge transport is due to the variation of the typical wave-vector of the thermally-excited phonons with temperature: . Small-angle phonon-scattering becomes more frequent with cooling. Therefore, phonons’ capacity to degrade a momentum current declines faster than their ability to impede energy transport. This power-law difference leads to in the intermediate temperature window (below the Debye temperature), when phonon scattering dominates over impurity scattering, but all phonons are not thermally excited. A second source of q-selectivity concerns momentum relaxing electron-electron scattering (See Fig.2.b). The quadratic temperature dependence of resistivity in a Fermi liquid is a manifestation of such scattering Pal and Maslov (2012). This is because the phase space for collision between two fermionic quasi-particles scales with the square of temperature. Since the total momentum before and after collision is conserved, electron-electron collisions degrade the flow of momentum only when the scattering is accompanied by losing part of the total momentum to the lattice. Two known ways for such a momentum transfer are often invoked Lin et al. (2015). The first is Baber mechanism, in which electrons exchanging momentum belong to two distinct reservoirs and have different masses. The second is an Umklapp process, where the change in the momentum of the colliding electrons is accompanied by the loss of one reciprocal lattice wave-vector (Fig.2.b). Abundant small-angle electron-electron scattering (which could be either Umklapp or Baber-like) would generate a mismatch in prefactors of the -square resistivities with the electrical prefactor lower than the thermal one. This is a second route towards , prominent in correlated metals Herring (1967); Bennett and Rice (1969).
In order to determine what set of microscopic collisions causes the downward deviation from the WF law in WP2, we identified and quantified various contributions to the thermal and electrical resistivities of the system.
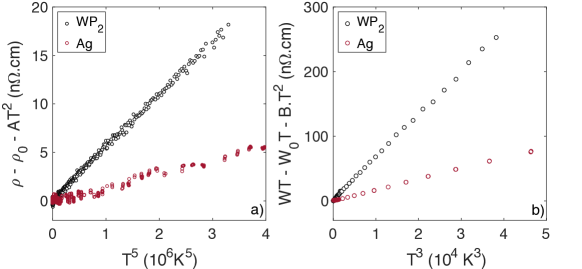
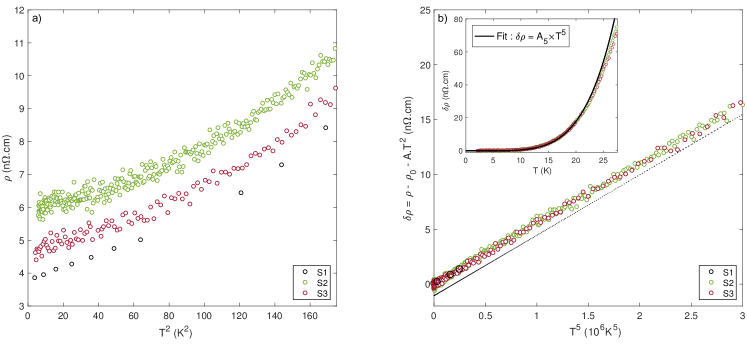
Fig.3 shows the electrical resistivity, , and thermal resistivity, , as a function of . In order to keep the two resistivities in the same units and comparable to each other, we define , as in reference Paglione et al. (2005). One can see that at low temperatures, the temperature-induced increase in and is linear in , confirming the presence of a -square component in both quantities. The intercept is equal in both plots, which means that the WF law is valid in the zero-temperature limit. But the two slopes are different and the deviation from the low-temperature quadratic behavior occurs at different temperatures and in different fashions.
III Discussion
Admitting three distinct contributions (scattering by defects, electrons and phonons) to the electrical and thermal resistivities, the expressions for and become:
| (1) |
| (2) |
We assume these scattering mechanisms to be additive. Note that since the data are limited to a temperature window in which , no Altshuler-Aronov corrections are expected Zala et al. (2001). As seen above, , but . The insets in Fig.3 show that is linear in and is proportional to , in agreement with what is expected from equations (1) and (2).
It is now instructive to compare WP2 and Ag to examine the possible role played by inelastic phonon scattering. Fig.4 compares the amplitude of the terms in WP2 and Ag. As seen in the Figure 4, the amplitude of both and is larger in WP2. More quantitatively, (WP2)/(Ag)3.4 and (WP2)/(Ag)3.6. In other words, the and ratios of WP2 and Ag are similar in magnitude, which implies that phonon scattering is not the origin of the unusually low magnitude of the Lorenz number in WP2.
Having ruled out a major role played by phonon scattering in setting the low magnitude of , let us turn our attention to electron-electron scattering. As stated above, the prefactors of the T-square terms in and , namely and , are unequal. The ratio / is as low as 0.22, well below what was observed in other metals, such as CeRhIn5 (/) Paglione et al. (2005), UPt3 (/) Lussier et al. (1994), or nickel (/) White and Tainsh (1967). This feature, which pulls down the magnitude of the ratio in WP2, may be due to unusually abundant vertical events (involving a small change in the wave-vector of one of the colliding electrons), which could be either Umklapp or inter-band involving collisions between hole-like and electron-like carriers belonging to different pockets.
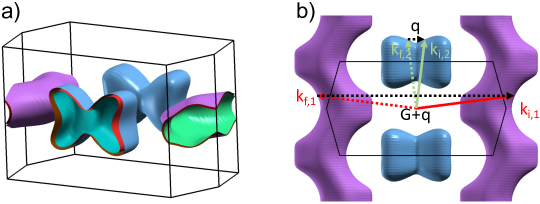
To have electron-electron collisions which are simultaneously small-angle, Umklapp and intra-band, one needs a Fermi surface component located at the zone boundary Maslov et al. (2011). Interestingly, as seen in Fig.5, this is the case of WP2. The figure shows the Fermi surface obtained by our DFT calculations (See supplement), consistent with previous reports Razzoli et al. (2018); Schönemann et al. (2017). It is composed of 2 hole-like and 2 electron-like pockets, each located at the boundary of the Brillouin zone. Such a configuration allows abundant intra-band low-q Umklapp scattering. According to previous theoretical calculations Herring (1967); Bennett and Rice (1969), the weight of small-angle scattering can pull down the / (and the L/L0) ratio. However, the lowest number found by these theories (0.38) is well above what was found here by our experiment on WP2 (/), as well as what was reported long ago in the case of tungsten Wagner et al. (1971) (See the supplement).
Following the present experimental observation, Li and Maslov showed Li and Maslov that in a compensated metal with a long-range Coulomb interaction among the charge carriers, the Lorenz ratio is given by
| (3) |
where is the (inverse) screening length and is the (common) Fermi momentum of the electron and hole pockets. By assumption, and thus can be arbitrarily small in this model.
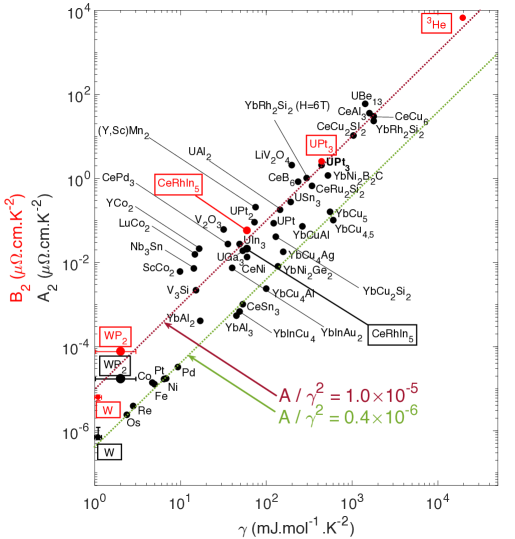
Let us now turn our attention to the possibility that WP2 enters the hydrodynamic regime Gooth et al. (2018). In order to address this question, let us first recall what is known in the case of normal-liquid 3He. The latter presents a thermal conductivity inversely proportional to temperature Greywall (1984) (strictly equivalent to our being proportional to ) and a viscosity proportional to Black et al. (1971) at very low temperatures. Both features are caused by fermion-fermion collisions Ainsworth and Bedell (1987), which are normal and conserve total momentum. As one can see in Fig.6, the magnitude of B2 (prefactor of the thermal T-square resistivity) in 3He, in CeRhIn5, in WP2 and in W plotted vs. , the fermionic specific heat, lies close to the universal Kadowaki-Woods plot. This means that while A2 quantifies the size of momentum-relaxing collisions and B2 is a measure of energy-relaxing, yet momentum-conserving collisions, both scale roughly with the size of the phase space for fermion-fermion scattering, which (provided a constant fermion density) is set by . As a consequence, the magnitude of B2 opens a new window to determine where one may expect electron hydrodynamics.
The hydrodynamic regime Andreev et al. (2011); Moll et al. (2016) of electronic transport (identified long ago by Gurzhi Gurzhi (1968)) requires a specific hierarchy of scattering times. Momentum-conserving collisions should be more frequent than boundary scattering and the latter more abundant than momentum-relaxing collisions. Let us show that this hierarchy can be satisfied in our system thanks to the combination of an unusually low ratio and low disorder. The combination of a residual resistivity as low as 4 n.cm and a carrier density of cm-3 according to Gooth et al. (2018) (compared to cm-3 according to our DFT calculations) implies that we are at the onset of the ballistic limit. It yields a mean-free-path of 140 m. This is to be compared to the sample width and thickness of 0.1 mm.
Like in many other cases Shoenberg (2009), the Dingle temperature of quantum oscillations yields a mean-free-path much shorter than this. A particularly large discrepancy between the Dingle and transport mobilities has been observed in low-density semi-metals such as Sb Fauqué et al. (2018). In the system under study, the difference is as large as three orders of magnitude Kumar et al. (2017). This is presumably because of a very long screening length, weakening large-angle scattering and helping momentum conservation along long distances.
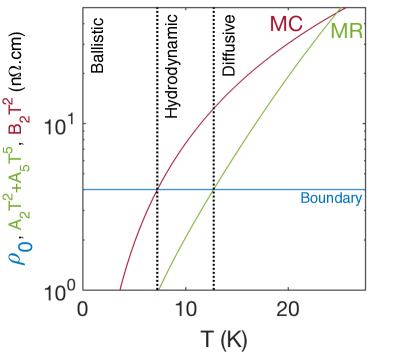
This feature, combined with the fact that momentum-conserving collisions are 4-5 times more frequent than momentum relaxing ones, implies that the system satisfies the required hierarchy of scattering times in a limited temperature window, as one can seen in Fig.7. This figure compares the temperature dependence of momentum-relaxing collisions (with other electrons and phonons), momentum-conserving collisions (among electrons) and the boundary scattering. The three terms are represented by their contributions to resistivity, convertible to scattering rates by the same material-dependent factor. Note the narrowness of the temperature window and the modesty of the difference between the three scattering rates. Note also that the hydrodynamic regime coincides with the observed minimum in L/L0 representing an excess of momentum flow in comparison to energy flow. In the hydrodynamic scenario, this coincidence is not an accident. However, the position and the width of this window are not solidly set. Assuming that the residual resistivity is not entirely fixed by the boundary scattering (i.e ) would shift this temperature window and beyond a threshold , the window will close up.
In purely hydrodynamic transport, momentum relaxation occurs only at the boundary of the system. Momentum-conserving collisions then set the magnitude of the viscosity and the fluid drifts in presence of an external force. However, this does not happen in WP2 or in any other metal, because the finite ratio means that momentum-relaxing events are not absent. In our hydrodynamic regime, an electron traveling from one end of the sample to the other suffers few collisions and four-out-of-five of them conserve momentum. Because the three scattering times (momentum-conserving, momentum-relaxing and boundary) are of the same order of magnitude, any hydrodynamic signature would lead to modest corrections to what can be described in the diffusive or ballistic regimes, such as subtle departures in size-dependent transport properties Moll et al. (2016).
One message of this study is that a finite-temperature departure from the WF law by itself cannot be a signature of hydrodynamic transport, but thermal transport can be used to quantify the relative weight of momentum-conserving collisions and to identify where to expect eventual hydrodynamic features. Specifically, our study highlights two features which were not explicitly considered in previous discussions about the hydrodynamics of electrons. First, as for phonons Beck et al. (1974), the hydrodynamic regime for electrons is expected to occur in a finite temperature window squeezed between the ballistic and diffusive regimes. Second, the phase spaces for momentum-relaxing and momentum-conserving collisions for electrons follow the same (T-square) temperature dependence. This is in a contrast to the case of phonons where Umklapp scattering vanishes exponentially with temperature whereas normal scattering follows a power law Ackerman and Guyer (1968). This difference makes electron hydrodynamics more elusive in comparison with its phononic counterpart Machida et al. (2018).
We note also that the two solids showing anomalously low (W and WP2) are those in which the ballistic limit is accessible and a hydrodynamic window can open up. Future studies on samples with different dimensions Gooth et al. (2018) using a four-contact measurement setup are necessary to reach a definite conclusion.
In summary, we found that WP2 obeys the Wiedemann-Franz law at 2K, but there is a large downward deviation which emerges at higher temperatures. We recalled that the dichotomy between charge and heat transport is ubiquitous in metallic systems, since low-q scattering affects heat conduction more drastically than charge transport. The exceptionally low magnitude of ratio mirrors the discrepancy between the amplitude of T-square prefactors in thermal and electrical resistivities. The large difference between momentum-conserving and momentum-relaxing collisions among electrons opens a narrow temperature window where the hierarchy of scattering times conforms to hydrodynamic requirements.
IV Methods
The samples used in this study were needle-like single-crystals (grown along the a-axis). Their typical dimensions were mm3. The samples are similar to those detailed in Kumar et al. (2017) : they were grown by chemical vapor transport. Starting materials were red phosphorous (Alfa-Aesar, 99.999%) and tungsten trioxide (Alfa-Aesar, 99.998%) with iodine as a transport agent. The materials were taken in an evacuated fused silica ampoule. The transport reaction was carried out in a two-zone-furnace with a temperature gradient of 1000 (T1) to 900 (T2) for several weeks. After reaction, the ampoule was removed from the furnace and quenched in water. The metallic needle-like crystals were later characterized by X-ray diffraction.
The measurements were performed with a standard one-heater-two-thermometers set-up, with Cernox chips, allowing to measure thermal conductivity and the electrical resistivity with the same electrodes and the same geometrical factor. Contacts were made with m Pt wires connected via silver paste with a contact resistance ranging from 1 to 10 . The electric and heat currents were injected along the a-axis of the sample. By studying three different samples with different RRRs, we checked the reproducibility of our results (see the supplemental material).
Supplementary information : Supplementary information accompanies the paper on the npj Quantum Materials
website.
V Acknowledgements
We are indebted to Bernard Castaing and Jacques Flouquet for stimulating discussions.
VI Competing Interests
Conflict of interest : The authors declare no conflict of interest.
VII Authors’ contributions
AJ carried out the thermal and electrical conductivity measurements. WR, AJ and BF built the probe. VS made the sample. CF and NK performed specific heat measurements. CF, JG and KB initiated the collaboration. AS carried out the DFT calculations. AJ, BF and KB analyzed the data with input from DM. All authors participated in the discussions leading to the paper, which was written by KB and AJ.
VIII Funding
This project was funded by Fonds-ESPCI and supported by a grant from Région Ile-de-France. K.B. acknowledges support by the National Science Foundation under Grant No. NSF PHY17-48958. B.F acknowledges support from Jeunes Equipes de l’Institut de Physique du Collège de France (JEIP). D.L.M. acknowledges support from NSF DMR-1720816.
IX Data Availability
All data supporting the findings of this study are available from the corresponding authors A.J. and K.B. upon request.
References
- Ziman (1972) J. Ziman, Principles of the Theory of Solids (Cambridge University Press, 1972), ISBN 9780521297332, URL https://books.google.fr/books?id=o4woMNO-C3sC.
- White and Tainsh (1960) G. K. White and R. J. Tainsh, Phys. Rev. 119, 1869 (1960), URL https://link.aps.org/doi/10.1103/PhysRev.119.1869.
- Yao et al. (2017) M. Yao, M. Zebarjadi, and C. P. Opeil, Journal of Applied Physics 122, 135111 (2017), eprint https://doi.org/10.1063/1.4997034, URL https://doi.org/10.1063/1.4997034.
- Paglione et al. (2005) J. Paglione, M. A. Tanatar, D. G. Hawthorn, R. W. Hill, F. Ronning, M. Sutherland, L. Taillefer, C. Petrovic, and P. C. Canfield, Phys. Rev. Lett. 94, 216602 (2005), URL https://link.aps.org/doi/10.1103/PhysRevLett.94.216602.
- Lussier et al. (1994) B. Lussier, B. Ellman, and L. Taillefer, Phys. Rev. Lett. 73, 3294 (1994), URL https://link.aps.org/doi/10.1103/PhysRevLett.73.3294.
- Pfau et al. (2012) H. Pfau, S. Hartmann, U. Stockert, P. Sun, S. Lausberg, M. Brando, S. Friedemann, C. Krellner, C. Geibel, S. Wirth, et al., Nature 484, 493 EP (2012), URL http://dx.doi.org/10.1038/nature11072.
- Seyfarth et al. (2008) G. Seyfarth, J. P. Brison, G. Knebel, D. Aoki, G. Lapertot, and J. Flouquet, Phys. Rev. Lett. 101, 046401 (2008), URL https://link.aps.org/doi/10.1103/PhysRevLett.101.046401.
- Machida et al. (2013) Y. Machida, K. Tomokuni, K. Izawa, G. Lapertot, G. Knebel, J.-P. Brison, and J. Flouquet, Phys. Rev. Lett. 110, 236402 (2013), URL https://link.aps.org/doi/10.1103/PhysRevLett.110.236402.
- Reid et al. (2014) J.-P. Reid, M. A. Tanatar, R. Daou, R. Hu, C. Petrovic, and L. Taillefer, Phys. Rev. B 89, 045130 (2014), URL https://link.aps.org/doi/10.1103/PhysRevB.89.045130.
- Taupin et al. (2015) M. Taupin, G. Knebel, T. D. Matsuda, G. Lapertot, Y. Machida, K. Izawa, J.-P. Brison, and J. Flouquet, Phys. Rev. Lett. 115, 046402 (2015), URL https://link.aps.org/doi/10.1103/PhysRevLett.115.046402.
- Gooth et al. (2018) J. Gooth, F. Menges, N. Kumar, V. Sü, C. Shekhar, Y. Sun, U. Drechsler, R. Zierold, C. Felser, and B. Gotsmann, Nature Communications 9, 4093 (2018), ISSN 2041-1723, URL https://doi.org/10.1038/s41467-018-06688-y.
- Kumar et al. (2017) N. Kumar, Y. Sun, K. Manna, V. Suess, I. Leermakers, O. Young, T. Förster, M. Schmidt, B. Yan, U. Zeitler, et al., 8 (2017).
- Galitski et al. (2018) V. Galitski, M. Kargarian, and S. Syzranov, Phys. Rev. Lett. 121, 176603 (2018), URL https://link.aps.org/doi/10.1103/PhysRevLett.121.176603.
- Lucas et al. (2016) A. Lucas, J. Crossno, K. C. Fong, P. Kim, and S. Sachdev, Phys. Rev. B 93, 075426 (2016), URL https://link.aps.org/doi/10.1103/PhysRevB.93.075426.
- Principi and Vignale (2015) A. Principi and G. Vignale, Phys. Rev. Lett. 115, 056603 (2015), URL https://link.aps.org/doi/10.1103/PhysRevLett.115.056603.
- Lucas and Das Sarma (2018) A. Lucas and S. Das Sarma, Phys. Rev. B 97, 245128 (2018), URL https://link.aps.org/doi/10.1103/PhysRevB.97.245128.
- Coulter et al. (2018) J. Coulter, R. Sundararaman, and P. Narang, Phys. Rev. B 98, 115130 (2018), URL https://link.aps.org/doi/10.1103/PhysRevB.98.115130.
- Uher and Goldsmid (1974) C. Uher and H. J. Goldsmid, Physica Status Solidi B Basic Research 65, 765 (1974).
- Korenblit et al. (1969) I. Y. Korenblit, M. E. Kuznetsov, V. M. Muzhdaba, and S. S. Shalyt, Soviet Journal of Experimental and Theoretical Physics 30, 1009 (1969).
- White and Tainsh (1967) G. K. White and R. J. Tainsh, Phys. Rev. Lett. 19, 165 (1967), URL https://link.aps.org/doi/10.1103/PhysRevLett.19.165.
- Shiomi et al. (2010) Y. Shiomi, Y. Onose, and Y. Tokura, Phys. Rev. B 81, 054414 (2010), URL https://link.aps.org/doi/10.1103/PhysRevB.81.054414.
- Pal and Maslov (2012) V. I. Pal, H K. Yudson and D. L. Maslov, Lith. J. Phys. 52, 142–164 (2012).
- Lin et al. (2015) X. Lin, B. Fauqué, and K. Behnia, Science 349, 945 (2015).
- Herring (1967) C. Herring, Phys. Rev. Lett. 19, 167 (1967), URL https://link.aps.org/doi/10.1103/PhysRevLett.19.167.
- Bennett and Rice (1969) A. J. Bennett and M. J. Rice, Phys. Rev. 185, 968 (1969), URL https://link.aps.org/doi/10.1103/PhysRev.185.968.
- Zala et al. (2001) G. Zala, B. N. Narozhny, and I. L. Aleiner, Phys. Rev. B 64, 214204 (2001), URL https://link.aps.org/doi/10.1103/PhysRevB.64.214204.
- Maslov et al. (2011) D. L. Maslov, V. I. Yudson, and A. V. Chubukov, Phys. Rev. Lett. 106, 106403 (2011), URL https://link.aps.org/doi/10.1103/PhysRevLett.106.106403.
- Razzoli et al. (2018) E. Razzoli, B. Zwartsenberg, M. Michiardi, F. Boschini, R. P. Day, I. S. Elfimov, J. D. Denlinger, V. Süß, C. Felser, and A. Damascelli, ArXiv e-prints (2018), eprint 1801.03956.
- Schönemann et al. (2017) R. Schönemann, N. Aryal, Q. Zhou, Y.-C. Chiu, K.-W. Chen, T. J. Martin, G. T. McCandless, J. Y. Chan, E. Manousakis, and L. Balicas, Phys. Rev. B 96, 121108 (2017), URL https://link.aps.org/doi/10.1103/PhysRevB.96.121108.
- Wagner et al. (1971) D. K. Wagner, J. C. Garland, and R. Bowers, Phys. Rev. B 3, 3141 (1971), URL https://link.aps.org/doi/10.1103/PhysRevB.3.3141.
- (31) S. Li and D. L. Maslov, arXiv:1810.01463 (????).
- Greywall (1984) D. S. Greywall, Phys. Rev. B 29, 4933 (1984), URL https://link.aps.org/doi/10.1103/PhysRevB.29.4933.
- Black et al. (1971) M. A. Black, H. E. Hall, and K. Thompson, Journal of Physics C: Solid State Physics 4, 129 (1971), URL http://stacks.iop.org/0022-3719/4/i=2/a=001.
- Ainsworth and Bedell (1987) T. L. Ainsworth and K. S. Bedell, Phys. Rev. B 35, 8425 (1987), URL https://link.aps.org/doi/10.1103/PhysRevB.35.8425.
- Andreev et al. (2011) A. V. Andreev, S. A. Kivelson, and B. Spivak, Phys. Rev. Lett. 106, 256804 (2011), URL https://link.aps.org/doi/10.1103/PhysRevLett.106.256804.
- Moll et al. (2016) P. J. W. Moll, P. Kushwaha, N. Nandi, B. Schmidt, and A. P. Mackenzie, Science 351, 1061 (2016), ISSN 0036-8075.
- Gurzhi (1968) R. N. Gurzhi, Soviet Physics Uspekhi 11, 255 (1968), URL http://stacks.iop.org/0038-5670/11/i=2/a=R07.
- Shoenberg (2009) D. Shoenberg, Magnetic Oscillations in Metals (2009).
- Fauqué et al. (2018) B. Fauqué, X. Yang, W. Tabis, M. Shen, Z. Zhu, C. Proust, Y. Fuseya, and K. Behnia, Phys. Rev. Materials 2, 114201 (2018), URL https://link.aps.org/doi/10.1103/PhysRevMaterials.2.114201.
- Beck et al. (1974) H. Beck, P. F. Meier, and A. Thellung, Phys. stat. sol. (a) 24, 11 (1974).
- Ackerman and Guyer (1968) C. Ackerman and R. Guyer, Annals of Physics 50, 128 (1968), ISSN 0003-4916, URL http://www.sciencedirect.com/science/article/pii/0003491668903205.
- Machida et al. (2018) Y. Machida, A. Subedi, K. Akiba, A. Miyake, M. Tokunaga, Y. Akahama, K. Izawa, and K. Behnia, Science Advances 4, eaat3374 (2018).
- Tsujii et al. (2003) N. Tsujii, K. Yoshimura, and K. Kosuge, Journal of Physics: Condensed Matter 15, 1993 (2003), URL http://stacks.iop.org/0953-8984/15/i=12/a=316.
- Abel et al. (1967) W. R. Abel, R. T. Johnson, J. C. Wheatley, and W. Zimmermann, Phys. Rev. Lett. 18, 737 (1967), URL https://link.aps.org/doi/10.1103/PhysRevLett.18.737.
- Wheatley (1970) J. Wheatley, Journal de Physique Colloques 31, C3 (1970), URL https://hal.archives-ouvertes.fr/jpa-00213853.
- Fisher et al. (2002) R. A. Fisher, F. Bouquet, N. E. Phillips, M. F. Hundley, P. G. Pagliuso, J. L. Sarrao, Z. Fisk, and J. D. Thompson, Phys. Rev. B 65, 224509 (2002), URL https://link.aps.org/doi/10.1103/PhysRevB.65.224509.
- Boxus et al. (1981) J. Boxus, C. Uher, J. Heremans, and J. P. Issi, Phys. Rev. B 23, 449 (1981), URL https://link.aps.org/doi/10.1103/PhysRevB.23.449.
- Behnia et al. (2007) K. Behnia, M.-A. Measson, and Y. Kopelevich, Phys. Rev. Lett. 98, 076603 (2007), URL https://link.aps.org/doi/10.1103/PhysRevLett.98.076603.
- K. S. Blaha et al. (2001) P. K. S. Blaha, K. Schwarz, G. Madsen, D. Kvasnicka, and J. Luitz, WIEN2k: An Augmented Plane Wave plus Local Orbitals Program for Calculating Crystal Properties (2001).
X Figures

XI Supplemental Material for ’Departure from the Wiedemann-Franz Law in WP2 Driven by Mismatch in T-square Resistivity Prefactors’
XI.1 Samples Measured
We measured 3 different single crystals of WP2, all grown in the same batch.
The sample presented in the corpus is S3. In table 1 we present their geometries and basic electrical characteristics.
All the samples were measured along the same direction, with -axis) for both heat and electrical currents.
The result for the electrical conductivity in all three samples are shown in Fig.8. Besides the residual resistivity , we see that both the -dependent and -dependent terms are equal from one sample to another.
From Fig.9 we can deduce that the -dependent and -dependent terms of the thermal resistivity, , are also equivalent in the three different samples. We thus confirm that besides the residual terms, the electrical and thermal resistivities are reproducible from one sample to another with comparable size.
| Sample | Length (mm) | Width (m) | Thickness (m) | (n.cm) | RRR = |
|---|---|---|---|---|---|
| S1 | 1.5 | 80-100 | 110 | 3.94 | 11200 |
| S2 | 1.9 | 90-100 | 110 | 5.85 | 7600 |
| S3 | 0.9 | 80-110 | 120 | 4.69 | 9600 |
XII Electrical and Thermal -dependent resistivity : comparison of different systems
We reference in table 2 the values of the electrical and thermal resistivities quadractic prefactors for different materials. The electrical prefactor is noted whereas the thermal -prefactor is . We computed the ratio of these two terms in the third column.
| Material | Residual Resistivity (n.cm) | Electrical Prefactor (p.cm.K-2) | Thermal Prefactor (p.cm.K-2) | |
|---|---|---|---|---|
| WP2 | 4 - 7 | 16.6 | 75.6 | 0.22 |
| W | 0.06 - 0.5 | 0.90.3 | 6.20.9 | 0.15 |
| UPt3 | 200 - 600 | (1.60.59)106 | (2.440.9)106 | 0.65 |
| Ni | 1 - 3 | 255 | 61 | 0.40 |
| CeRhIn5 | 37 | 21000 | 57000 | 0.4 |
XIII Quadratic Thermal Resistivity in low temperature liquid 3He
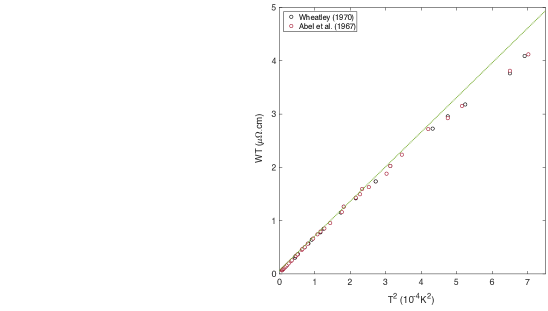
The thermal conductivity, , of normal-liquid 3He was measured by Abel et al. Abel et al. (1967) and Wheatley Wheatley (1970). They expressed their thermal conductivity as : . At low temperature, the first term exceeds by far the second and is basically proportional to the inverse of temperature, implying . This can be seen in figure 10, where we plot as a function of .
XIV Specific Heat of WP2
In order to derive the specific heat due to phonons without the exact phonon dispersion curve we have to make an approximation. We will consider that for with , optical modes are not excited : the thermal energy is too small. We are left with acoustic modes only. This is the Debye approximation which yields a -dependent phononic specific heat. But heat capacity can also result from electronic contribution. In that case it takes the form of linear in term. We define the specific heat from both contribution in equation 4
| (4) |
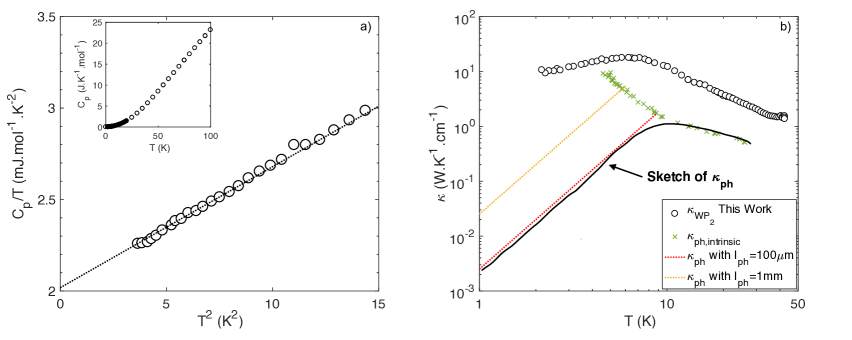
Fig.11.a presents the specific heat plotted as as a function of measured in our WP2 samples. Below 4K we can estimate both contributions. First, from the intercept with the y-axis we determined the electronic contribution , then the slope gave the phononic contribution mJ.mol-1.K-4. As temperature is furthered increased the contribution is suppressed from the specific heat and we head toward a saturating regime of . This is observed in the inset of Fig.11.a. The Dulong-Petit law is then recovered. Also, the heat capacity of phonons is linked to the thermal conductivity through the following equation :
| (5) |
Where is the heat capacity per unit of volume, is the average speed of the phonons in the system and the mean free path of the phonons. As a matter of fact, we can now derive an upper limit to an contribution to thermal conductivity caused by phonons in WP2. To do so, we use the phonons’ specific heat determined above, a speed of sound of and a mean free path as high as possible in our sample, i.e 100m.
The phonons’ contribution estimated for m and mm are plotted respectively as a red dotted line and a yellow dotted line in Fig.11.b. In order to have an idea of the intrinsic, i.e size independent, contribution of the phonons to the thermal conductivity of the system, it is instructive to refer to the case of bismuth where the evolution of the thermal conductivity with size as been documented Boxus et al. (1981); Behnia et al. (2007). This allows us to make a rough sketch of in our system. As seen in the figure, the expected contribution of phonons remains an order of magnitude below the measured thermal conductivity in WP2 in the whole temperature window.
We deduce from this observation that the phonons’ contribution to is negligible compared to the electronic contribution.
XV Residual resistivity decomposed to boundary and impurity scattering
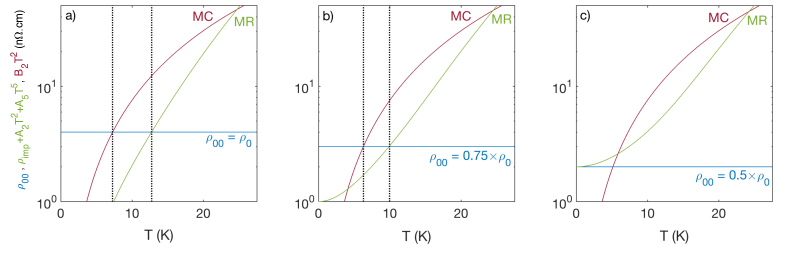
In the main text, we argued that Gurzhi’s hydrodynamic criteria Gurzhi (1968) can be satisfied in a narrow temperature window. Here we show that the width of this window and its very existence is critically dependent on the importance of impurity scattering. Assuming a carrier density of cm-3, the mean-free-path exceeds the sample width and the residual resistivity is entirely set by boundary scattering. This will lead to Fig.6.a). In a limited temperature window (7T13 K) the MC, MR and boundary scattering times respect the hydrodynamic requirements. Let us consider the possibility that the residual resistivity contains a sizable component due to impurity scattering. In this case, one can write:
| (6) |
Here, is due to boundary scattering whereas results of impurities and defects. When only represents 75% (Fig6.b)), we can still find a temperature range to satisfy Gurzhi’s conditions. This hydrodynamic window is shifted to lower temperatures and gets narrower. However, if becomes 50% (Fig6.c)) of the residual resistivity, then there is no range of temperature which allows the emergence of a hydrodynamic regime in WP2.
XVI Computational methods
The density functional theory calculations were performed using the general full-potential linearized augmented planewave method as implemented in the wien2k software package K. S. Blaha et al. (2001). The generalized gradient approximation of Perdew, Burke and Ernzerhof was used for the exchange-correlation functional. The muffin-tin radii of 2.3 and 2.0 a.u. were used for W and P, respectively. A -point grid was used to perform the Brillouin zone integration in the self-consistent calculations. The planewave cutoff was set by = 8, where is the planewave cutoff and is the smallest muffin-tin radius used in the calculations. The DFT calculations yields the following values :
- carrier concentration of holes due to band 1: 1.25 cm-3
- carrier concentration of holes due to band 2: 1.65 cm-3
- carrier concentration of electrons due to band 3: 1.69 cm-3
- carrier concentration of electrons due to band 4: 1.18 cm-3