Subduction and atmospheric escape of Earth’s seawater constrained by hydrogen isotopes
Abstract
The hydrogen isotopic (D/H) ratio reflects the global cycling and evolution of water on Earth as it fractionates through planetary processes. We model the water cycle taking seafloor hydrothermal alteration, chemical alteration of continental crust, slab subduction, hydrogen escape from the early Earth, and degassing at mid-ocean ridges, hot spots, and arcs into account. The differences in D/H ratios between present-day oceans, oceanic and continental crust, and mantle are thought to reflect isotopic fractionation through seafloor alteration, chemical alteration, and slab dehydration. However, if the speed of plate tectonics has been nearly constant through out Earth’s history, the degassing and regassing rates are too small to reach the present-day D/H ratios. We show that (a) hydrogen escape from reduced early atmosphere, (b) secular net regassing, or (c) faster plate tectonics on early Earth is needed to reproduce the present-day D/H ratios of the water reservoirs. The low D/H ratio of Archean seawater at 3.8 Ga has previously been interpreted as a signature of (a) hydrogen escape, but we find it can also be explained either by (b) secular net regassing or by (c) faster plate tectonics on early Earth. The rates of hydrogen escape from early Earth and secular regassing on present-day Earth are constrained to be lower than kg/yr and kg/yr. Consequently, the volume of water in the present-day mantle could result entirely from the regassing through Earth’s history. In that case, the volume of initial oceans could be 2 to 3 times larger than that of current Earth. We suggest that, in addition to the D/H ratio of Archean seawater, identifying the D/H ratios of both seawater and mantle throughout Earth’s history would allow to distinguish these evolutionary scenarios.
keywords:
global water cycle , hydrogen isotopes , subduction , atmospheric escape , early Earth , seawater1 Introduction
Water plays a critical role in controlling the physical and chemical evolution on Earth through atmosphere-ocean-continent interactions which control the atmospheric composition, the climate through the carbon cycle, the subduction of water, and possibly even the emergence and evolution of life [e.g., 13, 73, 20, 21, 10]. Furthermore, the abundance of water in Earth’s interior influences the mantle melting, rheology, and style of convection [e.g., 19, 27, 48].
The abundance of water on the surface and in the interior is controlled by the deep water cycle between the oceans and mantle, and loss caused by hydrogen escape throughout Earth’s history. Slab subduction transports water as bound and pore water in metamorphic rocks and sediments that originate from hydrothermal alteration of the seafloor and chemical alteration of continental crust [e.g., 25, 3, 20, 21]. While the majority of the subducted water returns to the oceans directly by updip transport and indirectly by arc volcanism, some trace amounts of water may remain in the mantle. Water can return from the mantle to the exosphere (here defined as the atmosphere and hydrosphere) by regassing at mid-ocean ridges and ocean islands. Although the photolysis of water has a negligible effect on the loss of hydrogen from the atmosphere today, the hydrogen escape through the photolysis of methane in the reduced early atmosphere before the great oxidation event (GOE) at 2.5 Ga could have a more significant impact [4].
Despite its importance to control the water budget, the balance between the degassing and regassing as well as the early hydrogen escape flux is poorly understood. We note that the term “regassing” means the water transport to the mantle as bound and pore water in metamorphic rocks and sediments. Net regassing from the oceans to the mantle has been suggested from the geochemical estimates [24]. The continental freeboard is proposed to be nearly constant from the end of the Archean [e.g., 61] and is interpreted as the degassing and regassing rates almost achieving balance [e.g., 40, 54]. However, Korenaga et al. [34] recently argued that the relative buoyancy of continental lithosphere with respect to oceanic lithosphere was higher in the past, which requires a larger volume of oceanic water at the time to keep continental freeboard constant. Hydrogen escape on early Earth is even more poorly constrained as the atmospheric composition at that time is not well known.
Hydrogen isotope (D/H) ratio has been used to constrain the global cycle and loss of water on Earth, as it fractionates through planetary processes. Earth’s mantle is known to have ‰ to -60 ‰ (, where the reference is the standard mean ocean water, hereafter SMOW), which is lower than that of today’s oceans (defined here as the total hydrosphere) [39, 6]. The low mantle value has been considered to suggest that the mantle became isolated from the oceans through geologic time [39], or that water in the mantle has been isotopically fractionated from the source seawater because of seafloor alteration and slab dehydration processes [40, 63, 62]. Isotopic analysis of Archean minerals and rocks has found that Archean seawater has a value lower than that of present-day oceans, which has been interpreted as a signature of water loss caused by the hydrogen escape [23, 58].
While D/H ratio has been widely utilized to constrain those processes of the water cycle and loss, there is no comprehensive model of the D/H evolution which involves all relevant processes. Previous studies considered the degassing and regassing [40, 63] or the hydrogen escape [58] only. In addition, the D/H ratios of the mantle and Archean seawater have been considered separately to constrain these different processes. Because all water reservoirs are coupled to each other, all these processes and D/H constraints should be considered simultaneously, which is the aim of this study.
We model the global water cycle taking seafloor hydrothermal alteration, chemical alteration of continental crust, slab subduction, atmospheric escape, and degassing at mid-ocean ridges, hot spots, and arcs into account. The model calculations are compared with the D/H ratios of water in different reservoirs on present-day Earth and of Archean seawater to constrain the rates of hydrogen escape from early Earth and of secular regassing on present-day Earth. Section 2 presents the model. Section 3 shows the results. The implications for the evolution of water on Earth are discussed in Section 4. We conclude in Section 5.
2 Methods
2.1 Model
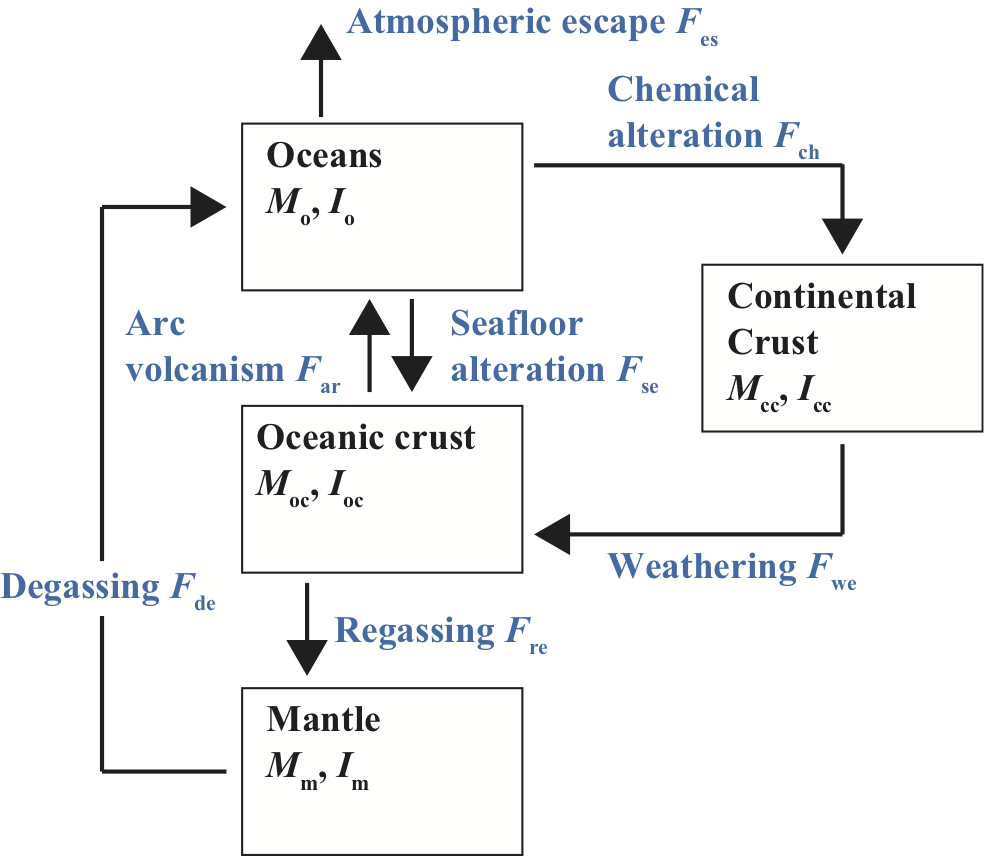
We constructed a global water cycle model taking the D/H compositions into account. Four reservoirs were considered in our model: the oceans, continental crust, oceanic crust, and mantle. These reservoirs exchange water through seafloor hydrothermal alteration, chemical alteration of continents, slab subduction, and degassing at mid-ocean ridges, hot spots, and arcs (Figure 1). Hydrogen loss to space induced by photolysis of methane was considered to have occurred on early Earth before the GOE at 2.5 Ga. The oceans in our model include water in small reservoirs that exchange water with oceans over short timescales: atmosphere, biosphere, surface water, ground water, and glaciers/polar ice, see Table 2. Hereafter the oceans with the small reservoirs are referred to as “bulk oceans” when we would like to distinguish them from seawater without small reservoirs. Exploring the possible ranges of fluxes, we constrain the water cycle and discuss the implications for the evolution of water on Earth.
Evolution of the masses and D/H ratios of water in each reservoir was calculated by using the following equations,
| (1) |
| (2) |
| (3) |
| (4) |
where and are the mass and D/H ratio of water in the reservoir i, and and are the flux of the process k and its fractionation factor. The sources and sinks for each reservoir are described in Figure 1. Hereafter subscripts i=o, cc, oc, and m denote the oceans, continental crust, oceanic crust, and mantle, respectively. The subscript i’ in Equation 2 denotes a reservoir other than i. Subscripts k = ch, ar, se, de, es, we, and re denote the chemical alteration, arc volcanism, seafloor alteration, degassing, atmospheric escape, weathering, and regassing, respectively. Equations 3 and 4 give and by considering the dehydration-induced fractionation and mass balance. Assuming in Equation 2 gives a steady state in D/H, which is useful to understand the numerical results (A).
Our model assumed that the fluxes depend on the masses of water in the reservoirs and time as follows:
| (5) |
| (6) |
| (7) |
| (8) |
| (9) |
| (10) |
where superscript 0 denotes the reference (present-day) values, is the continental area, and is the speed of plate tectonics scaled to that on present-day Earth, which accounts for the change of mantle-convection speed due to the cooling suggested by conventional thermal-evolution models [e.g., 68, 21]. The difference in the dependence on between Equations 6, 7, 10 and 8 originates from the boundary-layer model [21].
The continental area as a function of time is given by [46],
| (11) |
We note that, though the evolution of the continental coverage is controversial, our results are shown to depend only weakly on the choice of the continental growth model (subsection 4.7).
The plate speed scaled by the present-day value is given by,
| (12) |
Equation 12 reflects the model of Höning and Spohn [21], which argued that the speed of subduction was times faster when the potential temperature of the mantle was K hotter than today [18]. In contrast, a recent model based on the energetics of plate-tectonic mantle convection proposed that the tectonic speed and surface heat flux have been nearly constant throughout Earth’s history [32, 34], which implies . We considered both the former and latter cases. Hereafter the two thermal evolution models are referred to as the faster and slower plate tectonics (PT) models, respectively. Models assuming time-independent (constant) fluxes were also explored to show the basic properties of the evolution of D/H (B).
2.2 Parameters
| Present-day water fluxes [] | |
|---|---|
| 1.0 | |
| 10 | |
| 1.5 | |
| 1.0 | |
| Fractionation factors | |
| 0 (standard), 10 | |
| -30 | |
| -80 | |
| 0 | |
| Equations 3 and 4 | |
| Equations 3 and 4 | |
| -40 (standard), -23 | |
| -150 | |
| Present-day water masses [ocean] | |
| 1 | |
| 0.2 | |
| 0.1 | |
| 1 or ¿1 | |
| Initial water masses | |
| + + + | |
| 0 ocean | |
| - |
Our assumptions on parameters are summarized in Table 1 (Supplementary text S1). We assumed ocean, oceans, and oceans (1 ocean = 1.4 1021 kg). Most of our models assumed ocean, but some models showed the integrated regassing to be larger than 1 ocean. In these cases, we increased iteratively until the model results in at present which agrees with the assumed .
The present-day net-regassing flux and escape flux before 2.5 Ga are treated as independent parameters. We assumed , , , , , and , respectively (Supplementary text S2). Models assuming different values of the fluxes were also explored to show the basic behavior of the system (B).
Our standard model assumed the values of fractionation factors as summarized in Table 1. Considering the uncertainty of fractionation factors (Supplementary text S3), we also examined the cases where different values were assumed.
While our model assumed that the majority of Earth’s water had been delivered before the solidification of magma oceans, part of water might have been delivered by the late accretion of comets. In order to investigate the influence of the possible late accretion of comets, we also explored models where the cometary delivery was implemented by an input of ocean water with ‰ at Ga (Supplementary text S5).
2.3 Initial conditions
The initial conditions of water volumes were assumed as follows (Table 1 and Supplementary text S4). Because there was no continental crust initially (Equation 11), oceans was assumed. The water in sediments on present-day Earth was assumed to be initially partitioned into the oceans. We further assumed that the integrated water lost by escape originated from the oceans. Therefore, the initial water in oceans was given by , where is the integrated net regassing. The regassed water is not given a priori, but it was given by iteration. The initial mantle water was given by .
We assumed that all the reservoirs have the same and iteratively change the value to obtain the present-day oceanic value which equals the SMOW (Supplementary text S4). We note that the initial values obtained by this procedure were within the range of carbonaceous chondrites: ‰ to 300‰ [40].
2.4 Constraints from D/H
| Reservoir | Amount of water (ocean) | (‰) |
|---|---|---|
| Oceans (including small reservoirs) | 1.0 | -12 to -7.1 |
| Oceans | 0.98 11footnotemark: 1 | 0 11footnotemark: 1 |
| Atmosphere | 11footnotemark: 1 | -70 to +10 22footnotemark: 2 |
| Biosphere | 11footnotemark: 1 | -130 to -70 33footnotemark: 3 |
| Surface water | 11footnotemark: 1 | -300 to +10 44footnotemark: 4 |
| Ground water | 11footnotemark: 1 | -300 to +10 44footnotemark: 4 |
| Glaciers/Polar ice | 11footnotemark: 1 | -400 to -300 33footnotemark: 3 |
| Oceanic crust | 0.10 11footnotemark: 1 | -50 to -30 66footnotemark: 6 |
| Continental crust | 0.20 11footnotemark: 1 | -100 to -60 33footnotemark: 3 |
| Mantle | 1.0 44footnotemark: 4 | -80 to -60 77footnotemark: 7 |
Models are considered successful if they satisfy the constraints on the D/H ratios of present-day reservoirs (Table 2) and of the Archean seawater. Present-day Earth’s seawater have ‰ by definition. Summing up water in oceans and small reservoirs (atmosphere, biosphere, surface water, groundwater, and glaciers) leads to the bulk oceanic ‰ to -7.1‰. The gap from SMOW mostly originated from the contribution of low glaciers and polar ice. Sedimentary rocks on continental crust and metamorphic rocks on oceanic crust have ‰ to -60‰ and ‰ to -30‰, respectively [40, 63]. Earth’s mantle has ‰ to -60 ‰ [39, 6].
The D/H ratio of paleo-seawater has been estimated from isotopic analysis of minerals and rocks which interacted with seawater [74, 41, 38, 23, 58]. We adopted ‰ proposed by Pope et al. [58] as the constraint on 3.8 Ga seawater, because they have derived this value by combining hydrogen and oxygen isotope measurements of serpentine samples, in which primitive isotopic signatures have been well preserved. We will discuss other data sets in subsection 4.4. We assumed that the range of values between those of the bulk ocean and the ocean (seawater) should match the evaluated of the Archean seawater. Assuming constant corresponds to the case where the mass ratio of glaciers/polar ice to bulk oceans has been constant through time. Because there is no evidence of glaciation before approximately 2.9 Ga [75], considering the range of is a conservative assumption.
3 Results
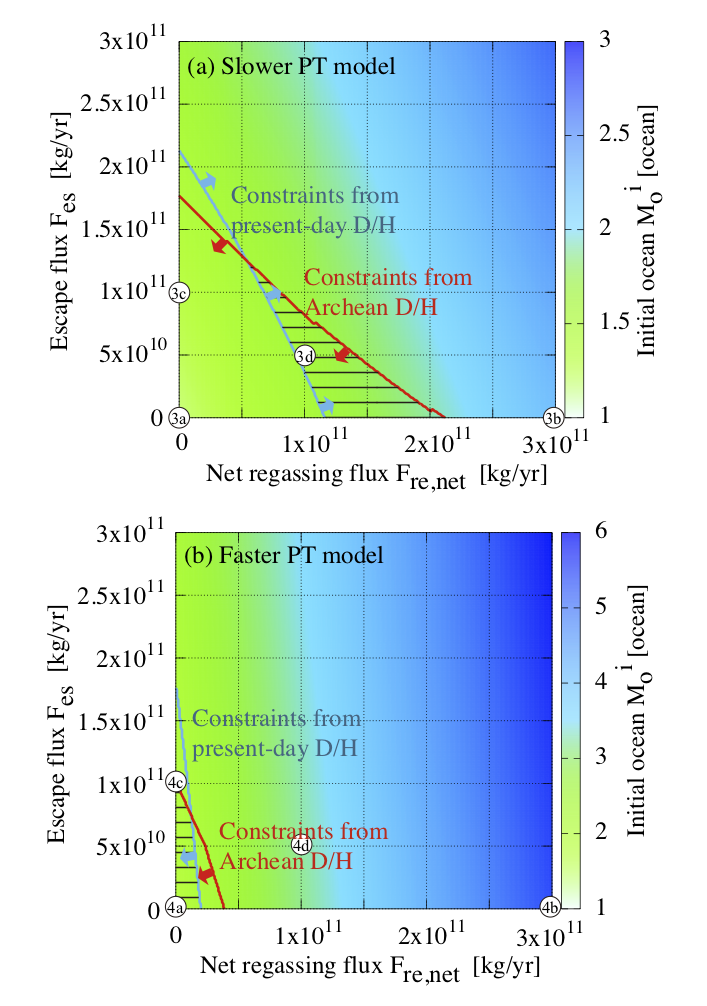
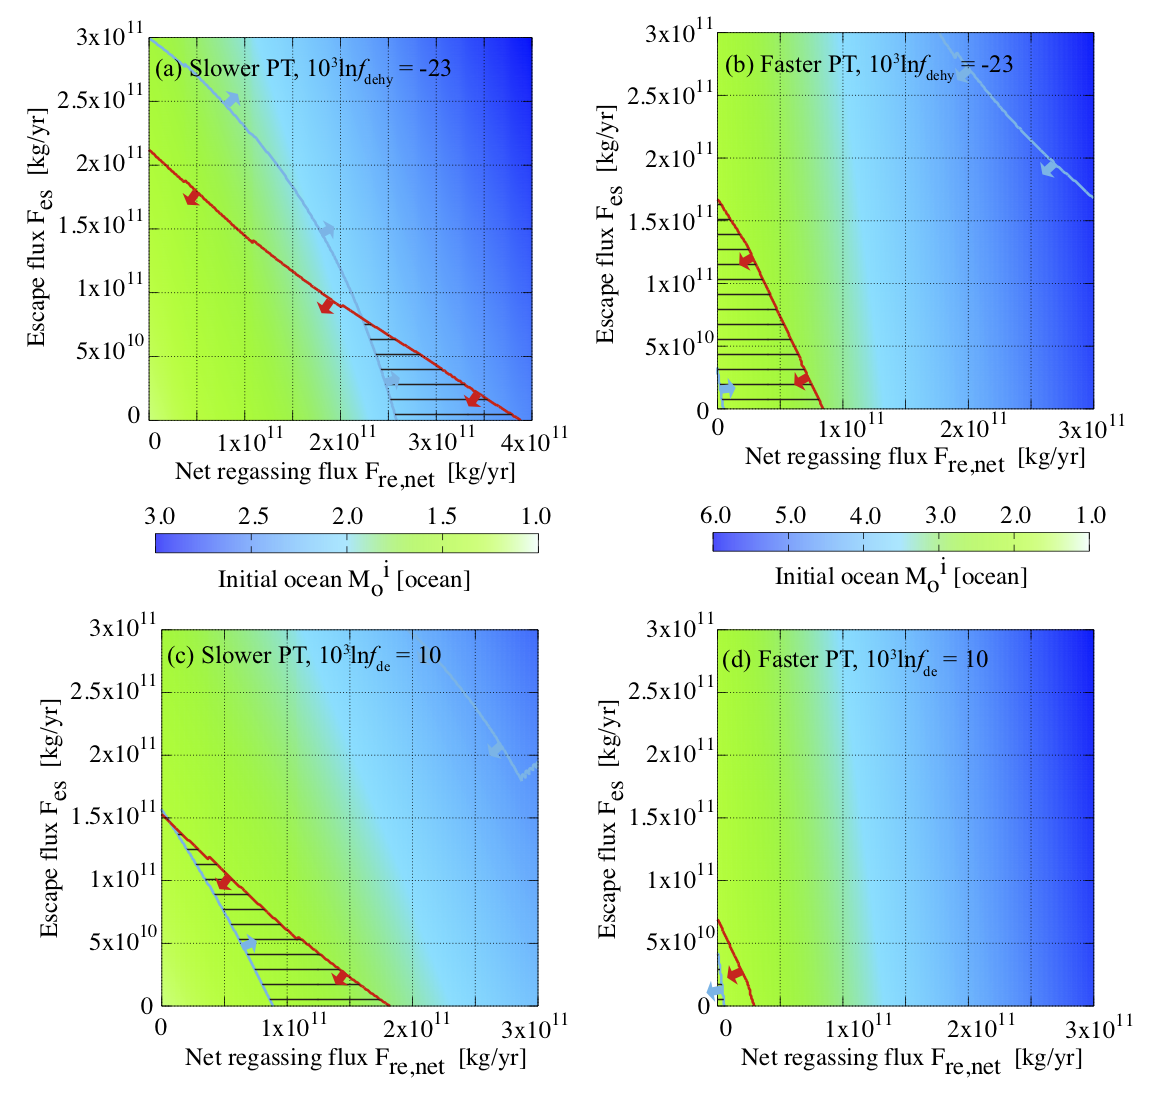
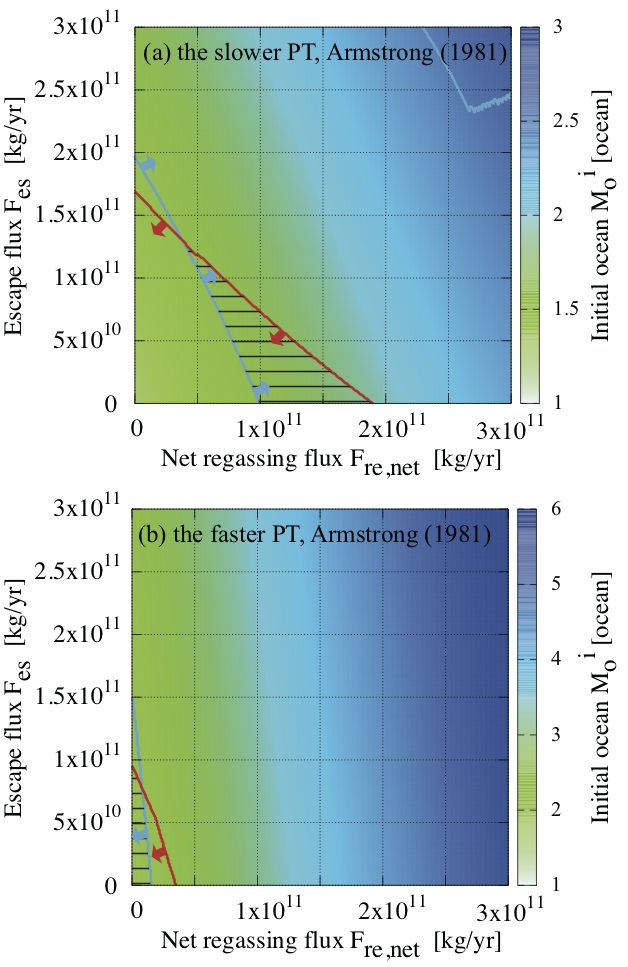
The ranges of and where the constraints on present-day and Archean D/H were satisfied are shown for the slower and faster PT models in Figures 2a and 2b, respectively. The standard model was assumed for fractionation factors. The initial water mass in the oceans is also shown. We calculated the evolution of masses and D/H ratios of the water reservoirs for each set of and . Examples of evolutionary tracks are shown in Figures 3 and 4. The results for different values of fractionation factors are shown in Figure 5. The influence of the possible late accretion of comets are considered in Figure 6. As explained below, the results showed that the slower PT model assuming and does not satisfy the constraints on D/H (Figure 2a). Therefore, hydrogen escape from the reduced early atmosphere, secular net regassing (Figure 2a), or faster plate tectonics on early Earth (Figure 2b) is required.
3.1 The slower PT model
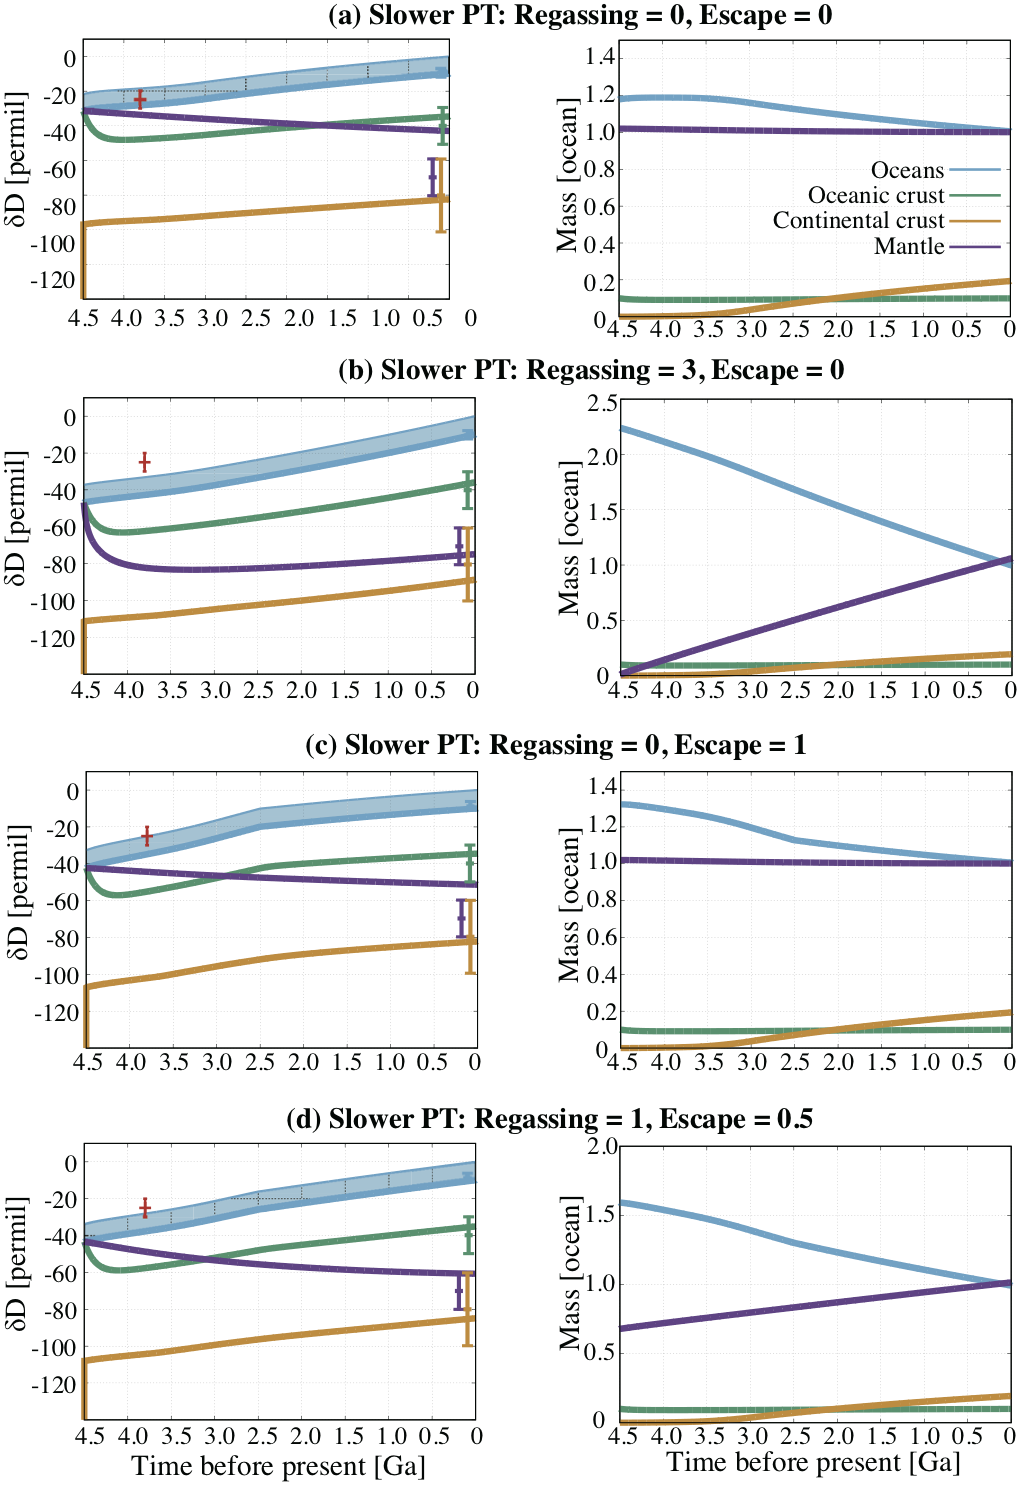
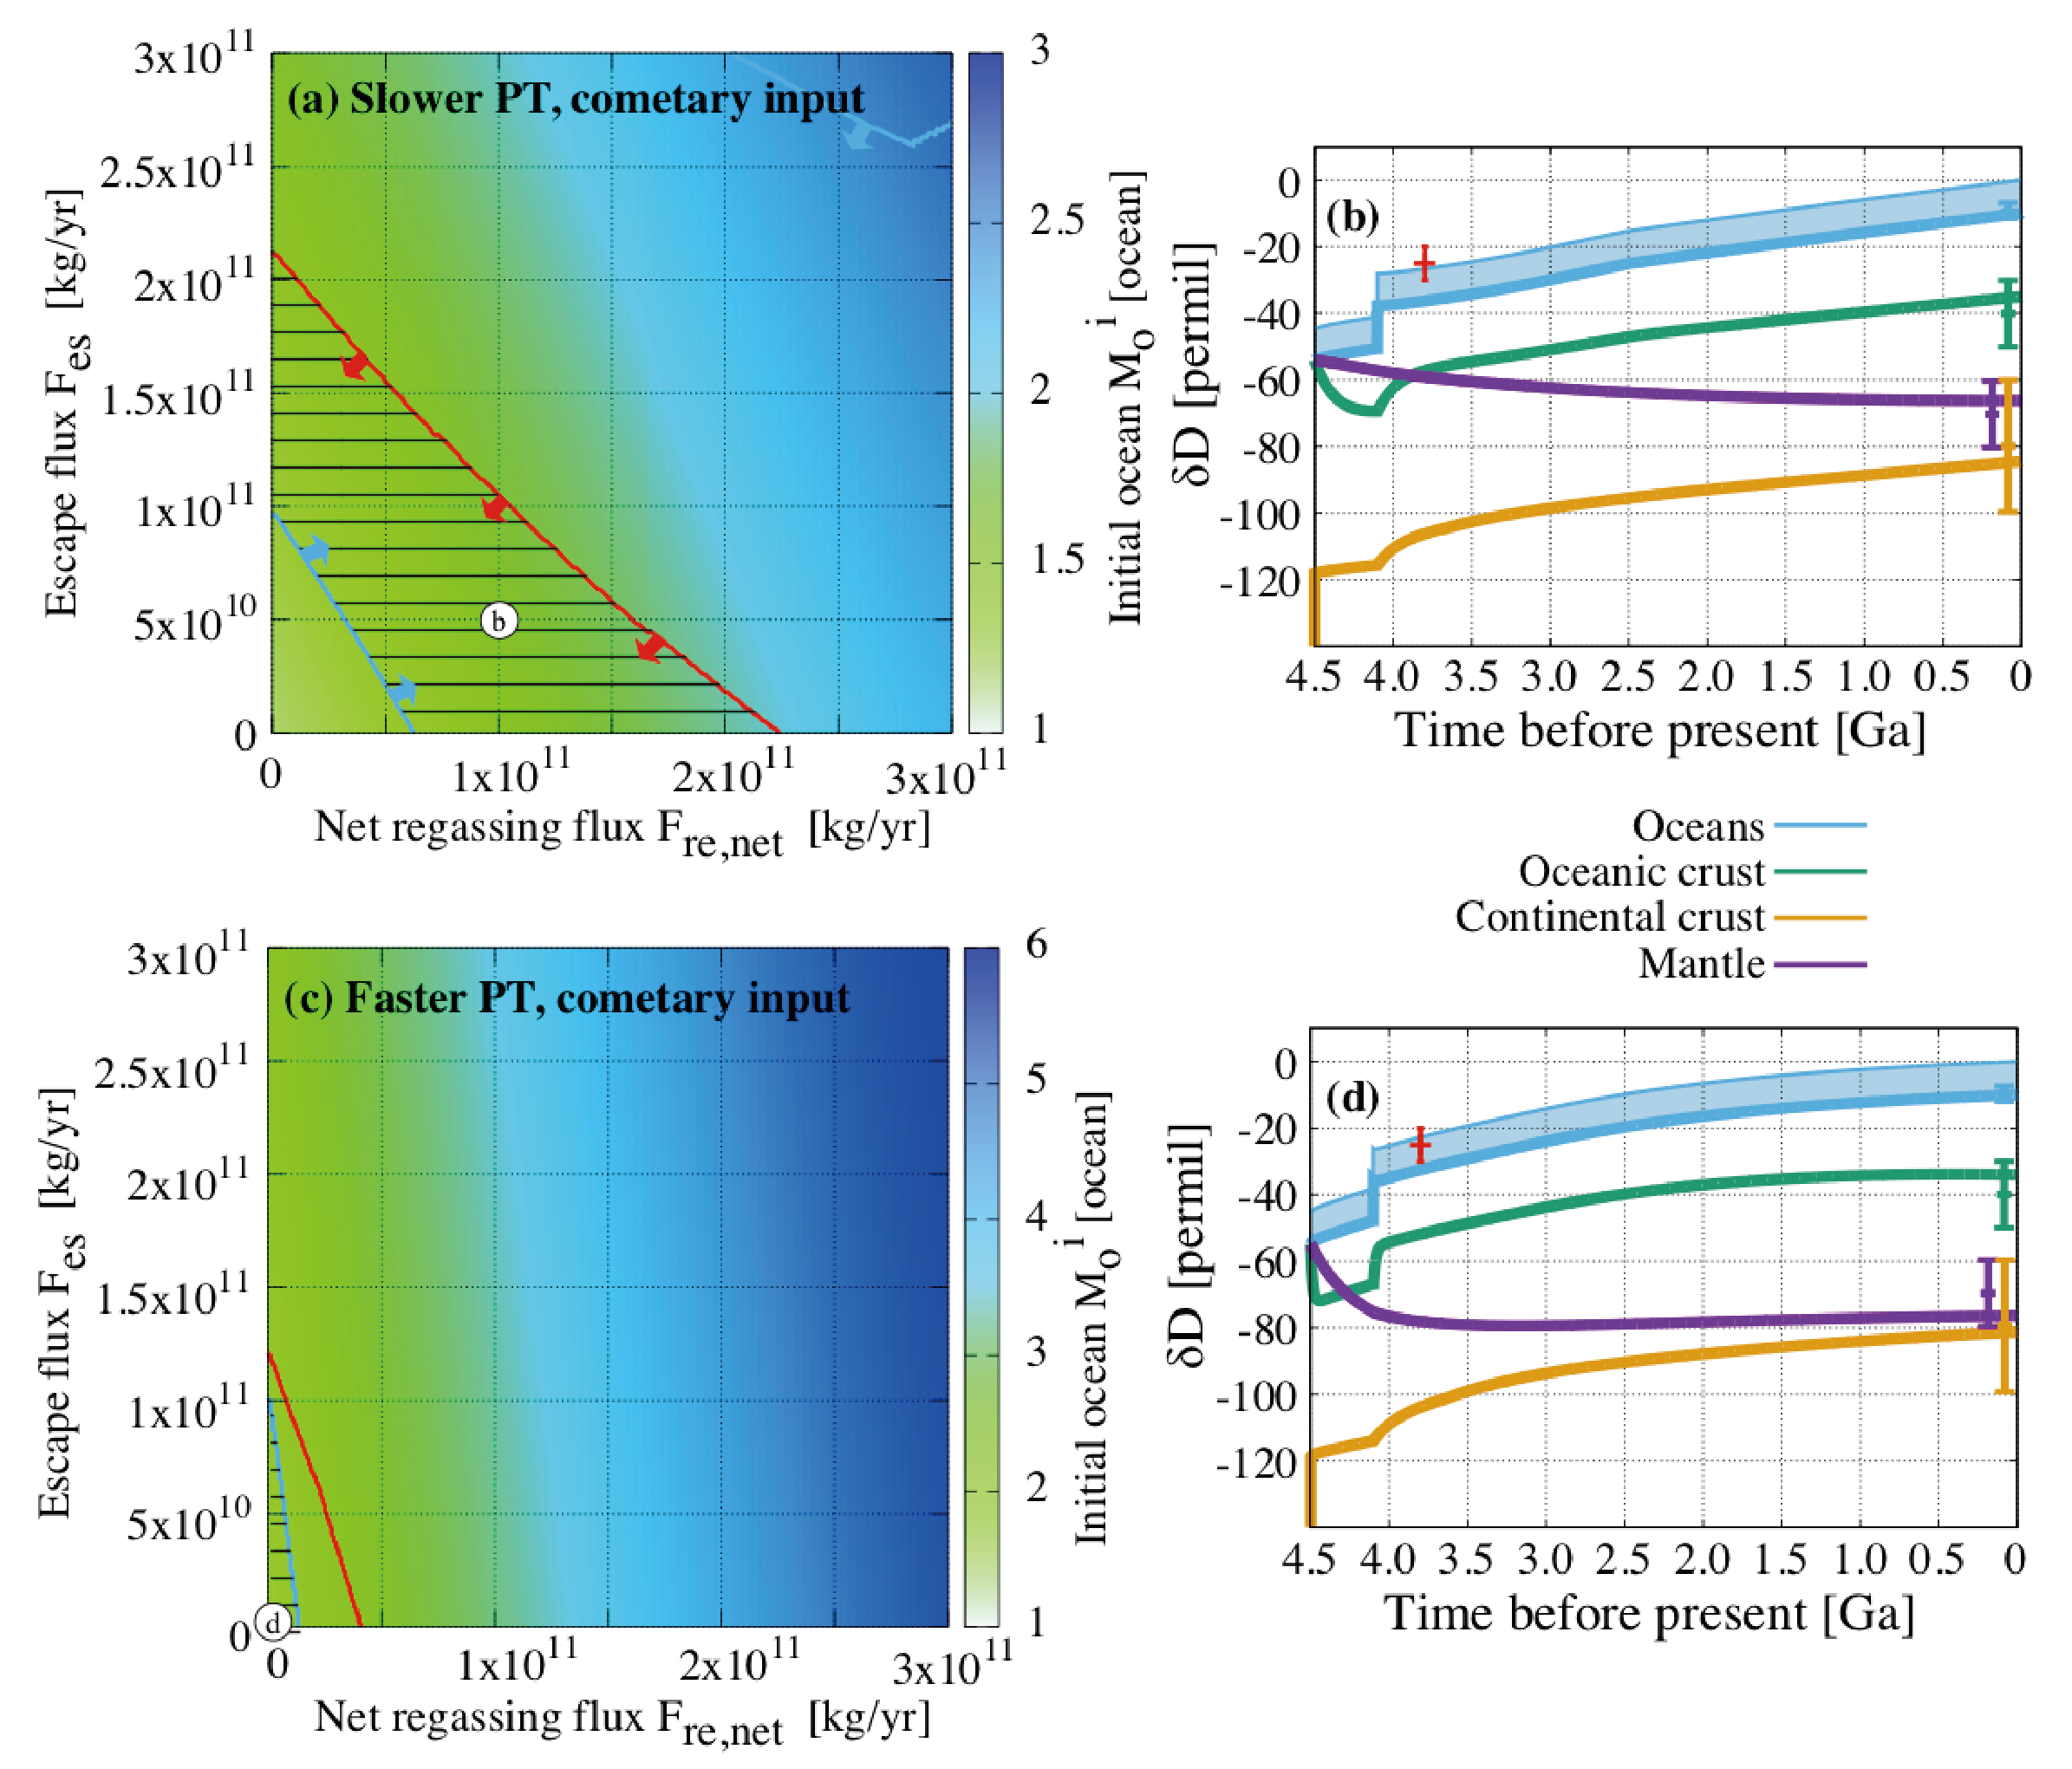
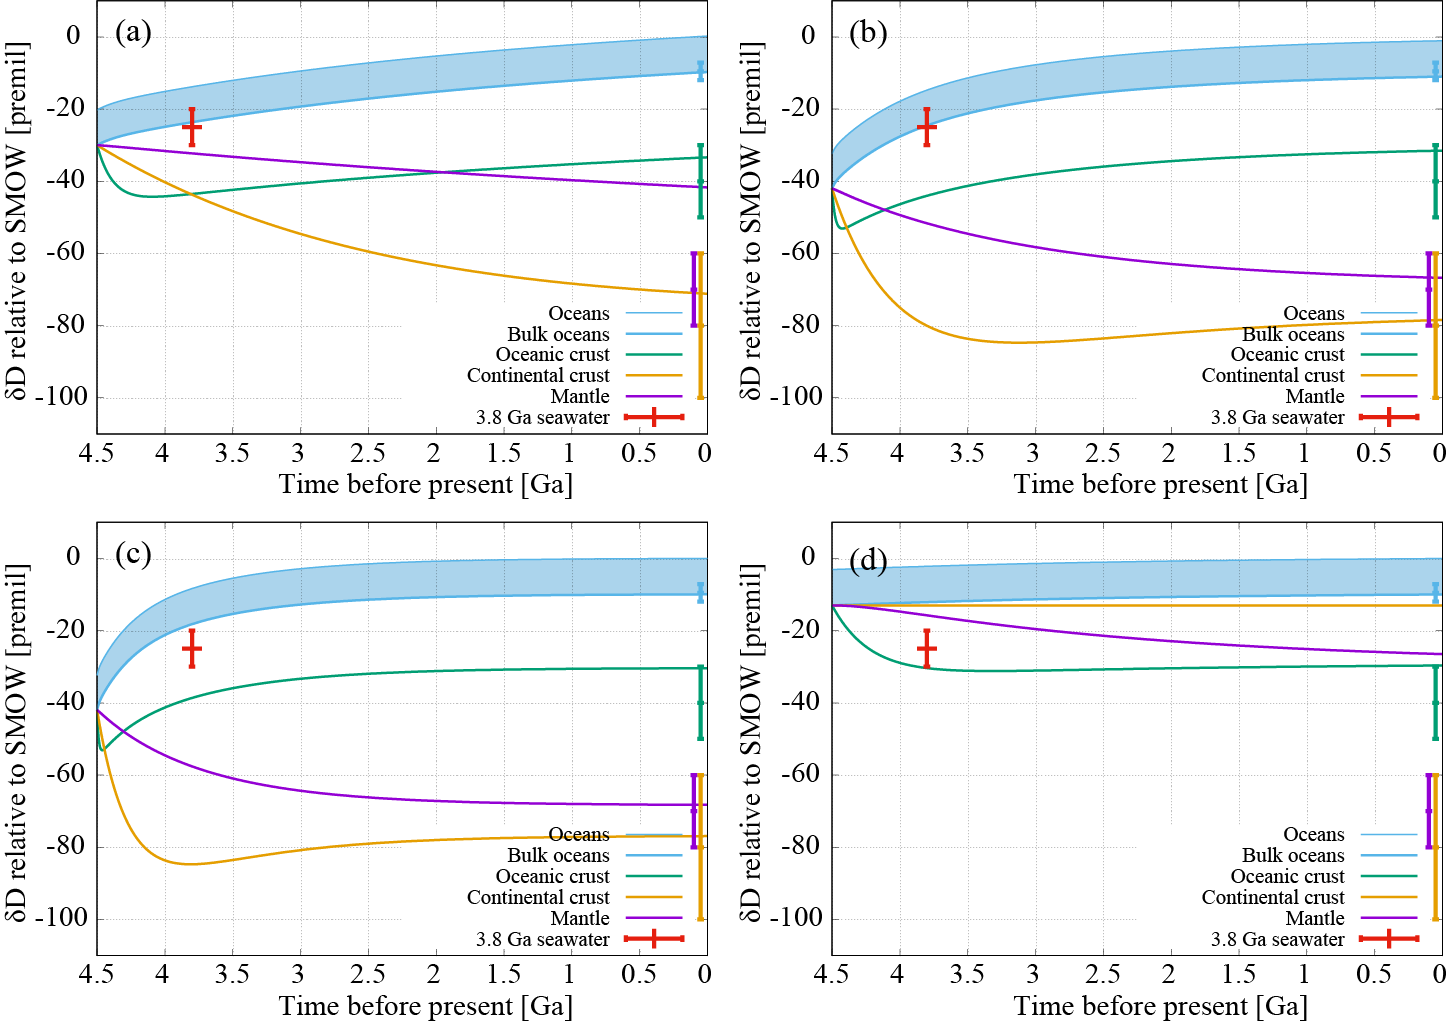
The evolution of and (where i is an arbitrary reservoir) in the slower PT model assuming and is shown in Figure 3a. The oceanic increased through time because of the isotopic fractionation from seafloor alteration, slab dehydration, and chemical alteration of continents. All of these processes led to D-enrichment in liquid water. The water in the oceans decreased in response to the increase of the water in sediments because continental growth promoted chemical alteration. The mantle decreased through time because of the subduction of deuterium-poor water as hydrous minerals. The continental crust increased through time following the increase of the oceanic . The oceanic crust initially decreased because of the isotopic fractionation by seafloor alteration and then increased in the latter period time following the increase of the oceanic . The integrated increase in caused by the deep water cycle and continental growth reached ‰, which is enough to reproduce the increase of from the low Archean seawater [58]. However, the present-day in the model disagreed with the value inferred from sample analyses [39, 6]. The deep water cycle in our model evolved toward a steady state given by ‰, which is consistent with of the present-day Earth (A and B), but the rates of degassing and regassing are too small to reach the steady state within 4.5 Gyr. The constraints on the continental crust and oceanic crust were satisfied in all cases because both and are in a steady state with the oceanic (A).
Secular net regassing and hydrogen escape can increase (Figures 3b and 3c). The secular regassing transported deuterium-poor water from the oceans to mantle and the hydrogen escape removed deuterium-poor water from the oceans (more precisely, from the atmosphere, which exchanges water with the oceans). The net regassing on present-day Earth in the slower PT model led to steady decrease and increase in and , respectively (Figures 3b). The mantle started to increase at Ga following the increase of the oceanic . The hydrogen escape removed water from the oceans before the GOE at 2.5 Ga (Figures 3c). In contrast to the secular regassing (Figures 3b), the hydrogen escape and its cessation at 2.5 Ga resulted in the kink in the evolution of (and consequently, in that of and ) at 2.5 Ga. The coexistence of the secular regassing diminishes the kink caused by the cessation of hydrogen escape, depending on and (Figures 3d).
A comparison of the results in the slower PT models with the D/H constraints allowed us to constrain and (Figure 2a). Because the change in values was too small to reproduce present-day in the model assuming and (Figure 3a), this provided a lower limit on and that can satisfy the constraint on present-day D/H (the sky-blue line in Figure 2a). We note that there was also a upper limit in these values above which was too large as seen in Figure 2b, but it was outside the range of Figure 2a. On the other hand, the increase in the oceanic inferred from the low of the Archean seawater [58] was reproduced in the model assuming and (Figure 3a). Because both the secular regassing and hydrogen escape promote the increase in , there was an upper limit on and to satisfy the constraint on the Archean seawater (the red line in Figure 2a). All the constraints on D/H were satisfied in the limited range of and (the hatched area in Figure 2a).
The range of and depends on the assumed values of fractionation factors. Within the range of uncertainties (Table 1), assuming smaller fractionation for dehydration led to the hatched area moving to the right (Figure 5a), whereas assuming larger fractionation for degassing led to the hatched area moving to the left (Figure 5c).
The possible late accretion of comets moderately influences the resulting range of and , but the D/H constrains still require at least either one of the two mechanisms: secular net regassing or hydrogen escape (Figure 6a). Because comets have a high D/H ratio, the input resulted in an increase in (Figure 6b), while its contribution to Earth’s water budget ( ocean water, Supplementary text S5) is negligible. The input of D-enriched water decreased and required to reproduce the present-day D/H ratios and increased these fluxes required to reproduce the D/H ratio of the Archean seawater.
3.2 The faster PT model
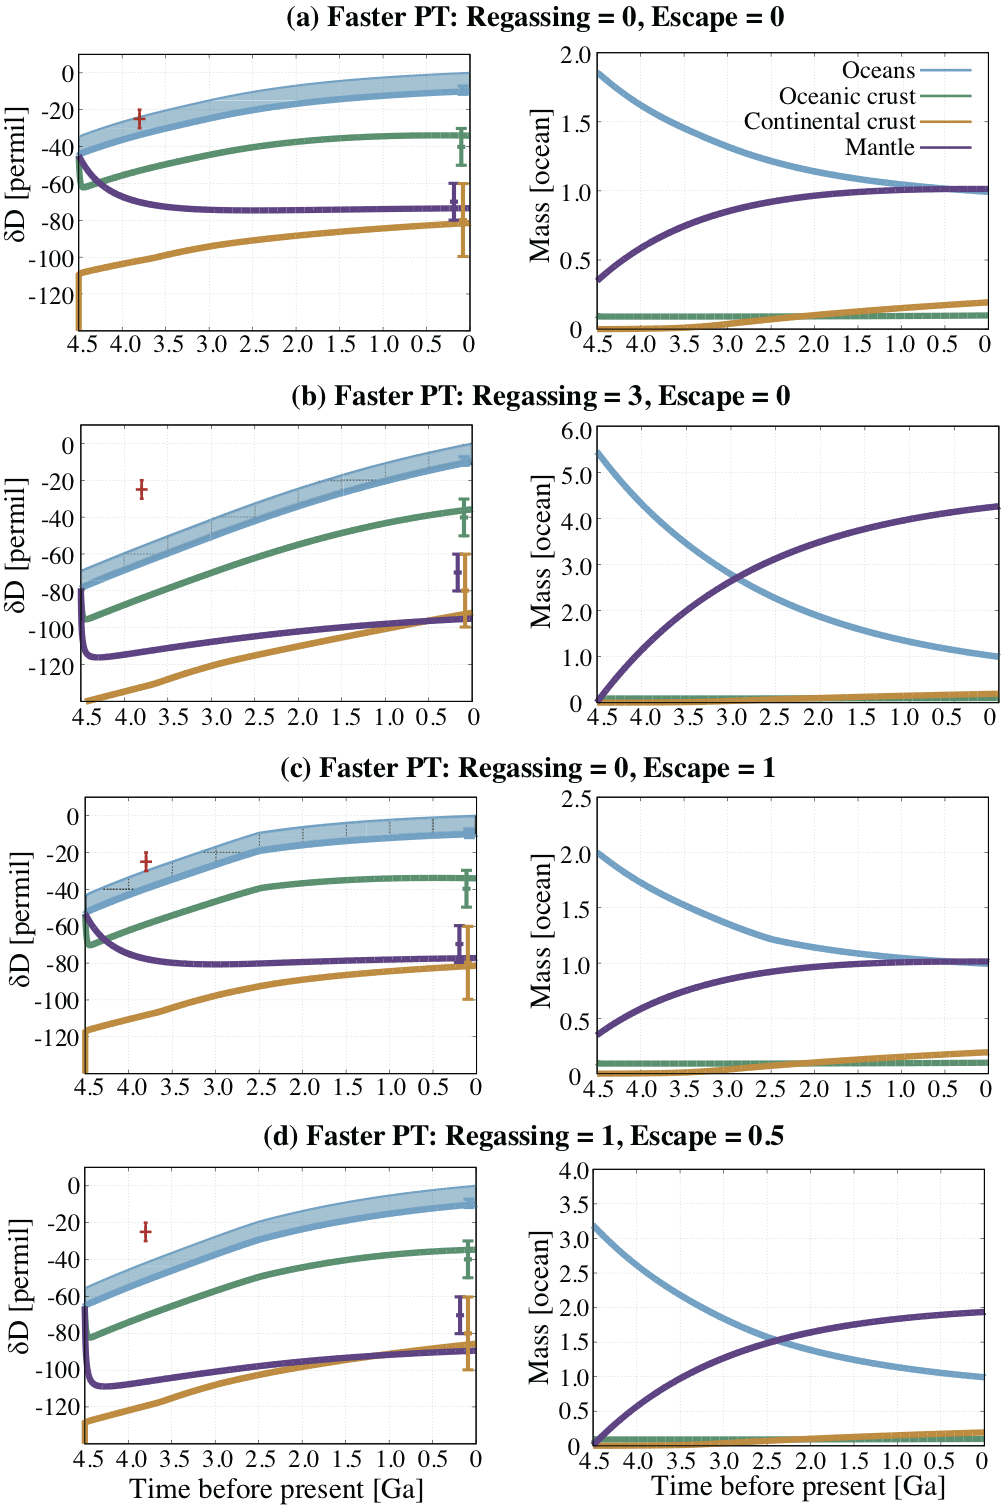
In contrast to the slower PT model assuming and (Figure 3a), the efficient water cycle on early Earth in the faster PT model led to the values nearly reaching steady state in (A) even assuming and (Figure 4a). As with the slower PT model, the isotopic fractionation resulted from the seafloor alteration, slab dehydration, and chemical alteration of continents. The faster PT model assuming the secular regassing showed a continuous increase in both the oceanic and mantle (Figure 4b), which is qualitatively the same as the slower PT model (Figure 3b), but the change is larger because of the higher regassing rate in the past. Though the hydrogen escape had a minor influence on the evolution of the water masses in the reservoirs, its effect on the evolution of D/H was more pronounced (Figures 4c and 4d) because of the efficient fractionation by hydrogen escape compared to the other processes (Table 1).
The faster PT models assuming and satisfied both the constraints from D/H of the present-day water reservoirs and of the Archean seawater (Figure 2b). Because assuming the secular regassing or hydrogen escape increased the change in and the present-day (Figure 4), both the constraints on present-day and Archean D/H gave an upper limit on and (the purple and red lines in Figure 2b, respectively). Neither the secular regassing nor hydrogen escape is necessarily required and the allowed range of and was smaller than that in the slower PT model.
Changing the values of fractionation factors in the faster PT model showed a similar behavior to the slower PT model (Figures 5b and 5d), but the key result—neither the secular regassing nor hydrogen escape is necessarily required in the faster PT model—does not change.
Assuming cometary input slightly changed the range of and allowed to reproduce D/H constraints (Figures 6c). The input of D-enriched water (Figures 6d) decreased and allowed to reproduce the present-day D/H ratios and increased these fluxes allowed to reproduce the D/H ratio of Archean seawater. Again, the results showed that neither the secular regassing nor hydrogen escape is necessarily required in the faster PT model.
Compared to the slower PT models (Figures 2a and 3), the faster PT models resulted in a large decrease in the oceanic volume (Figures 2b and 4). In the faster PT models, different dependence on the thermal evolution is assumed for the regassing (Equation 10) and degassing (Equation 8) as predicted by the boundary-layer model of the thermal evolution [21]. The difference resulted in the net regassing being larger in the earlier period. Even in the case where the balance was assumed for the present-day Earth (), 0.7 oceans of water subducted in 4.5 Gyr (Figure 4a). The faster PT models assuming the net regassing today showed much higher regassing in the past, leading to oceans of water subducted throughout Earth’s history (Figure 4b).
4 Discussion
4.1 Evolution of water on Earth constrained by D/H
The evolution of water on Earth can be constrained by comparing our results with the D/H ratios of present-day water reservoirs (subsection 2.4 and Table 2). The differences in between the present-day oceans, continental and oceanic crust, and mantle were shown to result from isotopic fractionation through the seafloor alteration, slab dehydration, and chemical alteration (Section 3). The D/H ratios of present-day reservoirs can be understood by using the steady state (A and B). We note that a steady state in hydrogen isotope compositions of the oceans and mantle has been proposed by previous studies [70, 26], though dehydration-induced fractionation has not been considered in them. However, the model also showed that the rates of present-day regassing and degassing are small so that the system does not reach the present-day within 4.5 Gyr (Figure 3a). Therefore, the hydrogen escape from the reduced early atmosphere, secular regassing, or faster plate tectonics on early Earth was needed to explain the present-day state of D/H ratios in the reservoirs (Figure 2).
The low of Archean seawater [58] further constrains the evolution of water on Earth (subsection 2.4). Both the slower and faster PT models assuming and resulted in the secular increase in the oceanic as a result of the deep water cycle and continental growth, which agreed with the constraint on the Archean seawater (Figures 3a and 4a). Because the secular regassing and hydrogen escape promote the increase in , the constraint on of the Archean seawater gave an upper limit on and (Figure 2).
These three possibilities—the hydrogen escape, faster plate tectonics on early Earth, and secular regassing—are mutually exclusive. For instance, in our standard model, the slower PT model needed kg/yr or kg/yr (Figure 2a). Assuming larger leads to lower , and vice versa. On the other hand, the faster PT model allowed much smaller values: kg/yr and kg/yr.
Considering the possible ranges of fractionation factors and late accretion of comets (Figures 2, 5, and 6) yielded kg/yr and kg/yr. The upper limit of the present-day regassing rate is higher than the upper limit proposed by Parai and Mukhopadhyay [54] from the constraint on the sea-level change ( kg/yr), but is comparable with the range recently argued by Korenaga et al. [34] considering the change in buoyancy of continental lithosphere relative to oceanic lithosphere through time: kg/yr). The upper limit of the rate of water loss due to hydrogen escape kg/yr corresponds to 900 ppmv of CH4 (Equation S1). The high CH4 concentration might be possible during the early Archean [29].
The secular regassing, hydrogen escape, and chemical alteration promoted by continental growth contributed to the secular decrease of oceanic water in our model. In the slower PT model, the possible maximum value of is given when kg/yr was assumed (Figure 5a). The initial mass of the bulk oceans was 2.5 oceans (considering 1.3 oceans later subducted and 0.2 oceans formed sediments). In the faster PT model, the possible maximum value of is given when kg/yr was assumed (Figure 5b), the initial mass was 2.9 oceans (1.7 oceans subducted and 0.2 oceans formed sediments). These values are comparable with the estimate of Korenaga et al. [34] to reconcile the continental freeboard with the geologic constraints.
We suggest that the D/H constraints are consistent with the secular regassing scenario where water in the present-day mantle entirely resulted from the regassing through out Earth’s history. The scenario is consistent not only with the geologic constraints on continental freeboard when the change in relative buoyancy of continental lithosphere is taken into account [34], but also with the theoretical predictions of crystallization of magma oceans, where the majority of water was partitioned into the atmosphere and oceans [16]. Such initial conditions have been argued to be ideal for initiating the plate tectonics [33].
4.2 Implications for future analysis of D/H on early Earth
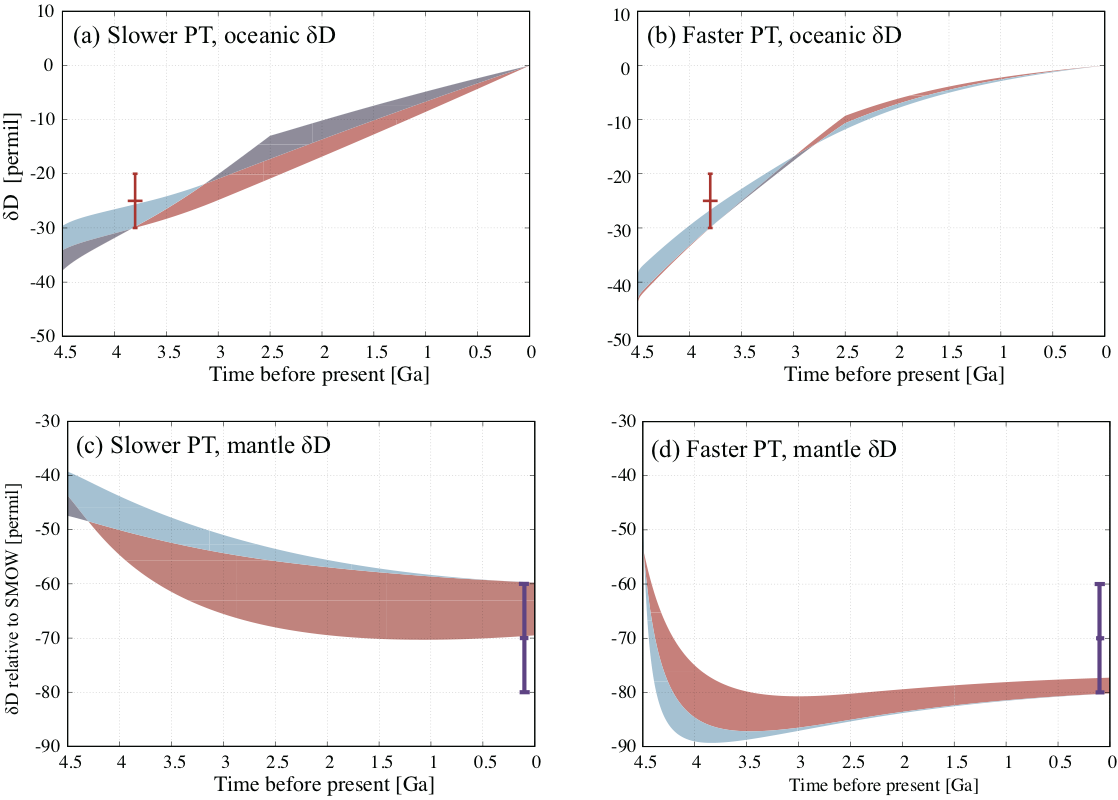
The three scenarios that explain the values of the present-day and Archean reservoirs—the hydrogen escape, secular regassing, and faster plate tectonics on early Earth—can be distinguished by future analyses of samples that record the D/H ratios of the seawater and mantle on early Earth. The evolution of the oceanic and mantle for various sets of and and for the slower and faster PT models is shown in Figure 7. Though the increase in the oceanic has been interpreted as a signature of hydrogen escape [58], Figures 7a and 7b showed that the increase is possible without the escape. Instead, the kink at the time of the GOE, if confirmed, would be a signature of hydrogen escape from reduced early atmosphere. Constraining the oceanic at the time of the GOE would help us to distinguish the scenarios.
While the difference in the oceanic between the slower and faster PT models is small (Figures 7a and 7b), the mantle signal can discriminate between these scenarios (Figures 7c and 7d). In contrast to the slower PT model where the mantle decreased continuously, the faster PT model showed a rapid change in the earlier period. Identifying the past mantle as well as the oceanic would allow us to distinguish the three scenarios. In addition to the D/H ratios of the oceans and mantle in the Archean, those from the Hadean to the Phanerozoic, if combined with our model, would be useful to constrain the evolutionary scenarios.
4.3 Comparison with previous studies
Earth’s deep water cycle and loss by hydrogen escape have been investigated in previous studies by using constraints on D/H. Lécuyer et al. [40] modeled the deep water cycle considering two reservoirs: the oceans and mantle. They argued that hydrogen isotope variations of the oceans in time may have occurred in response to the imbalance between the rates of regassing and degassing. Their model showed that the system eventually reached a steady state in . In contrast, our model showed that kept changing (increasing) in response to the imbalance (regassing) (Section 3). The difference originated from the assumption about the isotopic fractionation: they assumed constant values both for regassed and degassed water, whereas we calculated the values from the fractionation factors (subsection 2.1). In that regard, the results of our model is more realistic than those of Lécuyer et al. [40].
Shaw et al. [63] also modeled the long-term water cycle between the oceans and mantle by taking the isotopic fractionation caused by the seafloor alteration and slab dehydration into account. Assuming the net balance between the regassing and degassing, they showed the continuous increase and decrease in and , respectively. Their model even resulted in all the deuterium in the system being partitioned into the oceans after the model was integrated for a long enough time. Contrary to Shaw et al. [63], our model showed that assuming the balance in the fluxes resulted in and reaching a steady state determined by the fractionation factors (B). The difference originated from the treatment of fractionation factor of the seafloor alteration: they defined the fractionation factor as the ratio of the altered MORB D/H to unaltered MORB D/H, while we defined it as the ratio of altered MORB D/H to seawater D/H. Because the water in the hydrous minerals produced by the seafloor alteration originated from seawater, our assumption is more realistic than that of Shaw et al. [63].
Pope et al. [58] used mass-balance calculations to derive the amount of water lost by the hydrogen escape based on of Archean seawater. They concluded that oceans of water was lost due to the escape. In contrast, we showed that the lower of Archean seawater can be explained by the isotopic fractionation caused by the deep water cycle (seafloor alteration and slab dehydration) and that the hydrogen escape is not necessarily needed (Section 2). The conclusions differ because they neglected the influence of the regassing and degassing on the change in the mass-balance calculations. They justified neglecting the contribution of the mantle to the evolution of by assuming the net balance between the regassing and degassing. However, changes because of the deep water cycle, even in the case where the net balance was assumed (B).
4.4 Other data sets of Precambrian seawater D/H
We adopted the D/H ratio of Archean seawater at 3.8 Ga constrained by Pope et al. [58], but other studies have also estimated the paleo-seawater D/H ratio [41, 38, 23]. Whereas Pope et al. [58] has reported ‰ and ‰ from serpentine samples from 3.8 Ga Isua Supracrustal Belt in West Greenland, Hren et al. [23] has constrained ‰ to ‰ and ‰ to ‰ from 3.4 Ga Buck Reef Chert rocks in South Africa. Also, by assuming ‰ as suggested by a theoretical model [28], Hren et al. [23] has proposed that the Archean seawater had ‰ . Reproducing both ‰ at 3.8 Ga and ‰ at 3.4 Ga in our model is difficult and might require a singular event between the interval. The discrepancy in values in the two studies suggests that these data might be incompatible. Because chert has lower concentrations of water than serpentine and the temperature dependence of D/H fractionation between chert and water is not straightforward, Pope et al. [58] argued that chert is a less well-suited proxy, so that we chose to use Pope et al. [58]’s data as a reliable anchor in the Archean for the evolution of seawater D/H.
Lécuyer et al. [41] has proposed ‰ from mafic-ultramafic samples from the Chukotat Group of the Lower Proterozoic (2.0-1.9 Ga) Cape Smith fold belt. They have reported the values matching closely those found in modern metavolcanic rocks. Kyser et al. [38] has constrained the D/H ratio of 2.8-2.6 Ga seawater as ‰ from serpentine minerals from Archean Abitibi greenstone belt in Ontario. Because the estimates of these earlier studies were less systematic compared to Pope et al. [58], we did not plot them explicitly. However, these estimates are in accordance with the trend from the value of Pope et al. [58] to that of present-day seawater so that adopting them would hardly change our results quantitatively.
4.5 Subduction regimes
This study investigated the secular evolution of the global water cycle with the numerical modeling under a wide range of parameter spaces (Figure 2), yet assumed a limited case of cold subduction (Supplementary text S3, to ) where the major water release from the slab to the surface () occurs mainly due to dehydration of the hydrous minerals of amphibole and lawsonite [60, 45]. However, our model also explored two extreme subduction regimes of faster and slower PT. Subduction velocity along with plate thermal structure and wedge mantle viscosity strongly influences slab surface temperature, which defines the stability of hydrous minerals [30, 55]. Each hydrous mineral may have a different fractionation factor of D/H due to decomposition. In the case of a hot slab, water released by major dehydration events would be in isotopic equilibrium with amphibole (350∘ C), epidote and amphibole (400∘ C), and chlorite, epidote, and amphibole (550∘ C), respectively [45]. The fractionation factors of these hydrous minerals range from to [69, 14, 5]. As this range is similar to that in the case of a cold slab, our results would also apply to the case of a hot slab, though the regassing would mainly be contributed to by the cold-slab subduction. The faster PT might have a smaller net regassing flux because of the dominance of hot slabs, but our model acknowledged this and involved such uncertainties of .
4.6 Onset time of plate tectonics
Our model assumed that plate tectonics has operated since 4.5 Ga, soon after the solidification of magma oceans. The onset time of plate tectonics is controversial, but some studies have suggested that, on the basis of the geochemistry of Hadean zircons, plate tectonics may have already been operating in the Hadean [17, 33, and references therein]. Korenaga [33] argued that the ideal initial water distribution to drive plate tectonics is voluminious oceans underlain by a dry mantle. Such conditions were shown to be consistent with the constraints from hydrogen isotopes (subsection 4.1), though our model can apply to other onset times of plate tectonics.
4.7 Uncertainty in the continental growth model
The behavior of our model depended only weakly on the assumed continental growth model. Thus we demonstrate that the evolution of D/H and surface water mass is a poor constraint on continent formation. As sensitivity analysis, we compared the results using the continental growth models of McLennan and Taylor [46] (Figure 2) and Armstrong [2] (Figure S1) where the continental coverage increased linearly in the first 1 Gyr and kept a constant value. We found that the dependence of the results on the uncertainty in the continental growth model is small compared to that on the uncertainty in the fractionation factors (Figure 5).
5 Conclusions
We modeled the evolution of the masses and D/H ratios of water in the oceans, continental and oceanic crust, and mantle. The model considered water transport and hydrogen isotopic fractionation by seafloor hydrothermal alteration, chemical alteration of continental crust, slab subduction, hydrogen escape, and degassing at mid-ocean ridges, hot spots, and arcs. The differences in D/H ratios between the present-day oceans, oceanic and continental crust, and mantle were shown to result from isotopic fractionation by seafloor alteration, slab dehydration, and chemical weathering. The current degassing and regassing rates were too small to reach the present-day D/H, so an additional mechanism was required. We showed three evolutionary scenarios that can account for the present-day D/H ratios: (a) hydrogen escape from a reduced early atmosphere, (b) secular net regassing, and (c) faster plate tectonics on early Earth expected from conventional thermal evolution models. A low D/H ratio of Archean seawater at 3.8 Ga has been interpreted as a signature of the hydrogen escape from a reduced early atmosphere. However, our model showed that the secular net regassing through out Earth’s history or faster plate tectonics on early Earth can also reproduce the constraints on D/H. These three scenarios are mutually exclusive. The rates of hydrogen escape from early Earth and secular regassing on present-day Earth are constrained to be lower than kg/yr and kg/yr, respectively. The initial oceans could be 2–3 times as voluminous as that on current Earth in the secular regassing scenario. A signature of hydrogen escape before the GOE is visible as a kink in the slope of the evolution of the oceanic D/H ratio. The mantle D/H ratio in the faster plate tectonics model decreased only during the earlier period, whereas the slower plate tectonics model predicted the mantle D/H ratio has been continuously decreasing throughout Earth’s history. Therefore, we emphasize the importance of measurements to constrain mantle D/H ratio throughout Earth’s history, in addition to that of seawater at the time of the GOE, to distinguish these three evolutionary scenarios.
Acknowledgements
We thank two anonymous reviewers for comments and suggestions. HK was supported by JSPS KAKENHI Grant (15J09448) and JSPS Core-to-Core Program “International Network of Planetary Sciences.” CH was primarily supported by the WPI-funded Earth-Life Science Institute at Tokyo Institute of Technology as well as additional support through MEXT KAKENHI grant (15H05832). TU was supported by JSPS KAKENHI Grant (17H06454,17H06459).
Appendix A Derivation of a steady state in D/H
The evolution of values of reservoirs can be understood as the change toward a steady state. From Equation 2, the steady state is given by,
| (13) |
| (14) |
| (15) |
For the parameter values used in our study (Table 1) where water in oceanic crust mostly degassed through arc volcanism, , , and . Here we further assume . Equations 3 and 4 are approximated as and . Substituting these relations for Equations 13-15 gave,
| (16) |
| (17) |
| (18) |
Therefore, we can derive,
| (19) |
| (20) |
| (21) |
Substituting the fractionation factors (Table 1) gave ‰, ‰, and ‰, which is consistent with the values obtained from field samples (Table 2). Here an apostrophe denotes the fractionation from seawater before the correction by adding small reservoirs.
On the other hand, considering a water cycle without slab dehydration () leads to a different steady state. In this case Equation 13 gave,
| (22) |
| (23) |
Equation 23 led to ‰, which is smaller than the measurements (Table 2). These estimates showed that the isotopic fractionation due to slab dehydration is one of the important processes to explain the present-day D/H ratios in the mantle.
Appendix B The constant-flux model
We demonstrated how the evolved toward a steady state (A) in Figure 8. Here we assumed that all fluxes are balanced and two types of water cycle were investigated: (the dehydration model) and (the non-dehydration model). The dehydration model (Figures 8a-c) evolved toward a steady state given by Equation 19, where ‰. On the other hand, the non-dehydration model (Figure 8d) evolved toward a steady state given by Equation 23, where ‰.
S1: Water budgets and D/H
Estimates for the water masses of four reservoirs (the oceans, oceanic crust, continental crust, and mantle) are summarized in Table 1. In our definition, the oceans include small reservoirs that exchange water (and hydrogen) with seawater in short timescales [ yr, 3]: atmosphere, biosphere, surface water, groundwater, and glaciers/polar ice. The sum of water in these small reservoirs corresponds to of total water in bulk oceans by mass. The bulk oceans contain of water (hereafter referred to as 1 ocean). The oceanic crust contains 0.10 oceans of water as bound water () and pore water () [25]. The continental crust contains 0.20 oceans of water mostly as sedimentary rocks () and metamorphic rocks () [3, 34].
Water content in the mantle is uncertain compared to the other reservoirs. Korenaga et al. [34] estimated the water content in the mantle to be 0.56-1.3 oceans. Laboratory and computational experiments on natural and synthetic samples find that the majority of mantle minerals, olivine and pyroxene in the upper mantle and bridgmanite and ferropericlase in the lower mantle, can incorporate around 200 ppm wt. water [7, 53]. Similar values are also observed for the upper mantle source of mid ocean ridge basalts, while more variable and higher values are observed for the source of ocean island basalts. [24, 19]. Thus, the lower bound on the water storage capacity of the upper mantle is around two oceans. The transition zone nominally anhydrous minerals wadsleyite and ringwoodite are capable of storing 3.0 wt.% hydrogen within defects in their crystal structure [67, 66]. However, this capacity decreases to around 1.5 wt.%, or around 5 oceans of water, at transition zone temperatures [43]. Estimates based on seismic observations suggest that the transition zone presently accommodates around one ocean of water [22], although localized hydration is possible [56]. Hydrous silicates that form in subducting oceanic lithosphere are thought to mostly dehydrate by 300 km depth [15], but recent studies have found that cold subducting slabs and aluminum can stabilize dense hydrous magnesium silicates such as phase D and phase H allowing hydrogen transport to the deep Earth [31, 71, 50].
We assumed ocean, oceans, and oceans. Most of our models assumed ocean, but some models showed integrated regassing larger than 1 ocean. In these cases, we increased until the model results in at Gyr, which agrees with the assumed .
S2: Fluxes
The main part of Earth’s deep water cycle is composed of the oceans, oceanic crust, and mantle (Figure 1). Water is transported by degassing (the mantle to oceans) flux at mid-ocean ridges and hot spots, seafloor hydrothermal alteration (the oceans to oceanic crust) flux , and regassing (the oceanic crust to mantle) flux at subduction zones. On present-day Earth, is estimated to be [54, 3, and references therein]. The seafloor alteration flux is likely to be larger than and is estimated as [40, 25, 3, and references therein]. We note that this value is the minimum because the alteration flux of peridotites in lithospheic mantle, which is excluded in the estimate, might be comparable to that of basalt alteration [60, 42]. The majority (up to ) of the subducted water is expected to return to the oceans directly by updip transport, and indirectly by arc volcanism [through the atmosphere and ground water, 8, 3, 34], but the ratio is controversial [21].
The emergence of the continental crust added two other paths to the global water cycle: chemical alteration of continents and weathering (Figure 1). The rate at which the surface water (included in the bulk oceans in our model, Table 1) is bound into hydrated mineral phases by chemical alteration is estimated to be [3]. The rate at which water in the form of hydrated minerals in the continental crust eroded and transported to the ocean basins is estimated to be [3]. Our model does not explicitly include the water flux transported from the oceanic crust to continental crust by emplacement of hydrous magmas generated in the mantle wedge by dehydration of subducting slab. This flux is implicitly treated as a part of arc volcanism flux because the input from the oceanic crust by emplacement of hydrous magmas balances the output to bulk oceans (more precisely, to the atmosphere and ground water) by arc magmatism [3]. The contribution of pore water in sediments to is excluded because the pore water that entered the subduction zone is thought to be entirely expelled from the slab at shallow levels and returned to the oceans [25], though a sedimentary layer having low permeability is proposed to allow pore water to enter the mantle [20, 21].
The balance between the degassing and regassing has been poorly understood. Geochemical estimates implied [24]. Limited sea-level change over the Earth’s history inferred from geologic records has been interpreted as suggesting [e.g., 40, 54]. Net regassing flux () is estimated to be to keep the sea-level change less than 100 m over the Phanerozoic (0.54 Ga to present), as proposed from geologic records [54]. However, Korenaga et al. [34] recently argued (assumed to be constant through time) is needed to keep the sea-level constant by considering that the relative buoyancy of continental lithosphere with respect to oceanic lithosphere was higher in the past. The estimated net regassing transports 1-1.5 oceans into the mantle, if integrated over the duration of 4.5 Gyr. We treated the net regassing flux as a parameter.
Contrary to present-day Earth where hydrogen escape is limited by cold trap of water vapor at tropopause, hydrogen could escape more efficiently because of the transport to the upper atmosphere by reducing species such as CH4. The rate of hydrogen escape before 2.5 Ga can be approximated by diffusion-limited escape [35]. Assuming the diffusion-limited escape, the rate of water loss due to the hydrogen escape is given by [4],
| (24) |
where is the total concentration of all H-bearing compounds ( is the concentration of the species i). Pope et al. [58] proposed to 480 ppmv as a range consistent with paleosols. We treated the escape flux as a parameter.
We assumed , , , , , and , respectively.
S3: Fractionation factors
Seafloor alteration forms various hydrous minerals and is known to be a process which fractionates D/H. The fractionation factors vary among the resulting hydrous minerals as a function of temperature [e.g., 69, 14, 47]. The averaged value for the seafloor hydrothermal condition is approximately [63]. Here an apostrophe denotes the fractionation from the water in oceans before the correction by adding small reservoirs (Section S1: Water budgets and D/H).
Fractionation due to slab dehydration has been proposed to contribute to the long-term D/H evolution in the deep water cycle [63, 62]. The details of this fractionation process have been poorly understood. Here we estimated the fractionation factor by assuming equilibrium fractionation between released water and hydrous minerals. Studies of phase change of a basalt+H2O system showed that a major dehydration event during subduction is an amphibole-lawsonite transition in the case of a cold slab [60, 45]. Water released by the transition returns to oceans, while water released by dehydration of lawsonite at much deeper regions is thought to be transported to the mantle [45]. Whereas the fractionation factor in an amphibole-water system has been reported [69, 14], in a lawsonite-water system it has, to the best of our knowledge, not been investigated. Therefore, we approximated the dehydration-induced fractionation by using the results of experiments for a hornblende-water system: to at [69, 14]. We assumed in our standard model. We note that dehydration of altered peridotites in the lithospheric mantle (lower slab) is not considered to be a fractionation process because this process would resulted in complete dehydration [45].
Chemical alteration of the continental crust to form hydrous minerals is also known to be a fractionation process of D/H [e.g., 65, 64, 47]. Analyses of natural samples have shown ‰ to -60‰ [Table 1, 40, 76]. This could be the result of multiple fractionation processes between oceans-meteoric/surface water and meteoric/surface water-minerals. We assumed the net fractionation factor .
Degassing at MORB and at hot spots might fractionate D/H of released water, but the isotopic fractionation would be smaller than those of seafloor hydrothermal alteration and chemical alteration of continents. OH(l)-OH(v) fractionation has ‰ at [57] and becomes smaller at higher temperature [9]. Although there are no experiments that measured the fractionation factor at temperatures as high as that of MORB and hot spots [¿1700 K, 59], we expect . We assumed in our standard model.
Hydrogen escape due to the photolysis of CH4 produced by photosynthesis and methanogenesis [4] was considered in our model. Methanogen methane has ‰ to -150‰ [4]. We assumed to obtain the upper limit of hydrogen escape.
These fractionation factors are corrected in terms of the difference in D/H between the bulk oceans (including small reservoirs) and oceans (excluding small reservoirs). Assuming a fractionation factor that accounts for the difference, the corrected fractionation factors (k denotes an arbitrary process) are written as .
S4: Initial conditions
The initial masses and D/H ratios of water would be determined by partitioning and fractionation between reservoirs during the solidification of magma oceans. The theoretical models assuming equilibrium partitioning of water predicted that more than of the water would be partitioned into the exosphere at the time of solidification [16, 11]. The amount of water trapped in the mantle is determined by interstitially trapped melts. About half of the initial water budget might be trapped in the mantle if degassing becomes inefficient after the transition from the low-viscosity regime to the high-viscosity regime [16]. Therefore, more than half of the initial water budget should be partitioned into oceans. The constraint was satisfied in all the models in our calculations.
Because of the high temperature of magma oceans (1500 K), the isotopic fractionation between ocean and mantle (namely, vapor and liquid phases at the time) would be well approximated by equilibrium fractionation. Whereas fractionations between OH-bearing species (H2O, OH, and MgOH) and others (H2 and H) are relatively large, those among OH-bearing species are less than 10‰ at least in the vapor phase [51, 52]. A residual OH(l)-OH(v) fractionation has ‰ at [57] and becomes smaller at higher temperature [9]. We assumed that all the reservoirs have the same and iteratively change the value to obtain the present-day oceanic value which equals the SMOW. We note that carbonaceous chondrites, that are usually considered to be the source of water on Earth, have a range of ‰ to 300‰ [40]. We will discuss the cases where we started from different initial conditions of (Appendix C).
S5: Contribution of the late accretion to water budget and D/H
Our model assumed that water had been delivered to Earth before the solidification of magma oceans. The assumption is supported by the evidence that the mantle late veneer, which gives us a direct clue to late accreting materials, has an inner Solar System origin [12] and by the inference that Earth’s core likely contains a huge amount of hydrogen [72].
While the majority of Earth’s water is likely to be delivered early, part of water might have been delivered by the late accretion. A constraint on the late delivery of volatiles is given by noble gases in the terrestrial atmosphere: the present-day atmosphere contains cometary xenon, which constrains the contribution of comets to Earth’s sewawater [, 44]. The limited contribution of comets to the late accretion is also supported by the noble gas abundances in Martian atmosphere [37, 36]. The timing of this possible cometary accretion is unknown, but it is usually assumed to be related to the Late Heavy Bombardment, which occurred prior to Ga [49].
In order to investigate the influence of the possible late accretion of comets, we also explored models where the cometary delivery was implemented by an input of ocean water with ‰ [1] at Ga.
References
- Alexander et al. [2012] Alexander, C. O., Bowden, R., Fogel, M., Howard, K., Herd, C., Nittler, L., 2012. The provenances of asteroids, and their contributions to the volatile inventories of the terrestrial planets. Science 337 (6095), 721–723.
- Armstrong [1981] Armstrong, R., 1981. Radiogenic isotopes: the case for crustal recycling on a near-steady-state no-continental-growth Earth. Philosophical Transactions of the Royal Society of London A: Mathematical, Physical and Engineering Sciences 301 (1461), 443–472.
- Bodnar et al. [2013] Bodnar, R. J., Azbej, T., Becker, S. P., Cannatelli, C., Fall, A., Severs, M. J., 2013. Whole Earth geohydrologic cycle, from the clouds to the core: The distribution of water in the dynamic Earth system. Geological Society of America Special Papers 500, 431–461.
- Catling et al. [2001] Catling, D. C., Zahnle, K. J., McKay, C. P., 2001. Biogenic methane, hydrogen escape, and the irreversible oxidation of early Earth. Science 293 (5531), 839–843.
- Chacko et al. [1999] Chacko, T., Riciputi, R., Cole, R., Horita, J., 1999. A new technique for determining equilibrium hydrogen isotope fractionation factors using the ion microprobe: Application to the epidote-water system. Geochim. Cosmochim. Acta 63 (1), 1–10.
- Clog et al. [2013] Clog, M., Aubaud, C., Cartigny, P., Dosso, L., 2013. The hydrogen isotopic composition and water content of southern pacific MORB: A reassessment of the D/H ratio of the depleted mantle reservoir. Earth Planet. Sci. Lett. 381, 156–165.
- Demouchy and Bolfan-Casanova [2016] Demouchy, S., Bolfan-Casanova, N., 2016. Distribution and transport of hydrogen in the lithospheric mantle: A review. Lithos 240, 402–425.
- Dixon et al. [2002] Dixon, J. E., Leist, L., Langmuir, C., Schilling, J.-G., 2002. Recycled dehydrated lithosphere observed in plume-influenced mid-ocean-ridge basalt. Nature 420 (6914), 385–389.
- Dobson et al. [1989] Dobson, P. F., Epstein, S., Stolper, E. M., 1989. Hydrogen isotope fractionation between coexisting vapor and silicate glasses and melts at low pressure. Geochim. Cosmochim. Acta 53 (10), 2723–2730.
- Dohm and Maruyama [2015] Dohm, J. M., Maruyama, S., 2015. Habitable trinity. Geoscience Frontiers 6 (1), 95–101.
- Elkins-Tanton [2008] Elkins-Tanton, L. T., 2008. Linked magma ocean solidification and atmospheric growth for Earth and Mars. Earth Planet. Sci. Lett. 271 (1), 181–191.
- Fischer-Gödde and Kleine [2017] Fischer-Gödde, M., Kleine, T., 2017. Ruthenium isotopic evidence for an inner Solar System origin of the late veneer. Nature 541 (7638), 525–527.
- Gaillard et al. [2011] Gaillard, F., Scaillet, B., Arndt, N. T., 2011. Atmospheric oxygenation caused by a change in volcanic degassing pressure. Nature 478 (7368), 229–232.
- Graham et al. [1984] Graham, C. M., Harmon, R. S., Sheppard, S. M. F., 1984. Experimental hydrogen isotope studies: hydrogen isotope exchange between amphibole and water. American Mineralogist 69, 128–138.
- Green et al. [2010] Green, H., Chen, W.-P., Brudzinski, M., 2010. Seismic evidence of negligible water carried below 400 km depth in subducting lithosphere. Nature 467, 828–831.
- Hamano et al. [2013] Hamano, K., Abe, Y., Genda, H., 2013. Emergence of two types of terrestrial planet on solidification of magma ocean. Nature 497 (7451), 607–610.
- Harrison [2009] Harrison, T. M., 2009. The Hadean crust: evidence from ¿4 Ga zircons. Annu. Rev. Earth Planet. Sci. 37, 479–505.
- Herzberg et al. [2010] Herzberg, C., Condie, K., Korenaga, J., 2010. Thermal history of the Earth and its petrological expression. Earth Planet. Sci. Lett. 292 (1), 79–88.
- Hirschmann [2006] Hirschmann, M. M., 2006. Water, melting, and the deep Earth H2O cycle. Annu. Rev. Earth Planet. Sci. 34, 629–653.
- Höning et al. [2014] Höning, D., Hansen-Goos, H., Airo, A., Spohn, T., 2014. Biotic vs. abiotic Earth: A model for mantle hydration and continental coverage. Planet. Space Sci. 98, 5–13.
- Höning and Spohn [2016] Höning, D., Spohn, T., 2016. Continental growth and mantle hydration as intertwined feedback cycles in the thermal evolution of Earth. Phys. Earth Planet. Int. 255, 27–49.
- Houser [2016] Houser, C., 2016. Global seismic data reveal little water in the mantle transition zone. Earth Planet. Sci. Lett. 448, 94–101.
- Hren et al. [2009] Hren, M., Tice, M., Chamberlain, C., 2009. Oxygen and hydrogen isotope evidence for a temperate climate 3.42 billion years ago. Nature 462 (7270), 205.
- Ito et al. [1983] Ito, E., Harris, D. M., Anderson, A. T., 1983. Alteration of oceanic crust and geologic cycling of chlorine and water. Geochim. Cosmochim. Acta 47 (9), 1613–1624.
- Jarrard [2003] Jarrard, R. D., 2003. Subduction fluxes of water, carbon dioxide, chlorine, and potassium. Geochemistry, Geophysics, Geosystems 4 (5).
- Javoy [2005] Javoy, M., 2005. Where do the oceans come from? Comptes Rendus Geoscience 337 (1), 139–158.
- Karato and Jung [2003] Karato, S.-I., Jung, H., 2003. Effects of pressure on high-temperature dislocation creep in olivine. Philosophical Magazine 83 (3), 401–414.
- Kasting et al. [2006] Kasting, J. F., Howard, M. T., Wallmann, K., Veizer, J., Shields, G., Jaffrés, J., 2006. Paleoclimates, ocean depth, and the oxygen isotopic composition of seawater. Earth and Planetary Science Letters 252 (1-2), 82–93.
- Kharecha et al. [2005] Kharecha, P., Kasting, J., Siefert, J., 2005. A coupled atmosphere–ecosystem model of the early Archean Earth. Geobiology 3 (2), 53–76.
- Kincaid and Sacks [1997] Kincaid, C., Sacks, I. S., 1997. Thermal and dynamical evolution of the upper mantle in subduction zones. J. Geophys. Res.: Solid Earth 102 (B6), 12295–12315.
- Komabayashi [2006] Komabayashi, T., 2006. Phase relations on hydrous peridotite: Implications for water circulation in the Earth’s mantle. Earth’s Deep Water Cycle, Geophys. Monograph Ser. 168, 29–43.
- Korenaga [2003] Korenaga, J., 2003. Energetics of mantle convection and the fate of fossil heat. Geophys. Res. Lett. 30 (8).
- Korenaga [2013] Korenaga, J., 2013. Initiation and evolution of plate tectonics on Earth: theories and observations. Annu. Rev. Earth Planet. Sci. 41, 117–151.
- Korenaga et al. [2017] Korenaga, J., Planavsky, N. J., Evans, D. A., 2017. Global water cycle and the coevolution of the Earth’s interior and surface environment. Phil. Trans. R. Soc. A 375 (2094), 20150393.
- Kuramoto et al. [2013] Kuramoto, K., Umemoto, T., Ishiwatari, M., 2013. Effective hydrodynamic hydrogen escape from an early Earth atmosphere inferred from high-accuracy numerical simulation. Earth Planet. Sci. Lett. 375, 312–318.
- Kurokawa et al. [2018] Kurokawa, H., Kurosawa, K., Usui, T., 2018. A lower limit of atmospheric pressure on early Mars inferred from nitrogen and argon isotopic compositions. Icarus 299, 443–459.
- Kurokawa et al. [2014] Kurokawa, H., Sato, M., Ushioda, M., Matsuyama, T., Moriwaki, R., Dohm, J. M., Usui, T., 2014. Evolution of water reservoirs on Mars: Constraints from hydrogen isotopes in martian meteorites. Earth and Planetary Science Letters 394, 179–185.
- Kyser et al. [1999] Kyser, T. K., O’Hanley, D. S., Wicks, F. J., 1999. The origin of fluids associated with serpentinization: evidence from stable-isotope compositions. The Canadian Mineralogist 37 (1), 223–237.
- Kyser and O’Neil [1984] Kyser, T. K., O’Neil, J. R., 1984. Hydrogen isotope systematics of submarine basalts. Geochim. Cosmochim. Acta 48 (10), 2123–2133.
- Lécuyer et al. [1998] Lécuyer, C., Gillet, P., Robert, F., 1998. The hydrogen isotope composition of seawater and the global water cycle. Chem. Geol. 145 (3), 249–261.
- Lécuyer et al. [1996] Lécuyer, C., Gruau, G., Früh-Green, G. L., Picard, C., 1996. Hydrogen isotope composition of early Proterozoic seawater. Geology 24 (4), 291–294.
- Li and Lee [2006] Li, Z.-X. A., Lee, C.-T. A., 2006. Geochemical investigation of serpentinized oceanic lithospheric mantle in the Feather River Ophiolite, California: implications for the recycling rate of water by subduction. Chem. Geol. 235 (1), 161–185.
- Mao et al. [2012] Mao, Z., Lin, J., Jacobsen, S., Duffy, T., Chang, Y., Smyth, J., Frost, D., Hauri, E., Prakapenka, V., 2012. Sound velocities of hydrous ringwoodite to 16 GPa and 673 K. Earth Planet. Sci. Lett. 331-332, 112–119.
- Marty et al. [2017] Marty, B., Altwegg, K., Balsiger, H., Bar-Nun, A., Bekaert, D., Berthelier, J.-J., Bieler, A., Briois, C., Calmonte, U., Combi, M., et al., 2017. Xenon isotopes in 67P/Churyumov-Gerasimenko show that comets contributed to Earth’s atmosphere. Science 356 (6342), 1069–1072.
- Maruyama and Okamoto [2007] Maruyama, S., Okamoto, K., 2007. Water transportation from the subducting slab into the mantle transition zone. Gondwana Research 11 (1), 148–165.
- McLennan and Taylor [1982] McLennan, S. M., Taylor, S., 1982. Geochemical constraints on the growth of the continental crust. J. Geol. 90 (4), 347–361.
- Méheut et al. [2010] Méheut, M., Lazzeri, M., Balan, E., Mauri, F., 2010. First-principles calculation of H/D isotopic fractionation between hydrous minerals and water. Geochim. Cosmochim. Acta 74 (14), 3874–3882.
- Mei and Kohlstedt [2000] Mei, S., Kohlstedt, D., 2000. Influence of water on plastic deformation of olivine aggregates: 1. diffusion creep regime. J. Geophys. Res.: Solid Earth 105 (B9), 21457–21469.
- Morbidelli et al. [2012] Morbidelli, A., Marchi, S., Bottke, W. F., Kring, D. A., 2012. A sawtooth-like timeline for the first billion years of lunar bombardment. Earth and Planetary Science Letters 355, 144–151.
- Nishi et al. [2014] Nishi, M., Irifune, T., Tsuchiya, J., Tange, Y., Nishihara, Y., Fujino, K., Higo, Y., 2014. Stability of hydrous silicate at high pressures and water transport to the deep lower mantle. Nature Geoscience 7, 224–227.
- Pahlevan et al. [2016] Pahlevan, K., Karato, S.-i., Fegley, B., 2016. Speciation and dissolution of hydrogen in the proto-lunar disk. Earth Planet. Sci. Lett. 445, 104–113.
- Pahlevan et al. [2017] Pahlevan, K., Schaefer, L., Elkins-Tanton, L., Desch, S., Karato, S., 2017. Hydrogen isotopic fractionation in the terrestrial magma ocean 48.
- Panero et al. [2015] Panero, W. R., Pigott, J. S., Reaman, D. M., Kabbes, J. E., Liu, Z., 2015. Dry (Mg, Fe) SiO3 perovskite in the earth’s lower mantle. J. Geophys. Res.: Solid Earth 120 (2), 894–908.
- Parai and Mukhopadhyay [2012] Parai, R., Mukhopadhyay, S., 2012. How large is the subducted water flux? New constraints on mantle regassing rates. Earth Planet. Sci. Lett. 317, 396–406.
- Peacock [1993] Peacock, S. M., 1993. Large-scale hydration of the lithosphere above subducting slabs. Chem. Geol. 108 (1), 49–59.
- Pearson et al. [2014] Pearson, D., Brenker, F., Nestola, F., McNeill, J., Nasdala, L., Hutchison, M., Matveev, S., Mather, K., Siversmit, G., Schmitz, S., Vekemans, B., Vincze, L., 2014. Hydrous mantle transition zone indicated by ringwoodite included within diamond. Nature 507, 221–224.
- Pineau et al. [1998] Pineau, F., Shilobreeva, S., Kadik, A., Javoy, M., 1998. Water solubility and D/H fractionation in the system basaltic andesite–H2O at 1250 ∘C and between 0.5 and 3 kbars. Chem. Geol. 147 (1), 173–184.
- Pope et al. [2012] Pope, E. C., Bird, D. K., Rosing, M. T., 2012. Isotope composition and volume of Earth’s early oceans. Proc Natl Ac Sci 109 (12), 4371–4376.
- Putirka et al. [2007] Putirka, K. D., Perfit, M., Ryerson, F., Jackson, M. G., 2007. Ambient and excess mantle temperatures, olivine thermometry, and active vs. passive upwelling. Chem. Geol. 241 (3), 177–206.
- Schmidt and Poli [1998] Schmidt, M. W., Poli, S., 1998. Experimentally based water budgets for dehydrating slabs and consequences for arc magma generation. Earth Planet. Sci. Lett. 163 (1), 361–379.
- Schubert and Reymer [1985] Schubert, G., Reymer, A., 1985. Continental volume and freeboard through geological time. Nature 316 (6026), 336–339.
- Shaw et al. [2012] Shaw, A., Hauri, E., Behn, M., Hilton, D., Macpherson, C., Sinton, J., 2012. Long-term preservation of slab signatures in the mantle inferred from hydrogen isotopes. Nature Geoscience 5 (3), 224–228.
- Shaw et al. [2008] Shaw, A., Hauri, E., Fischer, T., Hilton, D., Kelley, K., 2008. Hydrogen isotopes in Mariana arc melt inclusions: Implications for subduction dehydration and the deep-earth water cycle. Earth Planet. Sci. Lett. 275 (1), 138–145.
- Sheppard and Gilg [1996] Sheppard, S., Gilg, H., 1996. Stable isotope geochemistry of clay minerals. Clay Minerals 31 (1), 1–24.
- Sheppard [1986] Sheppard, S. M., 1986. Characterization and isotopic variations in natural waters. Rev. Mineral. Geochem. 16 (1), 165–183.
- Smyth et al. [2004] Smyth, J., Holl, C., Frost, D., Jacobsen, S., 2004. High pressure crystal chemistry of hydrous ringwoodite and water in the Earth’s interior. Phys. Earth Planet. Int. 143-144, 271–278.
- Smyth [1994] Smyth, J. R., 1994. A crystallographic model for hydrous wadsleyte: An ocean in the Earth’s interior? American Mineralogist 79, 021–1024.
- Stevenson et al. [1983] Stevenson, D. J., Spohn, T., Schubert, G., 1983. Magnetism and thermal evolution of the terrestrial planets. Icarus 54 (3), 466–489.
- Suzuoki and Epstein [1976] Suzuoki, T., Epstein, S., 1976. Hydrogen isotope fractionation between OH-bearing minerals and water. Geochim. Cosmochim. Acta 40 (10), 1229–1240.
- Taylor [1974] Taylor, H., 1974. The application of oxygen and hydrogen isotope studies to problems of hydrothermal alteration and ore deposition. Economic geology 69 (6), 843–883.
- Tsuchiya [2013] Tsuchiya, J., 2013. First principles prediction of a new high-pressure phase of dense hydrous magnesium silicates in the lower mantle. Geophys. Res. Lett. 40, 4570–4573.
- Umemoto and Hirose [2015] Umemoto, K., Hirose, K., 2015. Liquid iron-hydrogen alloys at outer core conditions by first-principles calculations. Geophysical Research Letters 42 (18), 7513–7520.
- Walker [1977] Walker, J. C., 1977. Evolution of the atmosphere. New York: Macmillan, and London: Collier Macmillan, 1977.
- Wenner and Taylor Jr [1974] Wenner, D. B., Taylor Jr, H. P., 1974. D/H and 18O/16O studies of serpentinization of ultramaflc rocks. Geochimica et Cosmochimica Acta 38 (8), 1255–1286.
- Young et al. [1998] Young, G. M., Brunn, V. V., Gold, D. J., Minter, W., 1998. Earth’s oldest reported glaciation: physical and chemical evidence from the Archean Mozaan Group ( 2.9 Ga) of South Africa. The Journal of geology 106 (5), 523–538.
- Zhou and Dobos [1994] Zhou, T., Dobos, S. K., 1994. Stable isotope geochemistry of kaolinite from the ”White Section,” Black Ridge, Clermont, Central Queensland: Implications for the age and origin of the ”White Section”. Clays and clay minerals 42 (3), 269–275.