Ultrafast Charge Transfer at a Quantum Dot/2D Materials Interface Probed by Second Harmonic Generation
Abstract
Hybrid quantum dot (QD) / transition metal dichalcogenide (TMD) heterostructures are attractive components of next generation optoelectronic devices, which take advantage of the spectral tunability of QDs and the charge and exciton transport properties of TMDs. Here, we demonstrate tunable electronic coupling between CdSe QDs and monolayer WS2 using variable length alkanethiol ligands on the QD surface. Using femtosecond time-resolved second harmonic generation (SHG) microscopy, we show that electron transfer from photoexcited CdSe QDs to single-layer WS2 occurs on ultrafast (50 fs - 1 ps) timescales. Moreover, in the samples exhibiting the fastest charge transfer rates (50 fs) we observed oscillations in the time-domain signal corresponding to an acoustic phonon mode of the donor QD, which coherently modulates the SHG response of the underlying WS2 layer. These results reveal surprisingly strong electronic coupling at the QD/TMD interface and demonstrate the usefulness of time-resolved SHG for exploring ultrafast electronic-vibrational dynamics in TMD heterostructures.
pacs:
Hybrid structures containing both quantum dots (QDs) and 2D transition metal dichalcogenides (TMDs) leverage both the constituent 0D and 2D materials’ favorable properties. 2D TMDs contribute high charge carrier mobilitiesRadisavljevic et al. (2011); Baugher et al. (2013); Li et al. (2016) to mixed-dimensional heterostructures, while 0D QDs can provide strong, spectrally tunable broad-band absorption and efficient narrowband emission. Through careful selection of the 2D material and QD, the hybrid structure can be tuned to a specific application. Electronically insulated QDs have been used to sensitize 2D materials via resonant energy transfer, revealing anomalous energy transfer phenomena at 0D/2D interfacesGaudrea et al. (2013); Prins et al. (2014); Raja et al. (2016); Zang et al. (2016) and enabling tunable interfacial coupling.Prasai et al. (2015) Furthermore, photodetectors with large gain and facile spectral tunability have been demonstrated by strongly coupling QDs to 2D materials by exchanging the QD native ligands to short, conductive spacer ligands.Konstantatos et al. (2012); Kufer et al. (2015)
Recently, Boulesbaa et al. reported observing ultrafast ( fs) charge transfer at the interface of monolayer WS2 and CdSe QDs.Boulesbaa et al. (2016) This interpretation is surprising because the CdSe cores used in the study were passivated by a 2 nm thick insulating ZnS shell and 18-carbon octadecylamine ligands ( nm dot-to-dot spacing). Ultrafast charge transfer requires wave function overlap between donor and acceptor, and the presence of thick shells and long-chain ligands normally prevents strong electronic coupling in QDs.Talapin et al. (2010) We note that QD/2D hybrid interfaces are difficult to probe with traditional linear spectroscopies, since both the QD and TMD possess large absorption cross sections with overlapping spectral features.Li et al. (2018) In addition, 2D materials are extremely sensitive to the surrounding dielectric environment,Lin et al. (2014); Chernikov et al. (2014) and it can be difficult to distinguish the effects of dielectric screening from direct electronic coupling.
To investigate electronic coupling at a QD/TMD interface, we use time-resolved second harmonic generation (SHG). Monolayer 2H TMD materials, such as the WS2 used in this study, are highly nonlinear and lack inversion symmetry. This results in a large second order nonlinear susceptibility that depends on the number of TMD layers.Li et al. (2013); Malard et al. (2013) Meanwhile, a film of randomly oriented CdSe quantum dots has no appreciable SHG response. Furthermore, SHG is sensitive to charge transfer at polarized interfaces, rendering it uniquely well-suited for studying interfacial dynamics.Tisdale et al. (2010)
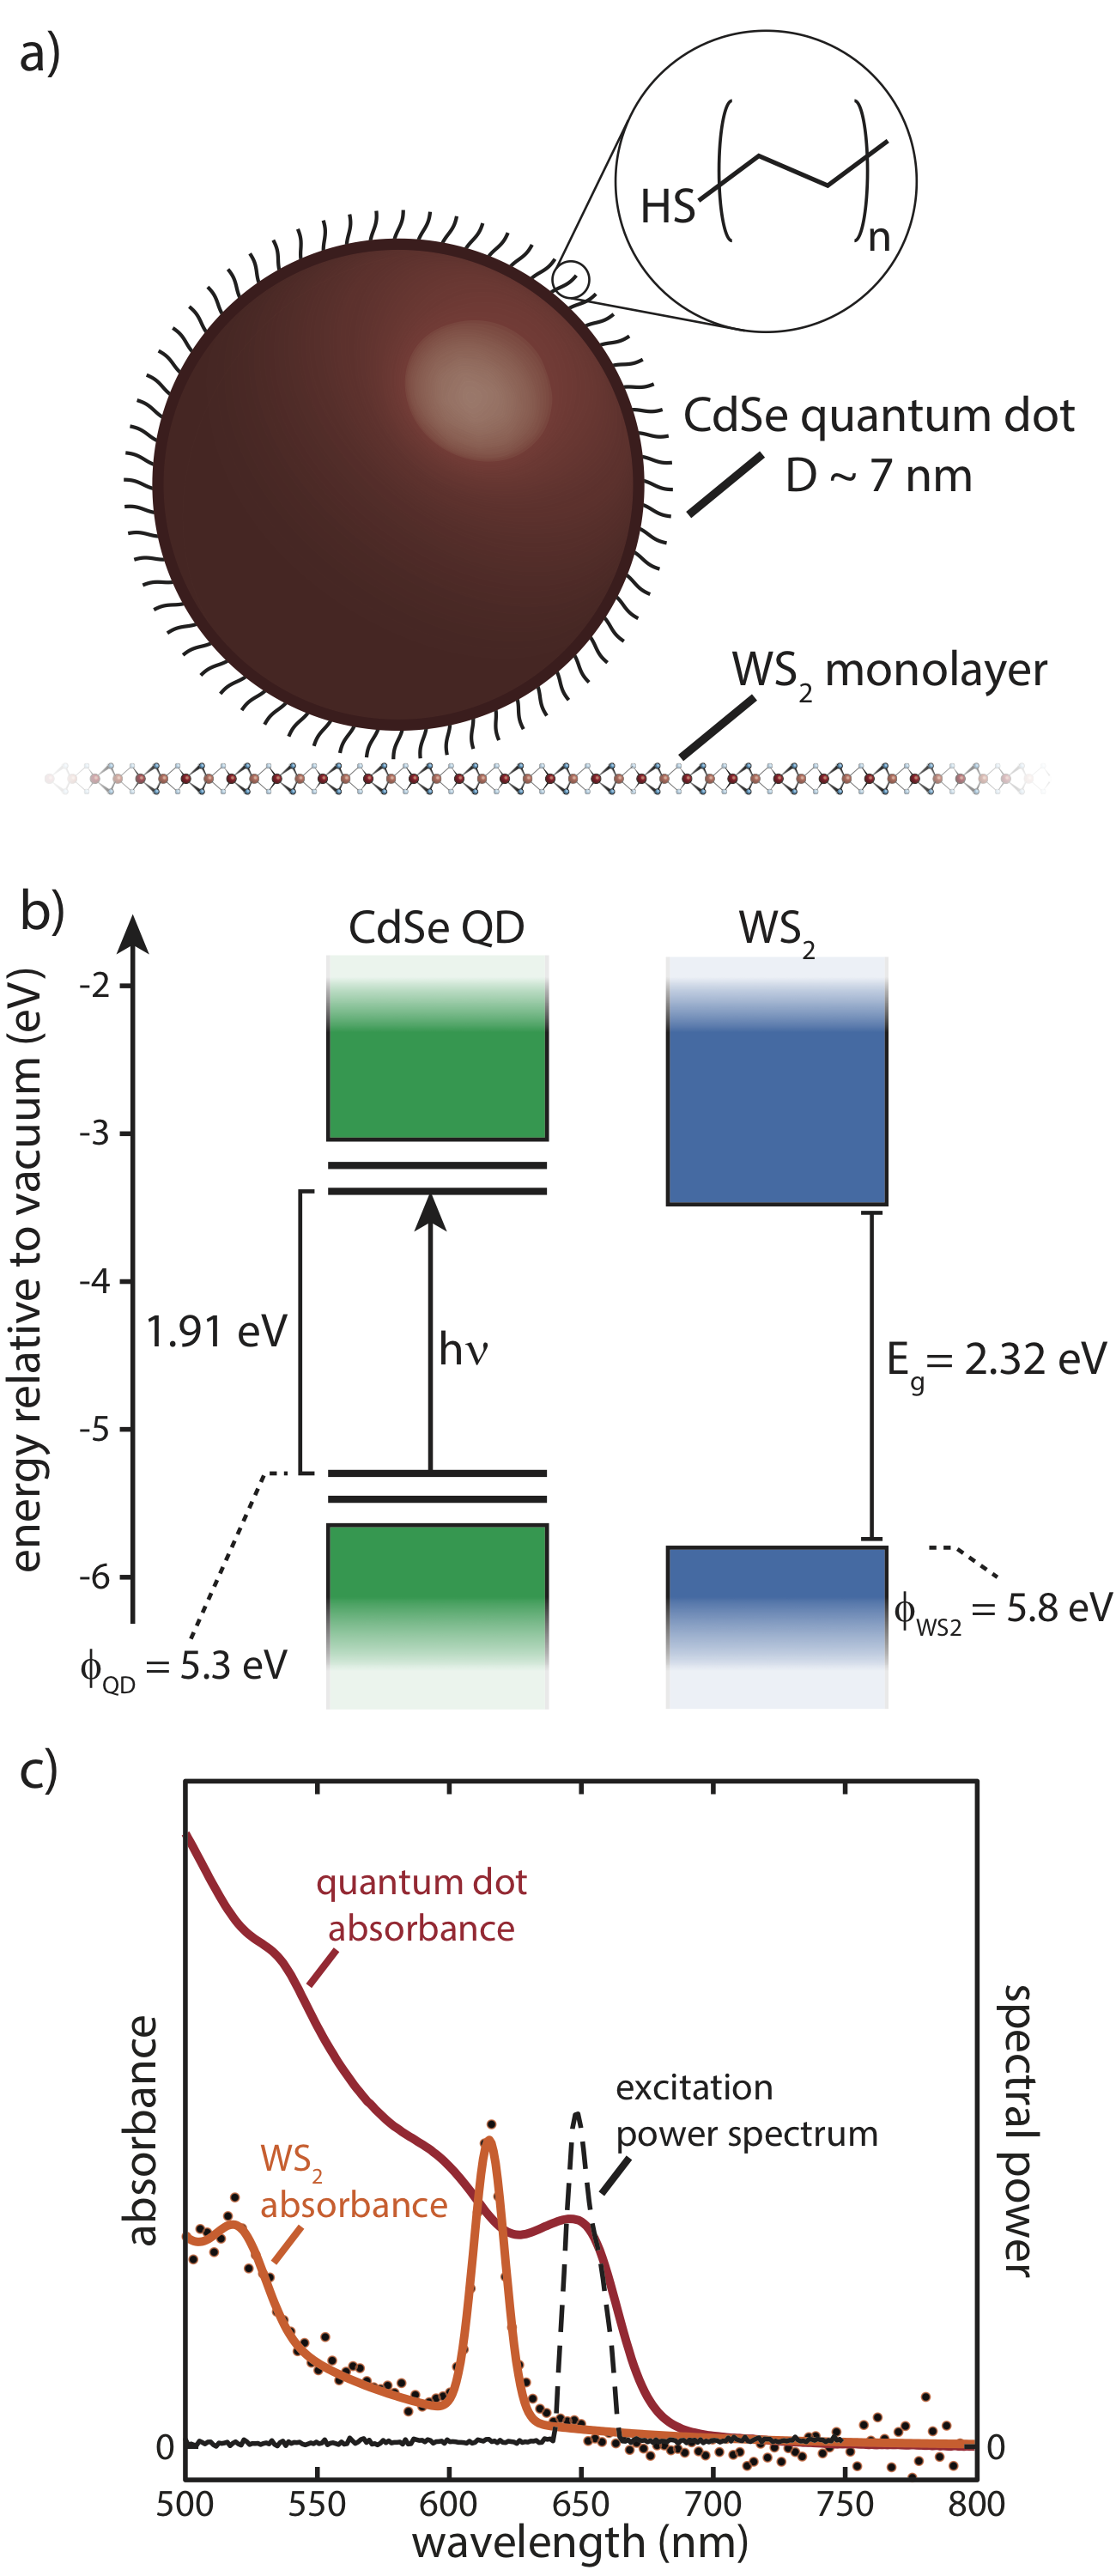
WS2 monolayers were mechanically exfoliated from a bulk single crystal (2D Semiconductors) on a Si/SiO2 substrate. CdSe QDs were synthesized by a previously reported methodPeng and Peng (2001) and suspended in toluene. The QD excitonic peak absorption occurred at nm (Fig. 1c) corresponding to nanocrystals roughly 7 nm in diameter.Mork et al. (2016a) QDs were deposited onto the WS2/SiO2/Si substrate by spin coating and the native octadecylphosphonic acid surface ligands were subsequently exchanged for variable length alkanethiols in a layer-by-layer process.Weidman et al. (2015) In this method, L of a 10 mg/mL QD suspension in toluene was spin-coated onto the WS2/SiO2/Si substrate at 1500 rpm for 30s. The surface was then covered with a 0.1 M solution of the desired alkanethiol (ethanethiol, 1-butanethiol, 1-octanethiol, or 1-dodecanethiol) in acetonitrile and allowed to soak for 30 s. The exchange solution was then spun off. Lastly, the sample was covered with pure acetonitrile and spun at 1500 rpm for 30 s to wash away free ligand. This process was repeated five times to form the nanocrystal film. The resulting interface is illustrated in Fig. 1a.
The estimated band edge alignment at the QD/WS2 interface is shown in Fig. 1b. The valence band maxima for the CdSe cores and WS2 relative to vacuum (the ionization potential, ) were taken from literature. Jasieniak et al. reported size-dependent CdSe QD valence band maxima energies, which the measured using photoelectron spectroscopy.Jasieniak et al. (2011) Keyshar et al. reported the work functions of monolayer TMDs on SiO2 measured using photoelectron microscopy,Keyshar et al. (2017) reporting values for WS2 in good agreement with electronic structure calculations.Kang et al. (2013) Meanwhile, the energy of the excitonic transitions in WS2 and our CdSe QDs are easily obtained from absorption spectroscopy. The WS2 band gap was inferred by adding the reported exciton binding energyChernikov et al. (2014) to the exciton transition energy yielding a gap, E, in good agreement with scanning tunneling spectroscopy experiments.Hill et al. (2016) The QD layer and WS2 monolayer form a type-II heterojunction, which favors electron transfer from photoexcited QDs to WS2. The QD (solution and film, see Supporting Information) and WS2 absorbance are shown in Fig. 1c; the QD absorbance extends to significantly lower energy than the WS2 monolayer, enabling selective photoexcitation of the QD in the heterostructure.
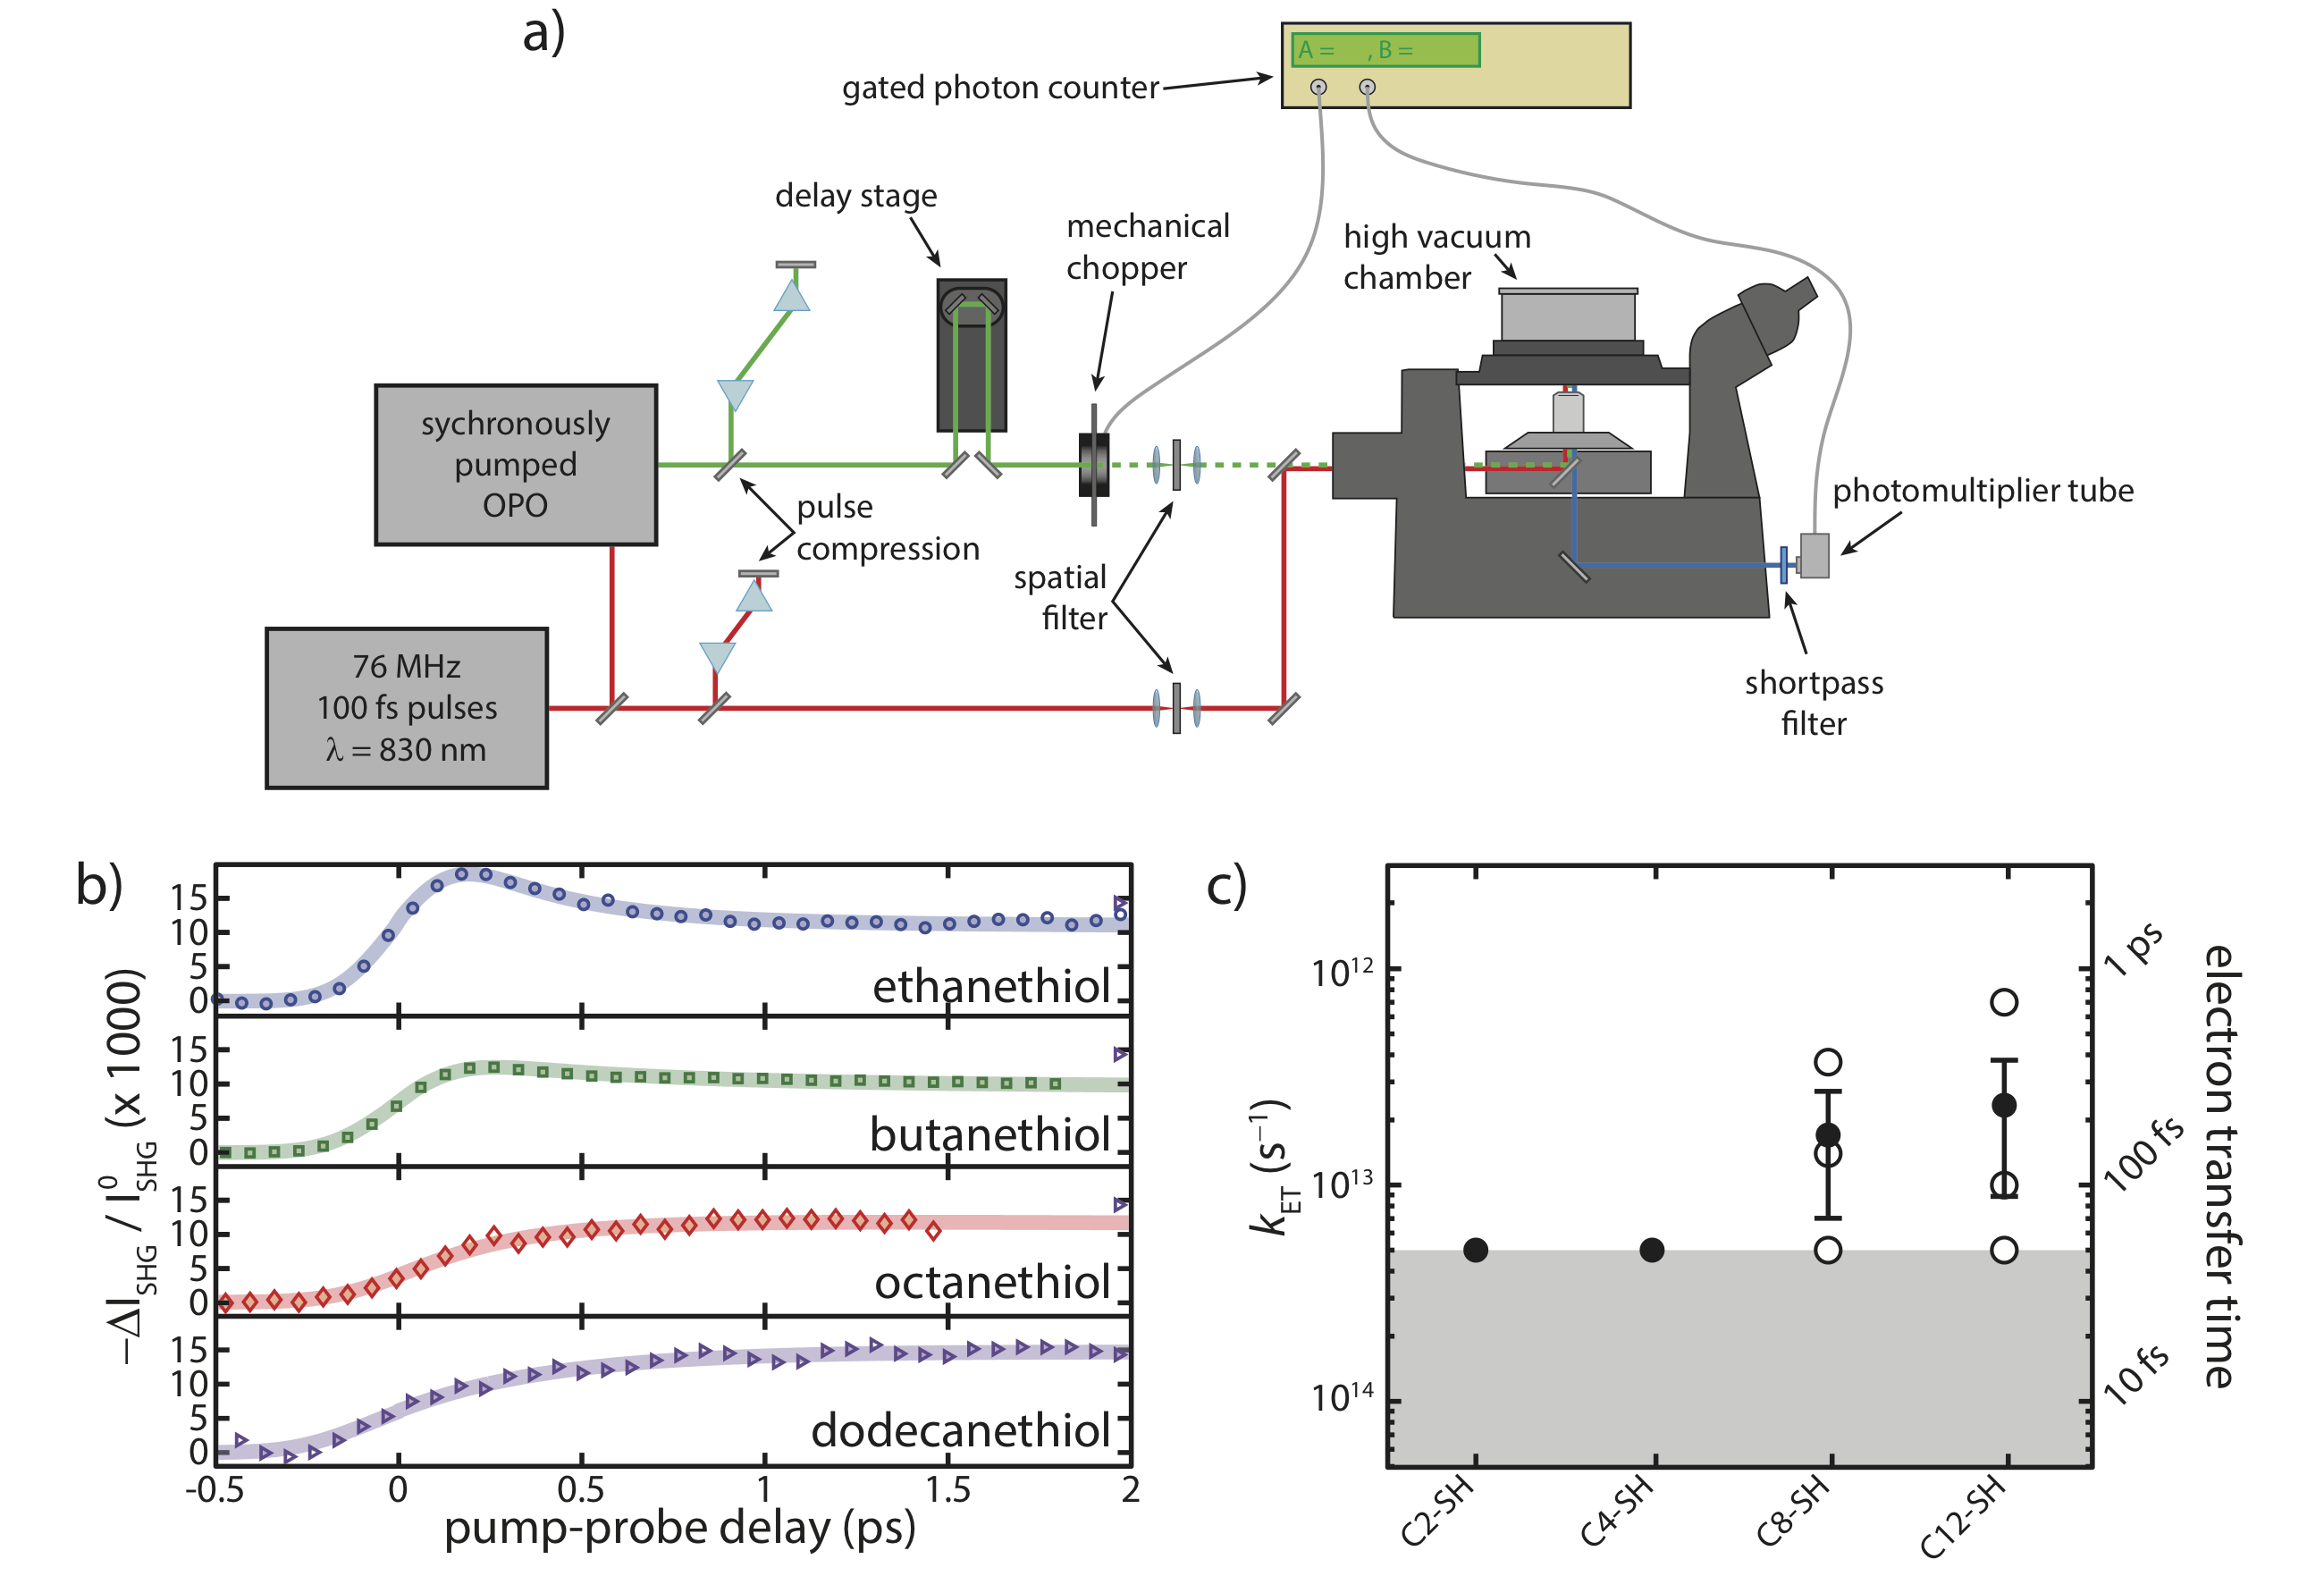
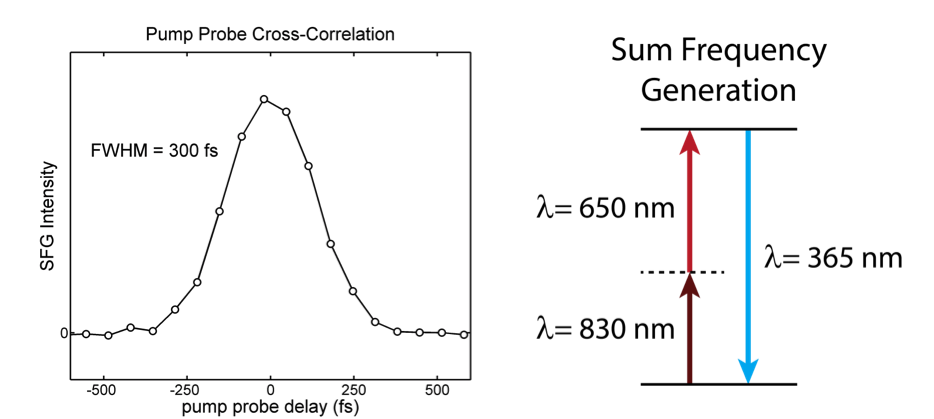
Our time-resolved SHG microscopy instrument is illustrated in Fig. 2a. A 76 MHz Ti:sapphire oscillator (Coherent, Mira-HP) generates 100 fs, nm pulses, which synchronously pump an optical parametric oscillator (OPO, Coherent, Mira-OPO). The OPO generates 100 fs pulses of tunable wavelength ( to 700 nm), which we use to photoexcite the sample. A 0.15 mJ/cm2 pulse at nm excites the QDs, and after a variable waiting period, SHG response of the sample is probed by a nm, 2 mJ/cm2 pulse. Some fraction of the probe pulse is converted to the second harmonic, which is then transmitted through a short pass filter and detected by a photomultiplier tube (PMT). The pump-induced change in the SHG response is found by mechanically chopping the pump and using a gated counter to count SHG photons in the presence and absence of the pump pulse. Prior to entering the microscope, the pump and probe lines are spatially filtered and collimated to form diffraction-limited Gaussian spots at the sample (spot size nm in diameter). The sample was kept under vacuum in a sealed vacuum chamber, situated on top of the microscope stage, to prevent photoinduced damage in air. The smallest transfer times resolvable by SHG are limited the durations of the pump and probe pulses, which are measured by collecting the pump-probe sum frequency generation cross correlation (see Supporting Information).
The rate of electron transfer, which reflects the degree of electronic coupling in the hybrid system, is captured in early-time dynamics of the transient SHG response. We present the early time transient SHG signal, plotted as the change in the SHG intensity as a fraction of the intensity in the absence of the pump, in Fig. 2b. Experimental data are plotted as open symbols while fits to a simple kinetic model described later are plotted as solid lines. When bare WS2 is excited with the nm pump, no transient SHG response is observed (see Supporting Information). In contrast, excitation of the QD/WS2 heterostructure results in a sub-picosecond change in the SHG intensity. QDs capped with ethanethiol show the fastest rise time in the SHG signal, reflecting the fastest electron transfer rate. Longer alkanethiol capping ligands result in monotonically decreasing electron transfer rates as reflected in the elongated rise times.
The ethanethiol sample additionally shows a fast recovery of the SHG signal, likely reflecting direct electron-hole recombination across the interface after the initial electron transfer event, facilitated by particularly strong electronic coupling with this short ligand. The fast recovery feature is less prominent in butanethiol coated dots and disappears entirely for octanethiol and dodecanethiol coated QDs. Fig. 2c shows the extracted electron transfer rate constants for QDs capped with each ligand. The open circles represent values extracted from experiments performed at different locations on the sample. Filled circles represent the average time constant value (error bars represent the standard error). There is considerable variation in the electron transfer time constant at different sample locations, reflecting heterogeneity in the QD/WS2 interface – presumably due to inconsistency in the degree of ligand coverage and orientation of the faceted QDs on the WS2 surface. However, on average, we observe a monotonic increase in the electron transfer time constant as the capping ligand length is increased.
The observed electron transfer rate constants range from to ps-1, which is surprisingly fast for electron transfer from a CdSe QD. For comparison, optimal electron hopping rates between CdSe cores separated by atomically thin inorganic linkers are calculated to be 1 ps-1 even when the interdot geometry is optimized for transfer.Chu et al. (2011) Effective hopping rate constants in the most conductive CdSe QD solids are at most ps-1.Guyot-Sionnest (2012) One possible explanation for the transient SHG signal is ultrafast hole trapping at the QD surface.Gómez-Campos and Califano (2012) Though this process is known to occur in CdSe QDs, the transient SHG signal dependence on capping ligand length makes such an interpretation less likely.
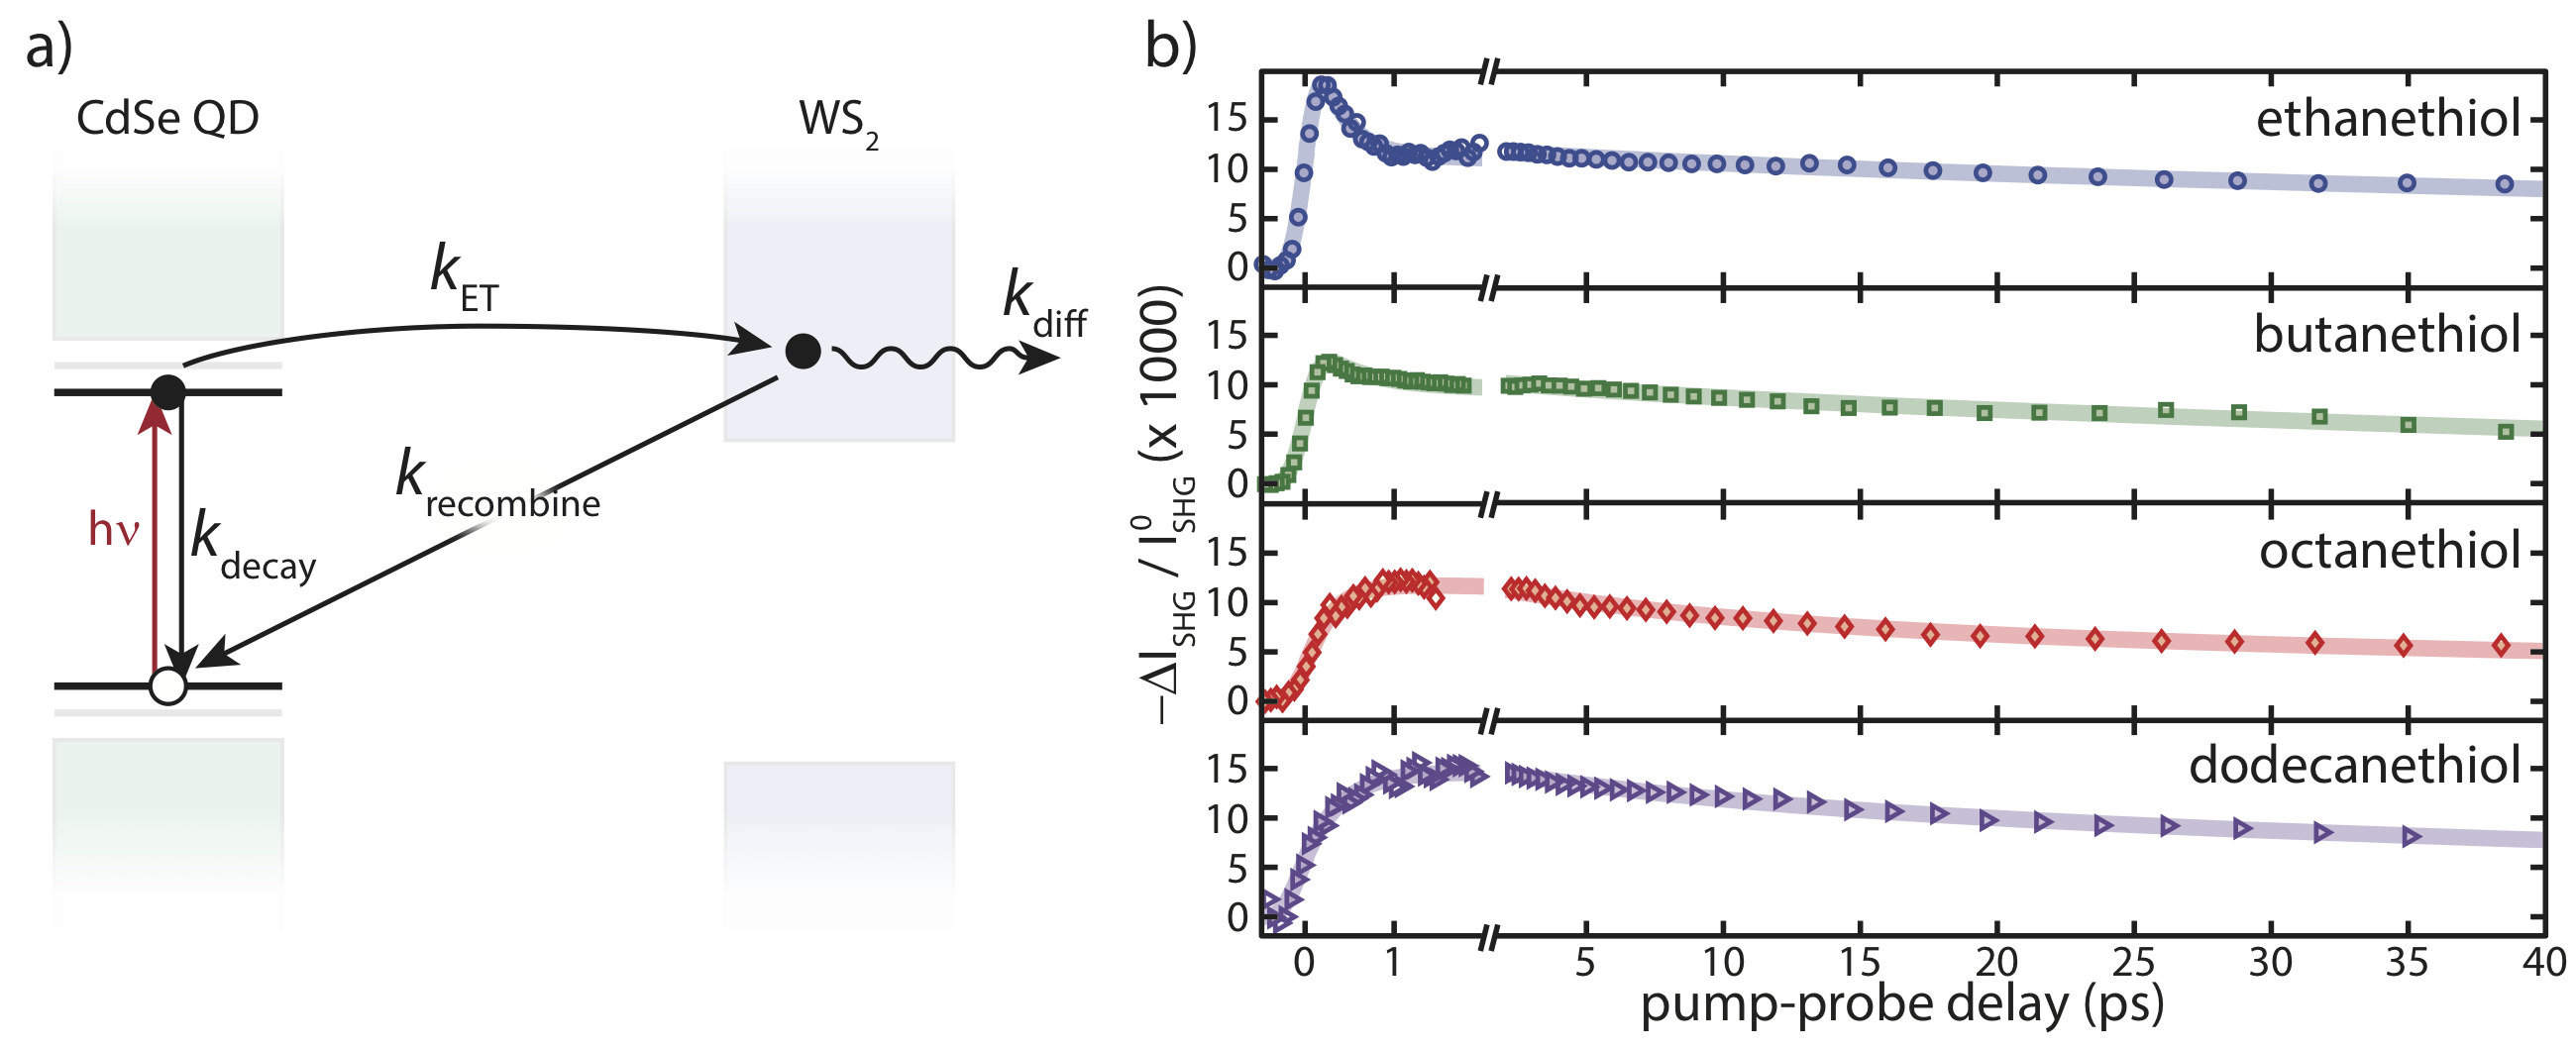
Fig. 3a illustrates several possible pathways available to a photoexcited charge in this experiment. The excited electron can relax back to the QD ground state before it has a chance to transfer . Alternatively, it can transfer to the neighboring WS2 conduction band with the electron transfer rate constant . Once transferred, the electron can recombine directly to the QD ground state with rate constant or diffuse in the WS2 plane, leading to an effective relaxation rate constant . SHG data were fit to this kinetic model using the coupled differential equations,
| (1) | ||||
| (2) |
The time-dependent area densities of excited charges on QDs, , and WS2, , were initialized with initial condition and , reflecting QD-selective excitation. Traces were fit to this kinetic model to extract key rates such as (Fig. 2b). For direct comparison to experimental data, the modeled kinetics were convolved with the pump-probe sum frequency generation cross correlation.
Fig. 3b shows the SHG signal recovery dynamics for samples coated with the four capping ligands. The decaying portions of the traces are fit to biexponentials, which are plotted as thick, transparent lines. The long time dynamics reflect a complicated set of processes that occur following electron transfer, including lateral diffusion within the WS2 plane and subsequent recombination with a hole. The long-time relaxation rate constant, , varied somewhat by sample location but did not show a clear dependence on QD ligand.
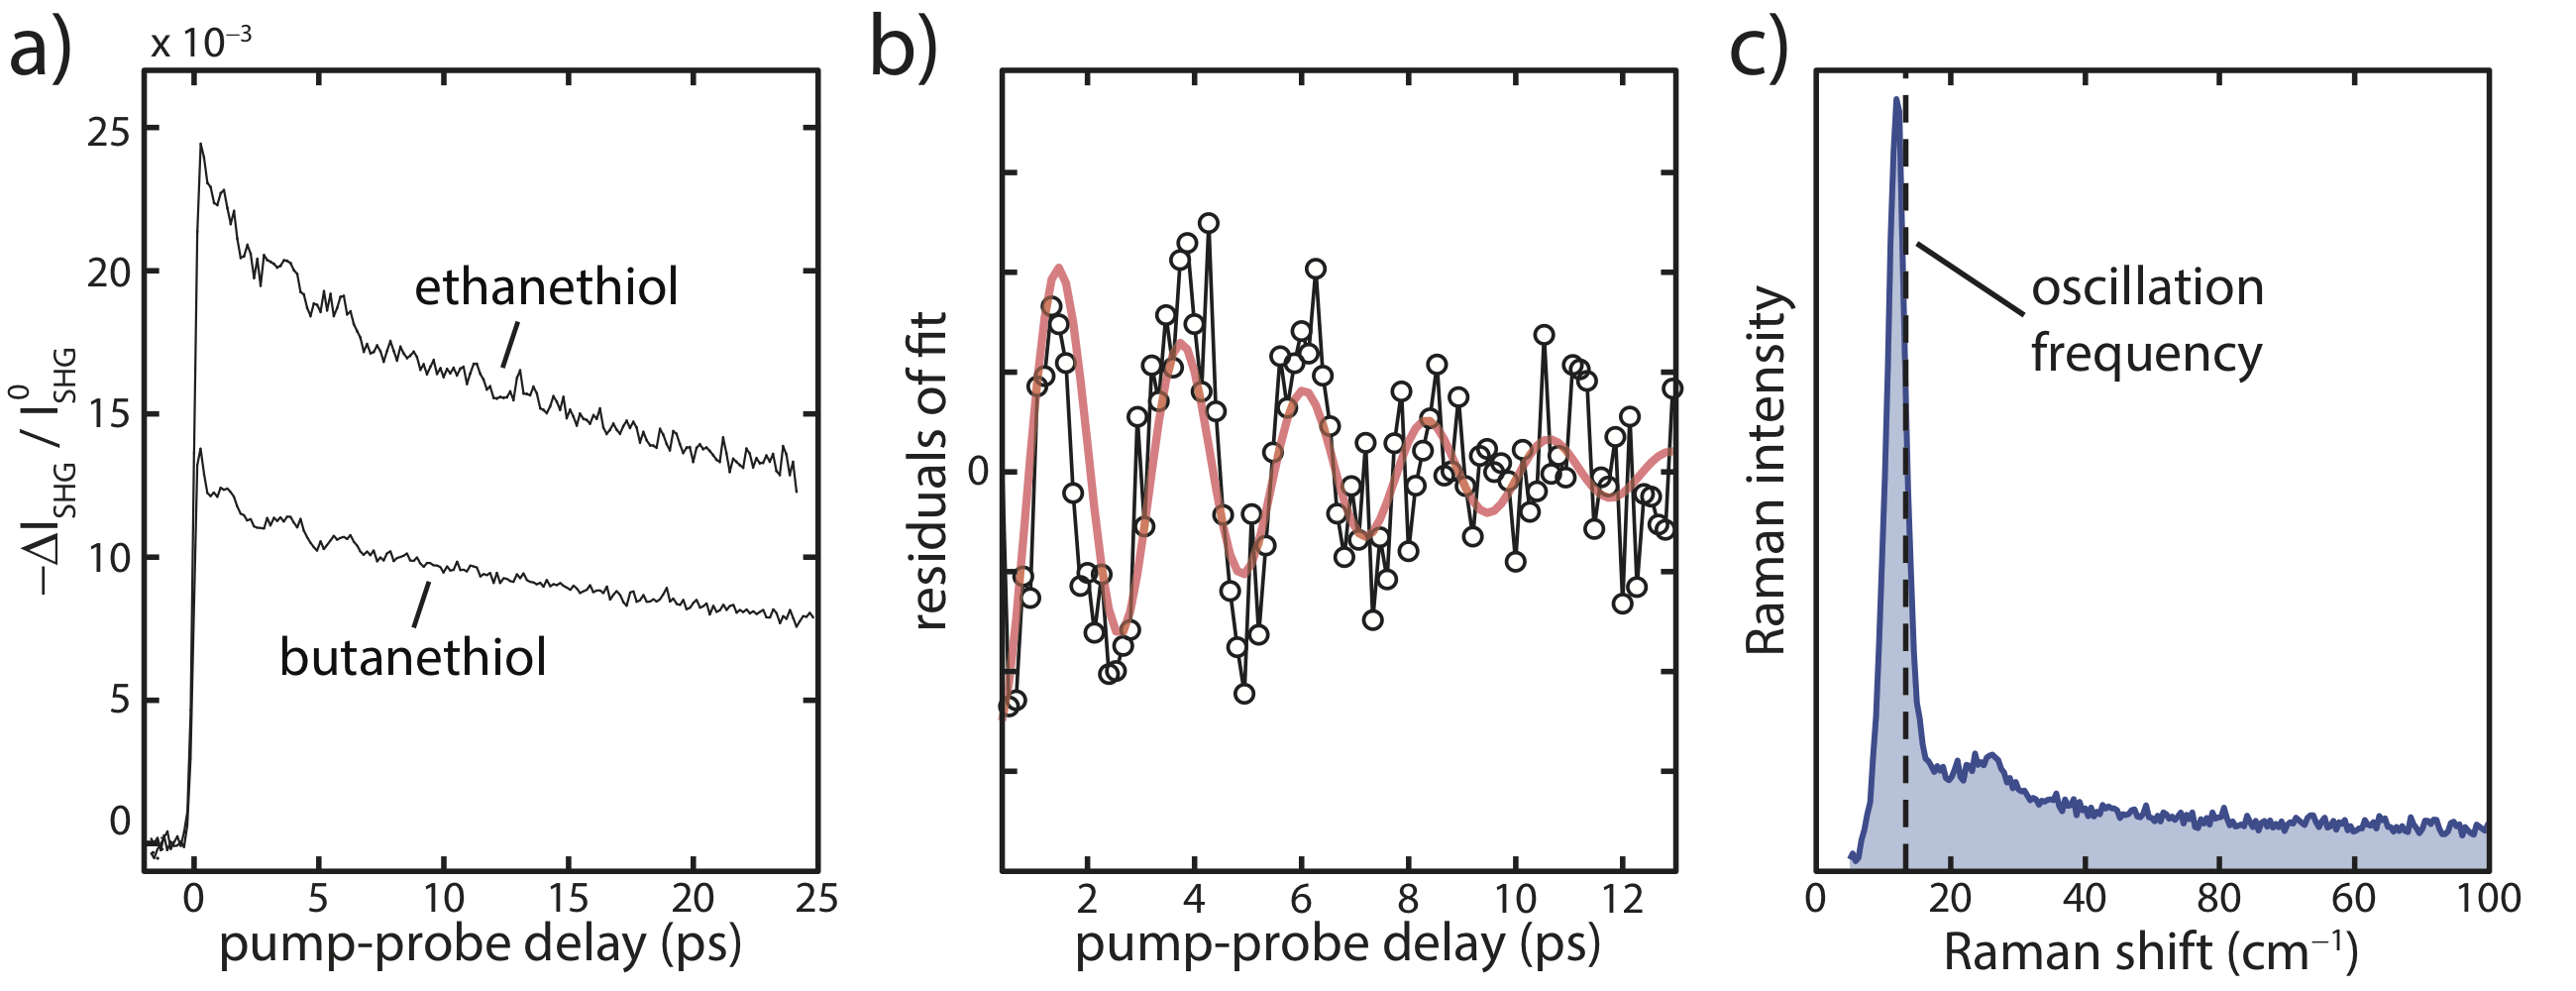
QDs capped with ethanethiol and butanethiol exhibited the fastest electron transfer dynamics. When transient SHG signals from these samples were collected for longer integration times (to improve signal-to-noise ratio), coherent oscillations in the transient SHG data became apparent (Fig. 4a). These oscillations were not observed in WS2-only or QD-only samples. Notably, oscillations were also not observed in octanethiol and dodecanethiol samples, indicating that strong electronic coupling – rather than QD photoexcitation alone – is required for their appearance in the transient SHG signal. The oscillatory component of the transient SHG signal was isolated by fitting a biexponential decay to the data and plotting the residuals of the fit. Residuals from the sample with butanethiol-capped QDs are plotted in Fig. 4b (black markers) along with a damped sine wave (red line). The fitted frequency of this oscillatory component is cm-1 0.6 cm-1.
QDs exhibit quantized low-frequency acoustic vibrations analogous to those of an elastic sphere.Mork et al. (2016b); Lee et al. (2017); Saviot et al. (1996); Cerullo et al. (1999) The lowest energy collective vibration corresponds to a radially symmetric breathing mode. This mode is Raman active, and appears in the low-frequency Raman spectrum of the dots used in this system (collected with a previously reportedMork et al. (2016a) experimental apparatus). The Raman spectrum scattered by the 7 nm diameter QDs is plotted in blue in Fig. 4c. The 14 cm-1 Raman breathing mode matches the frequency of the picosecond oscillations in the transient SHG traces. The fitted damping rate, ps-1, corresponds to a cm-1 linewidth, which is similar to the acoustic phonon linewidth in the Raman spectrum (4 cm-1) and consistent with other time-domain measurements performed on CdSe QDs in solution.Sagar et al. (2008)
It is significant that a coherent vibration of the CdSe QD is observed, even though it is the WS2 layer that contributes the SHG signal we measure (CdSe films deposited on glass substrates generated no detectable SHG signal in our instrument). There are two possible explanations for this: 1) strong dielectric coupling, or 2) strong electronic-vibrational coupling at the QD-TMD interface. In the first case, coherent expansion and compression of QDs situated on top of the WS2 surface periodically modulates the dielectric environment surrounding the 2D material, which in turn modulates the nonlinear susceptibility. However, coherent acoustic phonons in QDs can be excited directly upon photoexcitation,Cerullo et al. (1999); Sagar et al. (2008) whereas we only observe coherent oscillations in the case of ultrafast charge transfer.
That coherent oscillations are only observed for the two shortest molecular ligands suggests that explanation 2 – strong electronic-vibrational coupling at the CdSe QD/WS2 interface – is the likely mechanism. In this mechanism, the adiabatic transition state for the donor-acceptor electron transfer process is mixed due to strong electronic coupling.Falke et al. (2014); Scholes (2018); Tisdale and Zhu (2011) Acoustic vibration of the donor QD coherently modulates the electronic coupling strength, creating a vibronic signature in the time-domain second-order nonlinear optical response.
In conclusion, we engineered a QD/TMD system to facilitate fast charge transfer by placing CdSe QD cores directly on a WS2 monolayer separated by short alkanethiol ligands. We adjusted the energetics of the system to exclude all processes except charge transfer and probed the charge transfer dynamics using time-resolved SHG. We were able to tune the rate of charge transfer by changing the QD capping ligand, adjusting the degree of electronic coupling at the QD/WS2 interface. In the case of ethanethiol and butanethiol, the ultrafast transfer process coherently excited a QD acoustic phonon, modulated the SHG response in the time domain. Charge transfer is a fundamental process underlying 0D/2D hybrid optoelectronic devices and this work probes that process spectroscopically at a model interface. The work also demonstrates the advantages of using SHG to probe dynamics at TMD interfaces, which can be difficult to study with linear spectroscopy.
I Acknowledgments
Fabrication of QD/TMD heterostructures was supported by the Samsung Global Research Opportunities (GRO) program. Development of the transient SHG microscope was supported by the U.S. Department of Energy, Office of Basic Energy Sciences, Division of Chemical Sciences, Geosciences & Biosciences under Award Number DE-SC0010538.
References
- Radisavljevic et al. (2011) B. Radisavljevic, A. Radenovic, J. Brivio, V. Giacometti, and A. Kis, “Single-layer MoS2 transistors,” Nat. Nanotechnol. 6, 147–150 (2011).
- Baugher et al. (2013) B. W.H. Baugher, H. O.H. Churchill, Y. Yang, and P. Jarillo-Herrero, “Intrinsic electronic transport properties of high-quality monolayer and bilayer MoS2,” Nano Lett. 13, 4212 (2013).
- Li et al. (2016) S.-L. Li, K. Tsukagoshi, E. Orgiu, and P. Samori, “Charge transport and mobility engineering in two-dimensinal transition metal chalcogenide semiconductors,” Chem. Soc. Rev. 45, 118–151 (2016).
- Gaudrea et al. (2013) L. Gaudrea, K.J. Tielrooij, G.E.D.K. Prawiroatmodjo, J. Osmond, F.J. Garcia de Abajo, and F.H.L. Koppens, “Universal distance-scaling of nonradiative energy transfer to graphene,” Nano Lett. 13, 2030–2035 (2013).
- Prins et al. (2014) F. Prins, A.J. Goodman, and W.A. Tisdale, “Reduced dielectric screening and enhanced energy transfer in single- and few-layer MoS2,” Nano Lett. 14 (2014).
- Raja et al. (2016) A. Raja, A. Montoya-Castillo, J. Zultak, X.-X. Zhang, Z. Ye, C. Roquelet, D.A. Chenet, A.M. van der Zande, P. Huang, S. Jockusch, J.C. Hone, D.R. Reichman, L.E. Brus, and T.F. Heinz, “Energy transfer from quantum dots to graphene and MoS2: The role of absorption and screening in two-dimensional materials,” Nano Lett. 16, 2328–2333 (2016).
- Zang et al. (2016) H. Zang, P.K. Routh, Y. Huang, J.-S. Chen, E. Sutter, P. Sutter, and M. Cotlet, “Nonradiative energy transfer from individual CdSe/ZnS quantum dots to single-layer and few-layer tin disulfide,” ACS Nano 10, 4790–4796 (2016).
- Prasai et al. (2015) D. Prasai, A.R. Klots, AKM Newaz, J.S. Niezgoda, N.J. Orfield, C.A. Escobar, A. Wynn, A. Efimov, G.K. Jennings, S.J. Rosenthal, and K.I. Bolotin, “Electrical control of near-field energy transfer between quantum dots and two-dimensional semiconductors,” Nano Lett. 15, 4374–4380 (2015).
- Konstantatos et al. (2012) G. Konstantatos, M. Badioli, L. Gaudrea, J. Osmond, M. Bernechea, F.P. Garcia de Arquer, F. Gatti, and F.H.L. Koppens, “Hybrid graphene-quantum dot phototransistors with ultrahigh gain,” Nat. Nanotechnol. 7, 363 (2012).
- Kufer et al. (2015) D. Kufer, I. Nikitskiy, T. Lasanta, G. Navickaite, F.H.L. Koppens, and G. Konstantatos, “Hybrid 2d-0d MoS2-pbs quantum dot photodetectors,” Adv. Mater. 27, 176. (2015).
- Boulesbaa et al. (2016) A. Boulesbaa, K. Wang, M. Mahjouri-Samani, M. Tian, A.A. Puretzky, I. Ivanov, C.M. Rouleau, K. Xiao, B.G. Sumpter, and D.B. Geohegan, “Ultrafast charge transfer and hybrid exciton formation in 2d/0d heterostructures,” J. Am. Chem. Soc. 138, 14713–14719 (2016).
- Talapin et al. (2010) D.V. Talapin, J.-S. Lee, M.V. Kovalenko, and E.V. Shevchenko, “Prospects of colloidal nanocrystals for electronic and optoelectronic applications,” Chem. Rev. 110, 389–458 (2010).
- Li et al. (2018) M. Li, J.-S. Chen, P.K. Routh, P. Zahl, C.-Y. Nam, and M. Cotlet, “Distinct optoelectronic signatures for charge transfer and energy transfer in quantum dot-MoS2 hybrid photodetectors revealed by photocurrent imaging microscopy,” Adv. Funct. Mater. , 1707558 (2018).
- Lin et al. (2014) Y. Lin, X. Ling, L. Yu, S. Huang, A.L. Hsu, Y.-H. Lee, J. Kong, M.S. Dresselhaus, and T. Palacios, “Dielectric screening of excitons and trions in single-layer MoS2,” Nano Lett. 14, 5569–5576 (2014).
- Chernikov et al. (2014) A. Chernikov, T.C. Berkelbach, H.M. Hill, A. Rigosi, Y. Li, O.B. Aslan, D.R. Reichman, M.S. Hybertsen, and T.F. Heinz, “Exciton binding energy and nonhydrogenic rydberg series in monolayer WS2,” Phys. Rev. Lett. 113, 076802 (2014).
- Li et al. (2013) Y. Li, Y. Rao, K.F. Mak, Y. You, S. Wang, C.R. Dean, and T.F. Heinz, “Probing symmetry properties of few-layer MoS2 and h-bn by optical second-harmonic generation,” Nano Lett. 13, 3329 (2013).
- Malard et al. (2013) L.M. Malard, T.V. Alencar, P.M. Barboz, K.F. Mak, and A.M. de Paula, “Observation of intense second harmonic generation from MoS2 atomic crystals,” Phys. Rev. B 87, 201401 (2013).
- Tisdale et al. (2010) W.A. Tisdale, K.J. Williams, B.A. Timp, D.J. Norris, E.S. Aydil, and X.-Y. Zhu, “Hot-electron transfer from semiconductor nanocrystals,” Science 328, 1543–1547 (2010).
- Peng and Peng (2001) Z.A. Peng and X. Peng, “Formation of high-quality CdTe, CdSe, and CdS nanocrystals using CdO as precursor,” J. Am. Chem. Soc. 123, 183–184 (2001).
- Mork et al. (2016a) A.J. Mork, E.M.Y. Lee, N.S. Dahod, A.P. Willard, and W.A. Tisdale, “Modulation of low-frequency acoustic vibrations in semiconductor nanocrystals through choice of surface ligand,” J. Phys. Chem. Lett. 7, 4213–4216 (2016a).
- Weidman et al. (2015) M.C. Weidman, K.G. Yager, and W.A. Tisdale, “Interparticle spacing and structural ordering in superlattice PbS nanocrystal solids undergoing ligand exchange,” Chem. Mater. 27, 474–482 (2015).
- Jasieniak et al. (2011) J. Jasieniak, M. Califano, and S.E. Watkins, “Size-dependent valence and conduction band-edge energies of semiconductor nanocrystals,” ACS Nano 5 (2011).
- Keyshar et al. (2017) K. Keyshar, M. Berg, X. Zhang, R. Vajtai, G. Gupta, C.K. Chan, T.E. Beechem, P.M. Ajayan, A.D. Mohite, and T. Ohta, “Experimental determination of the ionization energies of MoSe2, WS2, and MoS2 on SiO2 using photoemission electron microscopy,” ACS Nano 11, 8223–8230 (2017).
- Kang et al. (2013) J. Kang, S. Tongay, J. Zhou, J. Li, and J. Wu, “Band offsets and heterostructures of two-dimensional semiconductors,” Appl. Phys. Lett. 102 (2013).
- Hill et al. (2016) H.M. Hill, A. Rigosi, K.T. Rim, G.W. Flynn, and T.F. Heinz, “Band alignment in MoS2/WS2 transition metal dichalcogenide heterostructures probed by scanning tunneling microscopy and spectroscopy,” Nano Lett. 16, 4831–4837 (2016).
- Chu et al. (2011) I.-H. Chu, M. Radulaski, N. Vukmirovic, H.-P. Cheng, and L.-W. Wang, “Charge transport in a quantum dot supercrystal,” J. Phys. Chem. C 115, 21409–21415 (2011).
- Guyot-Sionnest (2012) P. Guyot-Sionnest, “Electrical transport in colloidal quantum dot films,” J. Phys. Chem. Lett. 3, 1169–1175 (2012).
- Gómez-Campos and Califano (2012) F.M. Gómez-Campos and M. Califano, “Hole surface trapping in CdSe nanocrystals: Dynamics, rate fluctuations, and implications for blinking,” Nano Lett. 12, 4508–4517 (2012).
- Mork et al. (2016b) A.J. Mork, E.M.Y. Lee, and W.A. Tisdale, “Temperature dependence of acoustic vibrations of CdSe and CdSe-CdS core-shell nanocrystals measured by low-frequency Raman spectroscopy,” Phys. Chem. Chem. Phys. 18 (2016b).
- Lee et al. (2017) E.M.Y. Lee, A.J. Mork, A.P. Willard, and W.A. Tisdale, “Including surface ligand effects in continuum elastic models of nanocrystal vibrations,” J. Chem. Phys. 147 (2017).
- Saviot et al. (1996) L. Saviot, B. Champagnon, E. Duval, I.A. Kudriavtsev, and A.I. Ekimov, “Size dependence of acoustic and optical vibrational modes of CdSe nanocrystals in glasses,” J. Non-Cryst. Solids 197, 238–246 (1996).
- Cerullo et al. (1999) G. Cerullo, S. De Silvestri, and U. Banin, “Size-dependent dynamics of coherent acoustic phonons in nanocrystal quantum dots,” Phys. Rev. B 60, 1928–1932 (1999).
- Sagar et al. (2008) D.M. Sagar, R.R. Cooney, S.L. Sewall, E.A. Dias, M.M. Barsan, I.S. Butler, and P. Kambhampati, “Size dependent, state-resolved studies of exciton-phonon couplings in strongly confined semiconductor quantum dots,” Phys. Rev. B 77 (2008).
- Falke et al. (2014) S.M. Falke, C.A. Rozzi, D. Brida, M. Maiuri, M. Amato, E. Sommer, A. De Sio, A. Rubio, G. Cerullo, E. Molinari, and C. Lienau, “Coherent ultrafast charge transfer in an organic photovoltaic blend,” Science 344, 1001–1005 (2014).
- Scholes (2018) G.D. Scholes, “Coherence from light harvesting to chemistry,” J. Phys. Chem. Lett. 9, 1568–1572 (2018).
- Tisdale and Zhu (2011) W.A. Tisdale and X.-Y. Zhu, “Artificial atoms on semiconductor surfaces,” PNAS 108, 965–970 (2011).
II Supporting Information
II.1 Transient SHG Response of a Bare WS2 Monolayer
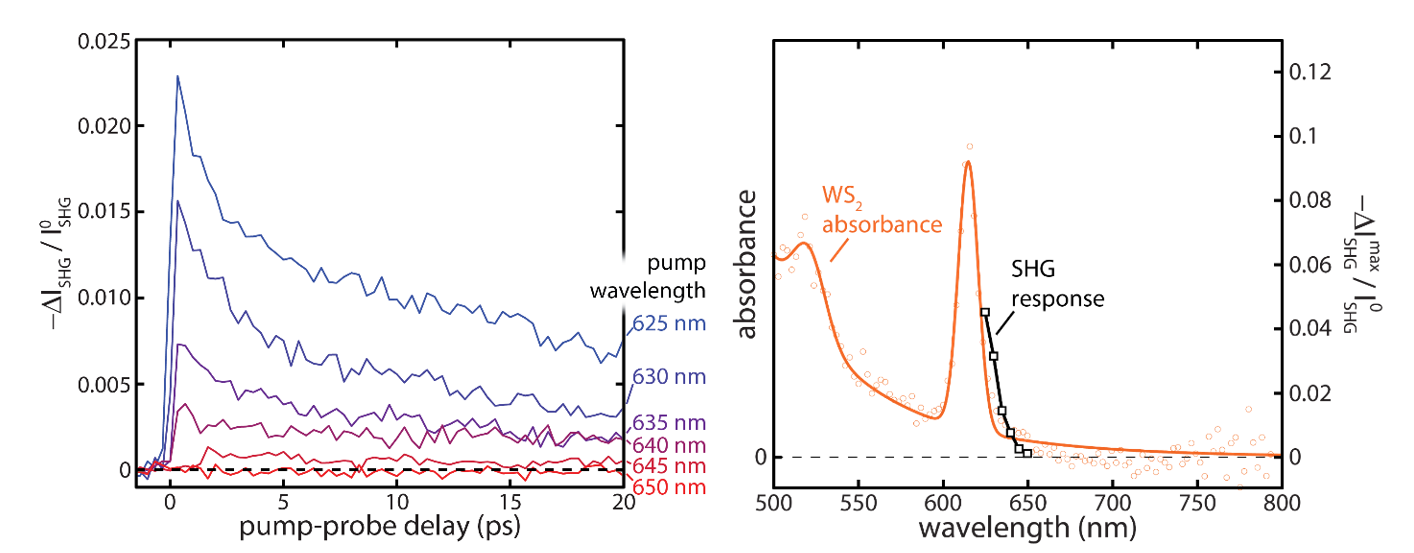
To show that the transient SHG signals observed in the main text arose from absorption by the CdSe dots – and not by direct photoexcitation of the WS2 layer – we performed time-resolved SHG microscopy on a bare WS2 monolayer. Though the monolayer shows appreciable transient response when excited by 625, 630, 635, 640, and 645 nm pump pulses, it shows no discernible response when excited with the excitation spectrum used in the main text ( 650 nm). The transient signals for QDs-on-WS2 presented in the main text reached maxima of roughly at 650 nm excitation wavelength, which is more than an order of magnitude larger than the transient SHG response of the bare WS2 at the same excitation wavelength.
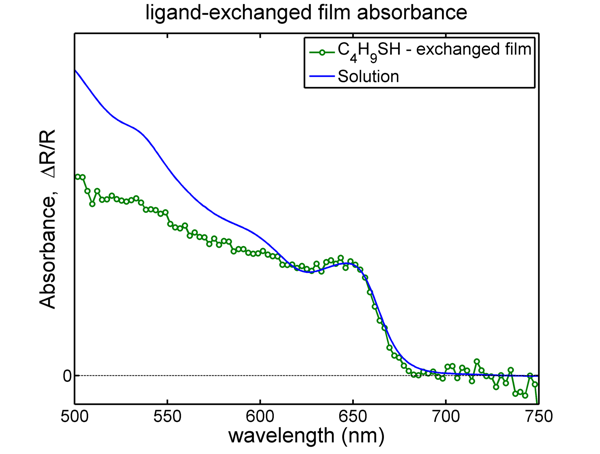
II.2 QD Film Absorbance
II.3 Pump-Probe SFG Cross Correlation