Donostia International Physics Center, Paseo Manuel de Lardizabal 4, 20018 San Sebastian, Spain \alsoaffiliationDonostia International Physics Center, Paseo Manuel de Lardizabal 4, 20018 San Sebastian, Spain
Computational Investigation of Microgels:
Synthesis and Effect of the Microstructure on the Deswelling Behavior
Abstract
We present computer simulations of a realistic model of microgels. Unlike the regular network frameworks usually assumed in the simulation literature, we model and simulate a realistic and efficient synthesis route, mimicking cross-linking of functionalized chains inside a cavity. This model is inspired, e.g., by microfluidic fabrication of microgels from macromolecular precursors and is different from standard polymerization routes. The assembly of the chains is mediated by a low fraction of interchain crosslinks. The microgels are polydisperse in size and shape but globally spherical objects. In order to deeply understand the microgel structure and eventually improve the synthesis protocol we characterize their conformational properties and deswelling kinetics, and compare them with the results found for microgels obtained via underlying regular (diamond-like) structures. The specific microstructure of the microgel has no significant effect on the locus of the volume phase transition (VPT). However, it strongly affects the deswelling kinetics, as revealed by a consistent analysis of the domain growth during the microgel collapse. Though both the disordered and the regular networks exhibit a similar early growth of the domains, an acceleration is observed in the regular network at the late stage of the collapse. Similar trends are found for the dynamic correlations coupled to the domain growth. As a consequence, the fast late processes for the domain growth and the dynamic correlations in the regular network are compensated, and the dynamic correlations follow a power-law dependence on the growing length scale that is independent of the microgel microstructure.
1 Introduction
Microgels are one of the most popular systems in the soft matter community 1. These cross-linked polymer networks, of size typically in the range 100 nm - 100 m, are unique due to their tunability in terms of architecture, softness, permeability and deformability. Their conformational changes in solution and in particular their swelling/deswelling behavior can be achieved, e.g., by changing the temperature, the ionic strength or the pH. The importance of microgels relies on their huge amount of applications 2, 3 such as drug delivery 4, 5, photonic crystals 6, 7, sensors 8, 9, or purification technologies 10, 11, just to name a few.
From a synthetic perspective and commercial applications, hot areas encompass nanoparticle and drug upload, non-polymerization routes, control of composition and stability for efficacy in biological applications, etc. 12, 13, 14, 15 Control of the local network microstructure is highly desirable since this directly influences the efficiency of many of the former applications. Thus, the microstructure may affect both the diffusion of particles in and out of the microgel, as well as its swelling/deswelling time scales. The characterization of the microgel global structure is usually addressed through scattering techniques. Regarding the local microstructure of the network, a highly detailed characterization is still hardly accessible in experiments, despite noteworthy recent advances in super-resolution optical microscopies 16, 17, 18, 19.
Computer simulations constitute a powerful tool for accessing information not directly provided by experiments, for understanding the factors controlling the formation of specific microstructures, and for envisaging routes to tune and improve them. However, most of the computational investigations of microgels in the literature do not implement a realistic synthesis procedure. They instead construct the microgels as spherical cross-linked networks whose dynamics exhibit the expected broad internal fluctuations, but whose topology is equivalent to that of a crystal lattice with nodes connected by polymer strands (regular network) 20, 21, 22, 23, 24. Some works have introduced more realistic networks with spatially disordered distributions of the cross-linked sites (i.e., with a distribution of the strand length) 25. Still, both approaches lack of defects in the network topology (loops, knots, concatenations, etc) which should be generally present in real microgels synthesized with conventional routes. In an effort to construct realistic in silico microgels, Zaccarelli and co-workers 26, 27 have very recently reported a detailed computational investigation of microgels inspired by the usual polymerization routes. By using 2- and 4-patchy particles both chain growth and branching are implemented, producing cross-linked networks whose structural properties are consistent with the standard fuzzy sphere model widely used in the analysis of scattering experiments 28, 29.
In this article we present simulations of an alternative, realistic model of microgels. Instead of following a polymerization route, the microgels are synthesized in silico through cross-linking, within a cavity, of pre-existing polymer chains functionalized with reactive groups. This procedure is inspired, e.g., by microfluidic fabrication of microgels from macromolecular precursors 30, 31, 32, 33. We characterize the global and internal structure of the generated microgels, and discuss their effect on the thermodynamic properties by comparing results with those of a regular (diamond-like) network model. For the same molecular weight and effective degree of cross-linking, the specific microstructure of the microgel has a negligible effect on the volume phase transition (VPT). We find, however, that the microstructure has a significant effect on the deswelling kinetics. The collapse is more heterogeneous in the disordered microgels. We characterize the coarsening kinetics of the microgel by monitoring the growth of the domains during the collapse. The observed behavior is apparantely intermediate between the cases of the coil-to-globule transition for linear polymers and the spinodal decomposition of a liquid-gas system. At early times the domains grow up following a power-law that is almost independent of the network structure. In the disordered microgels the same power-law persists until the end of the collapse. However, an acceleration is observed at late times for the regular networks. This unusual behavior is related to the fast merging of the regularly distributed nucleating centers. Similar trends are found for the dynamic correlations coupled to the domain growth. The fast late processes for the domain growth and the dynamic correlations in the regular network are compensated. As a consequence the dynamic correlations follow a power-law dependence on the growing length scale that is independent of the specific microstructure.
2 Model and simulation details
The experimental procedure we modeled is the synthesis of a microgel in a spherical cavity or droplet, via inter- and intra-molecular irreversible association of linear polymer chains. In our model a single polymer chain consists of a linear backbone of beads. A number of these beads are the reactive groups, randomly distributed along the polymer chain. Each reactive group can form a single irreversible bond with another reactive group in the same or in another chain.
For the non-bonded pair interaction between the polymer beads we used the following potential 34, 35, 26:
| (1) |
By using the parameters and , the non-bonded potential and its first derivative are continuous both at and at the cutoff . The quantities , , and (with the bead mass) set the energy, length, and time scales, respectively. In the following we use reduced units, . In the distance range the non-bonded interaction is a fully repulsive Lennard-Jones (LJ) potential with no local minima. Thus, by using the interaction is already cut-off at and implicitly mimicks good solvent conditions. Bad solvent conditions can be implemented by switching on () the attractive tail, acting on a distance corresponding to the first neighbor shell (). The solvent quality is worsened by increasing the depth of the attractive tail. Besides the non-bonded interactions, permanent bonds between connected beads are implemented through a FENE (finitely extensible non-linear elastic) potential 36:
| (2) |
with and .
The synthesis of the microgel was performed in ideal good solvent (). A total of chains of beads (‘monomers’) were confined inside a spherical cavity of radius . Therefore the number density used in the synthesis was . This qualitatively corresponds to experimental concentrations of the order of mg/mL 36, 37, 38. The interaction between any bead and the spherical wall was given by a repulsive LJ interaction that guaranteed the confinement of the chains during the cross-linking process:
| (3) |
with the shortest distance from the bead to the spherical wall. All the chains contained a fraction of reactive groups . In order to prevent trivial cross-linking events no consecutive reactive groups were allowed in the backbone sequence. After equilibration of the chains inside the cavity the cross-linking of the reactive groups was activated. A permanent bond between two reactive groups was formed (imposing the permanent FENE interaction) if two conditions were fulfilled: (i) none of them was bonded to another reactive group, and (ii) they were at a mutual distance (capture distance). A random choice was made in the case of multiple options, i.e., among the reactive groups within the same capture distance. The slow late stage of the cross-linking process ( remaining unbonded reactive groups) was sped up as follows. We found that such groups were homogeneously distributed inside the cavity. In such conditions we assumed similar barriers for the encountering of any pair of unreacted groups. Thus, we randomly selected a pair of the remaining unreacted groups and implemented an harmonic interaction between the constituents of the pair, in order to approach them to the capture distance and form the bond. This procedure was repeated for the remaining unreacted groups, until full completion of the cross-linking.
The synthesis of the microgel was repeated for 64 different realizations of the initial conditions (same values of and different initial conformations of the chains). In most of the cases (53 of 64) all the polymer chains were connected, through the intermolecular cross-links, to a single network. In the rest of the cases a small disconnected cluster (formed by 1 or 2 chains) was found. Only the 53 microgels containing the whole initial set of chains were used in the analysis of the equilibrium properties and the deswelling transition.
The simulations were performed at (with the Boltzmann constant) under Langevin dynamics, following the integration scheme of Refs. 39, 40 with a time step . After completion of the cross-linking the cavity was removed, leading to the swelling of the generated microgels, which were further equilibrated. Finally, acquisition runs of typically steps were carried out for the analysis of the structural properties at . In order to investigate the deswelling behavior, the equilibrated swollen microgels () were quenched (at infinite rate) to different solvent parameters . The deswelling kinetics was characterized from the quench instant () until equilibration. Further acquisition runs were performed to characterize the equilibrium structure at .
Not surprisingly, the cross-linking produced disordered microgel networks with topological polydispersity (see below). In order to investigate the effect of the local microstructure on the equilibrium and deswelling behavior of the microgels, we compared the results obtained by the former experimentally inspired protocol with those of a built-in regular network. We first placed the cross-linked sites in the nodes of a diamond network. Then we connected each node to its four nearest nodes through identical strings of beads. A sphere centered at the center-of-mass of the network was constructed and all the beads out of the sphere were removed, leading to a finite microgel with diamond-like connectivity, as proposed in several investigations in the literature 20, 21, 22, 23, 24. We tuned the length of the strings connecting the nodes and the size of the sphere in order to obtain diamond microgels as close as possible to the disordered microgels in several properties. Namely, with the choice of 272 network nodes (cross-linked sites) and a total of beads, the simulated diamond and disordered microgels () had very similar values of , macromolecular size and fraction of elastically active cross-links (see next Section). Analogous runs to those of the disordered microgels were carried out, at the same -values, to investigate the deswelling behavior and equilibrium structure of the diamond microgels. To improve statistics, 5 independent runs were carried out for each of the selected microgels at each -value.
3 Equilibrium structural characterization
3.1 Size and shape
We start by characterizing the global structure of the disordered microgels. We calculate the radius of gyration and the asphericity parameter 41. The latter is obtained as a function of the eigenvalues of the gyration tensor, :
| (4) |
The asphericity quantifies deviations from spherosymmetric conformations ().
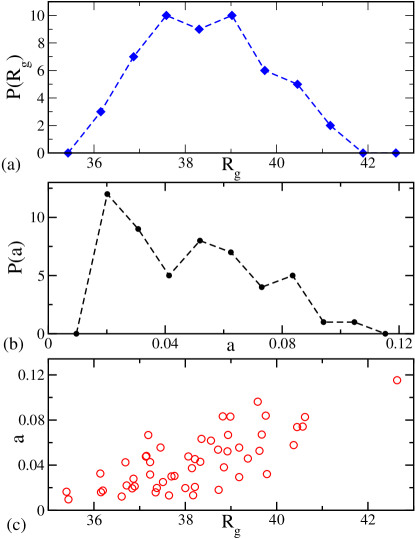
1 summarizes the main structural characteristics of the disordered microgels. As expected, the cross-linking of the chains with different initial configurations and velocities produces different structures of the resulting bond networks, with different size and shape. Thus, for each individual microgel we average the instantaneous values of its radius of gyration and asphericity over its simulation trajectory. We denote such time-averaged values as the and of the individual microgel. Panels (a) and (b) of 1 shows the obtained distributions of the individual and , which account for the intrinsic polydispersity in size and shape arising from the topological polydispersity of the microgels. The whole ensemble of microgels has an average radius of gyration with a weak size polydispersity of about 7 % (full-width at half-maximum, panel (a)). The microgels are also polydisperse in shape, though they are globally quasi-spherical objects (most of the distribution has , see panel (b)). The analysis of the prolateness parameter 41 (not shown) reveals that they have a slight tendency to adopt prolate over oblate conformations. As can be seen in panel (c), there is a correlation between microgel size and shape. Thus, higher values correspond in general to higher asphericity values. The diamond microgels are essentially spherical () and have a time-averaged size of , very close to the mean of the distribution for the disordered microgels.
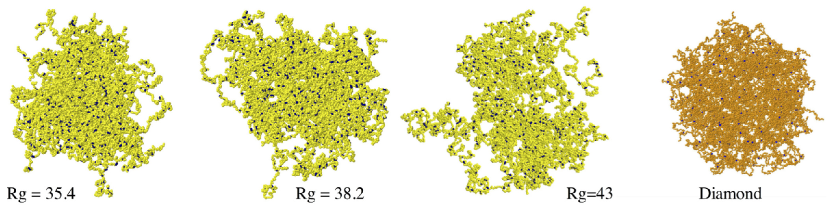
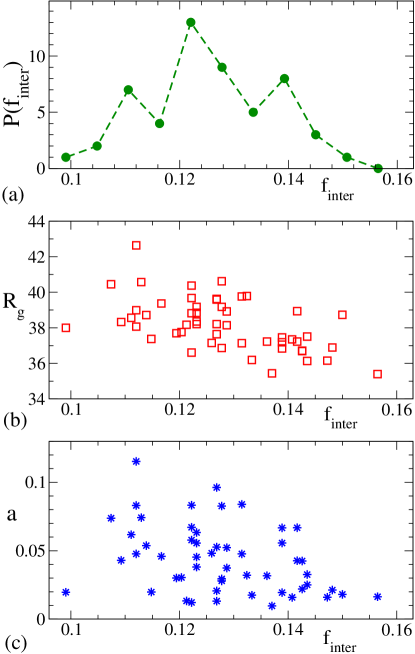
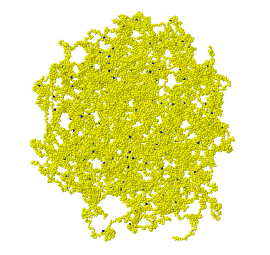
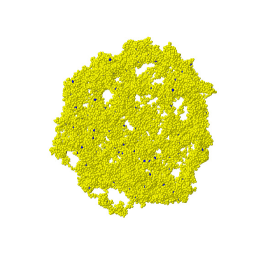
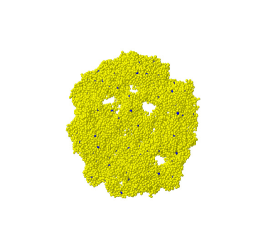
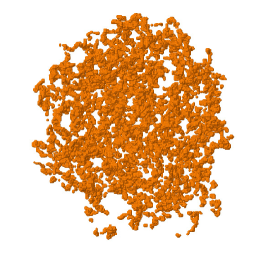
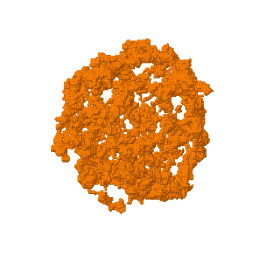
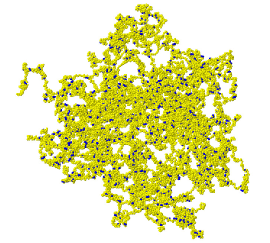
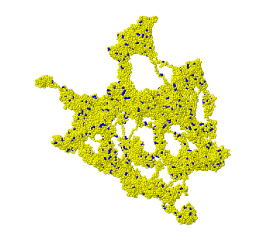
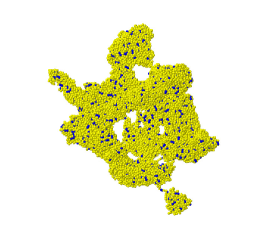
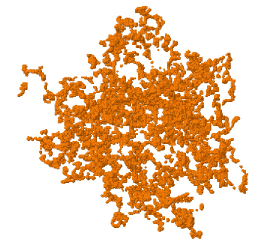
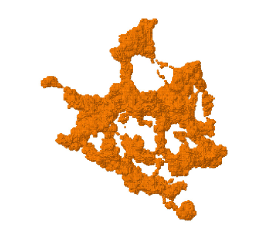
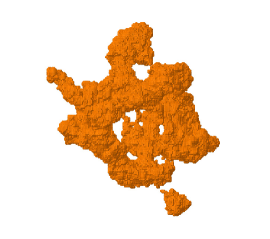
In 2 we show typical snapshots (yellow beads), corresponding to disordered microgels with radius of gyration at the center and the two tails of the distribution of 1. In what follows we will characterize observables for these three disordered microgels that, according to their size, we will refer to as small (), middle () and large () disordered microgels. The respective asphericities are , and . In 2 we include (orange beads) a typical snapshot of the diamond microgel. In all cases the cross-linked sites are depicted as blue beads. Not surprisingly, the regular diamond microgels show the most uniform structures. Small- and medium-size disordered microgels present more uniform and compact structures than the biggest ones, which are less spherical and characterized by more abundant and longer protrusions. 3a shows the distribution of the percent of intermolecular cross-links in the disordered microgels. These are defined as bonds between pairs of reactive groups belonging to different polymer chains. The obtained distribution reveals that only a small fraction of the whole set of cross-links () has an intermolecular origin. These cross-links are responsible for the connection of the whole microgel network into a single cluster and therefore, are elastically active. The fraction of intermolecular cross-links in the disordered microgels is very similar to the fraccion of cross-linked sites (all them being elastically active) in the diamond microgel (). Panels (b) and (c) of 3 show the influence of in the size and shape of the disordered microgels. Through the correlation is relatively weak, increasing the number of intermolecular cross-links leads to smaller microgels. This is presumably related to a lower presence of long protrusions in the outer shell, which are expected to originate from highly intramolecularly cross-linked chains connected to the global network just through a few intermolecular bonds. No significant correlation is found between asphericity and .
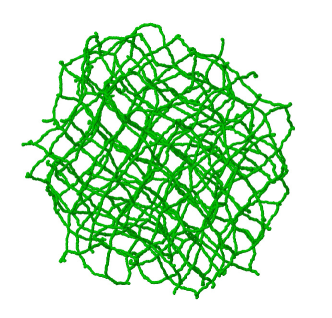
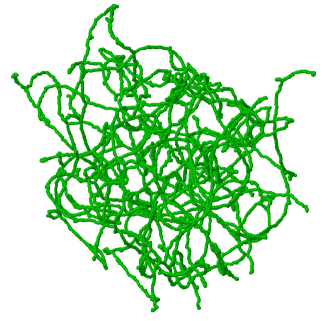
To enhance the microstructural differences that may originate from the underlying network architectures we have performed an analysis based on the isoconfigurational mean path (IMP) approach 42. The concept of IMP is based on the idea that the tube path associated to a given macromolecular configuration can be approximated by the coordinates of the monomers averaged over their isoconfigurational ensemble. In practice, for the same initial configuration () of the microgel, we generated 50 trajectories by starting with different Maxwell-Boltzmann realizations of the velocities, and the 50 configurations obtained at were used to get the averaged coordinates of the monomers in the IMP. The time scale is of the order of the entanglement time 43, so that fast fluctuations within the tube are averaged out, and a smooth path is generated that preserves the topological constraints. Typical IMP configurations of the disordered and diamond microgels are shown in 4. As expected, the IMPs are smoother than the real-coordinate configurations presented in 2, and fast fluctuations and small-scale wiggles are averaged out.
3.2 Static pair correlations
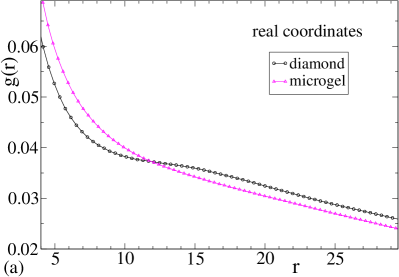
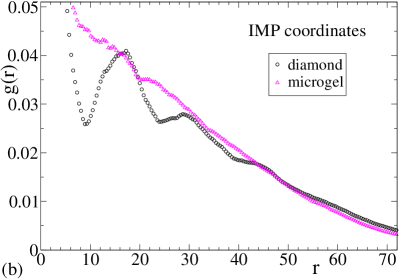
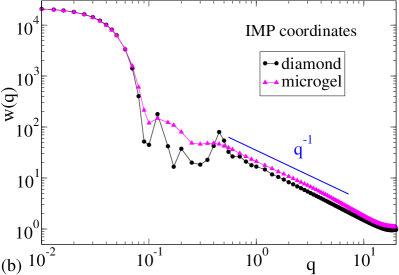
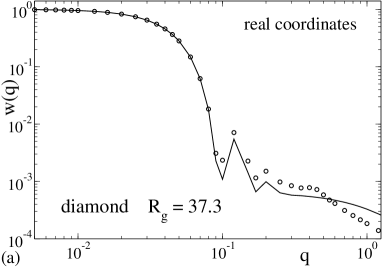
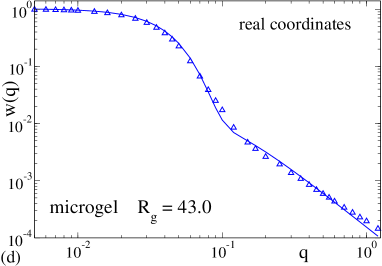
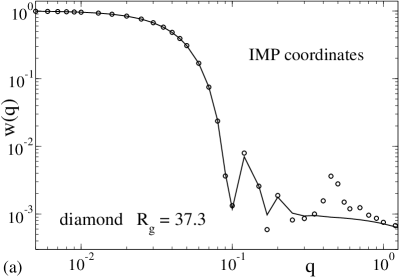
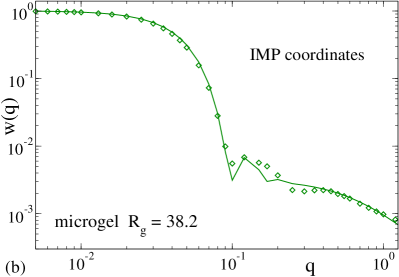
5a shows the radial distribution functions, for the real monomer coordinates, of a middle-size disordered () and the diamond microgel. This comparison does not reveal significant differences between both network topologies, except for a small bump at in the diamond microgel. The evident strong differences between such topologies are instead highlighted in the IMP representation, as shown in 5b. In this case the black curve displays well-defined peaks as a signature of the regular network structure in the diamond microgel. Similar features are found in the scattering form factor, , with the wave vector and the monomer positions. The corresponding data are represented in 6 for the same middle-size disordered and diamond microgels as in 5. After the low- Guinier regime corresponding to (), the form factor of the disordered microgel shows a sharp drop, typical of dense soft colloids with a global spherical structure (e.g., spherical brushes and high functionality stars 44, 45, 46). Power-law behavior is found at intermediate -values, (distances ). The observed scaling exponent in such a range of distances, (see panel (a)), reveals that the strands connecting the network nodes are essentially self-avoiding random walks (SARW) 47, as expected for a swollen microgel. The counterpart of this behavior in the IMP representation (panel (b)) is rod-like scaling (). This is a direct result of the averaging of the fast fluctuations in the IMP, which smooths the strands to quasi-linear segments (4). Finally, the peak at (and the subsequent higher harmonics) in the real-coordinate corresponds to the nearest-neighbor distance. This excluded-volume feature is absent in the IMP representation, where the averaging procedure leads to a strong overlap of nearest-neighbor positions. The real coordinate and IMP form factors of the diamond microgel exhibit the same former trends, though unlike in the disordered microgel, the underlying diamond structure is reflected by the presence of several peaks which are clearly highlighted in the IMP representation (black curves in 6).
We have fitted the form factors, both for the real and IMP coordinates, to the fuzzy sphere model 28, 29:
| (5) |
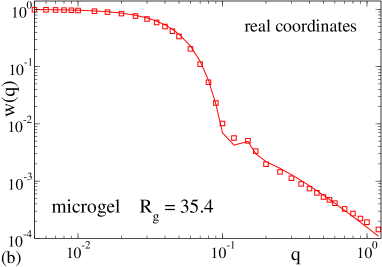
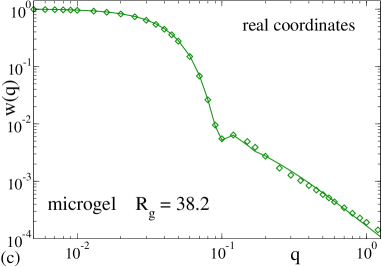
The fuzzy sphere model is generally invoked to describe the scattering form factors of microgels and to obtain information about their internal structure. The model assumes a constant-density core of radius with a shell of thickness . The Lorentzian term in 5 represents the scattering (with intensity ) from the network fluctuations, of correlation length . The fuzzy-sphere model was tested in the in silico microgels generated by polymerization routes in Refs. 26, 27. The form factors were consistent with the model, supporting the realistic character of the simulated microgels. This is also the case for the synthesis route used in our simulations. As can be seen in 7, the fuzzy-sphere model provides a very good description of the real-coordinate form factors of the disordered microgels. Not surprisingly, the constant-density assumption for the core is an oversimplification for the regular diamond network, and the fuzzy sphere model works poorly at intermediate distances (, see 7a). This effect is even more visible in the form factor of the IMP coordinates (8a). Nevertheless, the fuzzy sphere model reasonably describes the IMP structure of the disordered microgels (8b), since this structure does not present regularities and the inhomogeneities in the different directions are strongly smoothed by the spherical average in the form factor.
The parameters of the fuzzy-sphere model obtained for the diamond and the small (I), middle (II) and large (III) microgels are given in 1. The smearing parameter, correlation length and intensity of the fluctuations’ contribution increase with increasing asphericity (sequence diamond-I-II-III). For the most aspherical case (III) the inner core is not well-defined and the form factor is largely dominated by a corona-like contribution. The IMP construction averages out fluctuations, which leads to smaller smearing parameters and, in particular, to much smaller correlation lengths than in the respective real-coordinate configurations. The latter is a direct consequence of the quasi rod-like character of the strands in the IMP structure.
| System | ||||||||||||
|---|---|---|---|---|---|---|---|---|---|---|---|---|
| Diamond | (real coord.) | 46.8 | 5.3 | 0.95 | 0.0006 | |||||||
| Disordered I | (real coord.) | 40.6 | 7.2 | 5.4 | 0.0046 | |||||||
| Disordered II | (real coord.) | 44.5 | 9.3 | 6.6 | 0.0075 | |||||||
| Disordered III | (real coord.) | 0.10 | 23.9 | 10.7 | 0.0177 | |||||||
| Diamond | (IMP) | 46.3 | 2.3 | 0.08 | 0.0008 | |||||||
| Disordered II | (IMP) | 44.7 | 6.0 | 1.5 | 0.0032 |
3.3 Euler characteristic
In order to further characterize the microgel structure and highlight the differences with pre-constructed ordered networks we utilize the Euler characteristic , namely one of the four scalar Minkowski functionals 48, 49 that characterize a given surface embedded in three dimensions. This morphometric approach is able to take into account multi-body correlations among the constituent monomers and give details on their spatial arrangement. The coefficient itself is proportional to the integral Gaussian curvature and its value is not subject to continuous, topology-preserving deformations of the surface. In three dimensions , where is the number of disconnected aggregates, the number of enclosed cavities and the number of perforations (tunnels) that percolate through the system. In order to compute we follow the procedure described in Ref. 50. The system box is discretized into a cubic lattice, of spacing . Each lattice site is surrounded by a Wigner-Seitz cell, in this case an elementary cube having the size of the lattice constant. We then consider the surfaces formed by spheres with a radius located at the centers of every monomer. We denote each lattice site inside as ‘filled’ and all others sites as ‘empty’. denotes the relevant length scale: for small values of we have a collection of disjoint spheres. While increasing , some of the spheres merge, and progressively form rings and cavities. For large enough the collection of spheres will fully occupy the space containing the molecule, and the ultimate value is reached. For every chosen family, the Euler characteristic is computed as explained in Ref. 48. Due to the discretized nature of the surface obtained with this procedure, we choose a lattice spacing sufficiently small to avoid artifacts arising from the discretization.
9a shows for the real coordinates of the diamond (averaged over several run steps) and the disordered microgel. In the case of the disordered microgel, statistics have been improved by averaging over 5 different configurations and several steps each. The data are normalized by the total number of monomers, , of the respective microgel. Therefore, since in the limit the surface is constituted by disconnected spheres, . By increasing the merging of the sphere surfaces leads to the formation of rings, which contribute negatively (as tunnels) to the Euler characteristic. This results in a minimum at a distance slightly above the monomer radius. As the sphere radius goes on growing up, the perforations progressively shrink and vanish, or become enclosed cavities isolated from the empty space. Thus, the positive contributions of the emerging cavities and the cancelation of the negative contributions of the tunnels lead to an increase of the Euler characteristic. For large the whole structure merges into a single solid sphere without tunnels or cavities, reaching the final value . A closer inspection at intermediate distances reveals different features in the of the diamond and the disordered microgel. Within statistics, a monotonous increase of is observed for the disordered microgel. However, the interplay of emerging cavities and vanishing perforations leads to a broad maximum at for the diamond microgel (see inset in 9a). In a network with well-defined length scales (between nearest nodes, next-to-nearest ones, etc), the vanishment of the negative contributions from the tunnels associated to a given length scale (and the emergence of cavities originating from the enclosed tunnels) will lead to a steep increase of when probes such a length scale, and eventually a maximum in . Due to the twist of the polymer chains the maximum is not pronounced, but still reflects the underlying regular diamond network. Due to the absence of such a regular structure for the disordered microgel, no characteristic length scale can be solved by in its real-coordinate configurations.
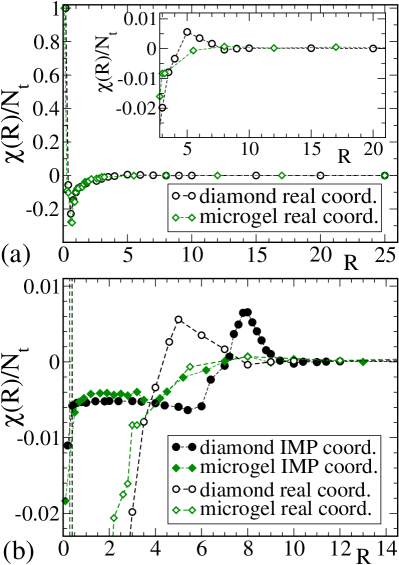
9b displays the Euler characteristics of the corresponding IMP coordinates of the diamond and disordered microgel. Data correspond to the average over 5 different IMP configurations. Due to the strong overlap of bonded monomers in the IMP coordinates, the merging of the fully disconnected spheres into rings (and the associated minimum in ) occurs at . The perforations associated to the small rings quickly vanish with growing , resulting in a steep increase from the minimum. This is followed by a well-defined plateau. Because of the rod-like character of the strands in the IMP configurations, the growth of the spheres in this regime is much less sensitive to fluctuations and wiggles than in the real-coordinate configurations. Thus, no significant vanishment of perforations or emergence of cavities occurs by increasing over a significant range, and the Euler characteristic is almost unaffected up to and for the diamond and microgel network, respectively. This feature is fully expected for a regular network, but is a remarkable one for the disordered one. 9b demonstrates that the IMP construction in combination with the Euler characteristic is able to detect a certain underlying mesh size in the disordered microgel network.
As expected, vanishment of perforations and emergence of cavities start to arise at longer and, as observed before for the real coordinates, the of the IMP configurations increases. In the diamond network the peak for the IMP coordinates is narrower than its counterpart for the real ones and is located at larger distances. This feature originates from the averaging out of the fluctuations and wiggles in the IMP, which shifts the closure and vanishment of perforations to larger values of . In the disordered microgel the Euler characteristics for the real and IMP coordinates show negligible differences for . No further characteristic length scales of the disordered network are probed by increasing the sphere radius , and grows smoothly until its final value .
4 Deswelling behavior
4.1 Volume phase transition
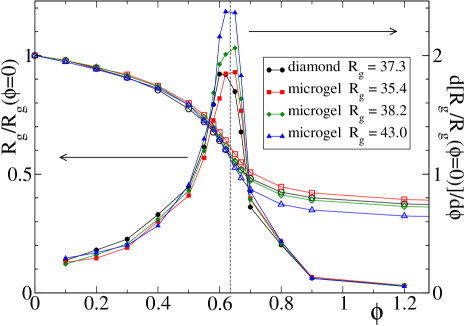
10 shows the radius of gyration vs. the solvent quality parameter for the diamond microgel and for the three representative (small, middle and large) disordered microgels. All data are normalized by the radius of gyration at ideal good solvent (). As expected, the microgel shrinks by worsening the solvent quality (increasing ). A steep decrease of the microgel size is observed in the range , followed by an ultimate plateau that corresponds to the dense collapsed state in bad solvent (large . An accurate determination of the volume phase transition (VPT) point would require to compute effective pair interactions (see e.g. Ref. 51). Still, a reliable estimation can be obtained by analyzing the derivatives of the normalized radii of gyration. As can be seen in 10 the derivatives have a sharp peak (maximum slope in ) at , which can be identified as the VPT point of the microgel. No significant differences in the peak positions are found within statistics, indicating that the VPT point is at most very weakly dependent on the specific microstructure of the microgel, even if our results include the limits of a regular and a highly disordered network. Our results are in agreement with experiments in microgels with different degree of internal inhomogeneity 52, and extend them to include the limit of regular networks.
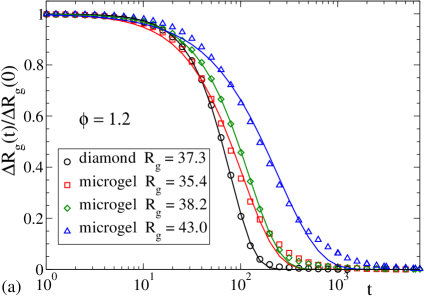
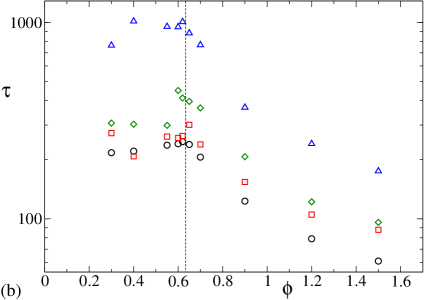
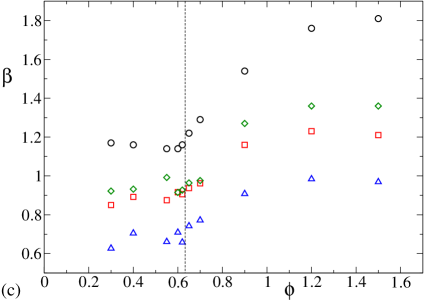
Whereas no significant differences are found in the deswelling thermodynamics, the kinetics are strongly dependent on the microgel microstructure. 11a shows the evolution of the ratio during the collapse of the microgel at (well beyond the VPT point). The quantity is defined as , with the final radius of the collapsed globule. By construction decays from 1 to 0. As can be seen in 11a, the time scale as well as the shape of the decay depends on the specific microgel topology. We have fitted the simulation results to a generalized exponential (solid curves in 11a). The relaxation times and exponents obtained at the investigated values of are displayed in 11b and 11c, respectively. Both and are approximately -independent in the swollen state (). A rather different behavior is found when the microgels are driven to the collapsed state (). Deeper quenches (higher ) lead to faster (lower ) and less stretched (higher ) kinetics of deswelling. The -exponents seem to reach an asymptotic regime for deep quenches. The most spherical microgel — the diamond-like one — shows the fastest and least stretched decay. The time scale and the stretching increase with the asphericity, as can be observed in the data sets of 11 for the disordered microgels (note again that increases with in these selected systems). It is worth stressing that it is and not the key factor for the former observation. Indeed, the diamond microgel () is bigger, but more spherical, than the small disordered one (), and shows a faster and less stretched decay (11a). As can be seen in 11c, the relaxation to the collapsed state is super-exponential (), except for the most aspherical disordered microgels (still, for deep quenches). Super-exponential behavior is also found in the coil-to-globule transition of a linear polymer chain 53, 54, with an exponent for deep quenches. This is similar to those of the disordered microgels () and still far from that found for the diamond microgel .
A broader decay in 11a (lower ) suggests a more heterogeneous collapse of the different regions of the microgel. This effect can be quantified by analyzing the evolution of the macromolecular shape at different stages of the collapse. 12 shows the time evolution of the asphericities after the quench at different values of . The obtained results are consistent with those of Ref. 25 and extend them by investigating the effect of the specific network microstructure. In the swollen state () the initial asphericity () is essentially unaffected, indicating that the soft quench just results in a weak distorsion of the conformations. For the asphericity shows a peak at intermediate times followed by the expected decay to corresponding to the final (spherical) collapsed state. The distortion with respect to the spherical shape at intermediate times is stronger as the intrinsic asphericity of the microgel ( at ) increases, indicating a more heterogeneous collapse. Still, this distorsion is relevant only for the microgels that are already significantly aspherical in the swollen state (see the peak in 12c at , starting from ). 12 also shows that the deeper the quench, the more heterogenous (stronger deviation from sphericity) the collapse is.
4.2 Coarsening kinetics
As the global conformation of the microgel collapses in bad solvent, the monomers form local globules that progressively merge into interconnected larger globules, and the internal holes shrink (see top panels in LABEL:fig:snaps-field-diamond,fig:snaps-field-mic). This coarsening process finishes in a dense fully collapsed spherical globule (not shown in LABEL:fig:snaps-field-diamond,fig:snaps-field-mic). We characterize the coarsening kinetics of the microgel structure during the collapse by following a procedure similar to that proposed by Testard et al. in the context of liquid-gas phase separation 55, 56. Thus, the collapsing microgel can be seen as a coarsening ‘bicontinuous’ structure of connected ‘empty’ and ‘filled’ domains, which are identified according to their ‘low’ or ‘high’ local density, respectively. To facilitate the classification of the domains, the real-coordinate configuration of the microgel is substituted by a smoothed coarse-grained density field that is constructed as follows. First we divide the space into cubic cells of side . We define the local density at each cell as , with the number of monomers at a distance from the position of the cell center. The coarse-grained density at is defined as a weighted average of the local density over the surrounding cells,
| (6) |
where the sum is performed over the six vectors . The values of the coarse-graining length scales, i.e., the grid size and the distance , are chosen in order to get a smooth density field while keeping sufficient spatial resolution in the representation of the microgel. A good compromise can be found by using and . In what follows we will present results for and for two values and . The density field can be used as a smoothed proxy of the real microgel by defining ‘filled’ and ‘empty’ cells as those with and , respectively, with a threshold density.
The averaging of the local density over the surrounding cells can be seen as a generalization of the averaging procedure in a phase-separating Ising system 57, 58, where ‘thermal noise’ is removed by replacing the spin at each lattice site by the majority spin of the surrounding sites. In continuous systems as our microgels or those of Refs. 55, 56 the use of the density field representation smooths the interface corrugations, and fills the smallest holes in the domains of the real-coordinate structure. This removes the shortest and narrowest protrusions that cannot be considered as real domains, and prevents that the presence of very small holes artificially interrupts paths in real dense domains.
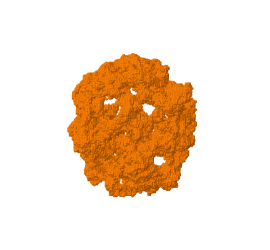
13 shows snapshots of the real diamond microgel at different times during the collapse (top panels), and its respective density field representations (bottom panels) for the parameters and . The beads in top and bottom panels represent the positions of the real monomers and the centers of the filled cells, respectively. 14 shows the corresponding real coordinate and density field representations for the collapse of a middle-size disordered microgel. The snapshots of both LABEL:fig:snaps-field-diamond,fig:snaps-field-mic correspond to , i.e., a bad-solvent state well beyond the VPT-point. The final state reached at late times is, in both the real-coordinate and density field representations, a fully collapsed dense spherical object (not shown).
Once we have constructed the density fields we can characterize the size of the domains emerging during the coarsening process. First, we define an ‘interface cell’ as a filled cell at with at least one adjacent empty cell (of coordinates , so that ). A ‘chord’ 55, 56 is defined as a straight path, parallel to one of three axes , formed just by filled cells and with two interface cells at its ends (so that an empty cell is found if the straight path is continued by moving to the adjacent cell of any of the two ends). The chord length is given by , with the centers of the two interface cells at the path ends. To compute the distribution of chord lengths of a given configuration of a microgel at , we sampled all the existing chords as defined above. To improve statistics 5 random rotations of the former configuration were taken, and the whole procedure was repeated over the 5 independent collapse runs of the same microgel at the same .
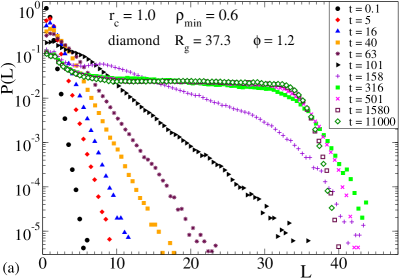
15 shows the normalized distributions of chord lengths, , at and different times during the collapse of the diamond and the middle-size disordered microgel. The displayed results correspond to the values and used for constructing the coarse-grained density field. In agreement with observations in other coarsening systems 59, 60, 58, 61, 56, 53, shows an exponential decay and extends over longer distances as time increases, as a direct consequence of the growth of the filled domains during coarsening. As expected, this behavior saturates at long times when the microgel reaches the fully collapsed state, and a sharp drop is found when approaches the maximum path lenght (i.e., the sphere diameter). The observed plateau originates from the equiprobable different straight paths that connect two points of the spherical surface, which in the fully collapsed state do not find empty cells.
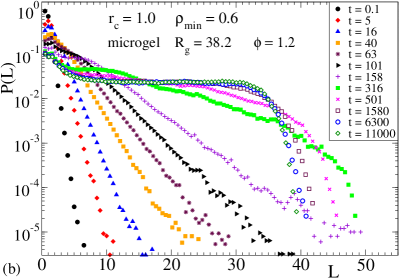
Though the same qualitative behavior of is found for other choices of and , large quantitative differences are found. Thus, at fixed and time, using lower values of to define the filled cells obviously produces less empty cells and longer chords in the coarse-grained structure. On the other hand, using larger values of at fixed time increases the local , producing more cells with coarse-grained density higher than the required , and therefore longer chords. For the same former reasons the mean chord length, obtained as , strongly depends on the specific values of the parameters used for constructing the density field. Thus, to quantify the domain growth during the coarsening process in a parameter-independent fashion we introduce the relative domain size, , which grows from 0 to 1 from the swollen () to the collapsed state (). 16 shows results of at computed for different choices of and , for the diamond microgel and for the three selected disordered microgels of small, middle and large size. The times have been normalized by the time at which . A very good overlap of the data is found even by varying by a factor 3.5, demonstrating the consistency of the coarse-graining procedure. The observed master curves are also found for the same microgel by varying the solvent quality parameter (see 17). Hence, in a good approximation, for each microgel there is a unique function describing the coarsening kinetics of the deswelling transition. Interestingly, this function is almost independent on the particular topology of the disordered microgel (see 16), and it can be described by a power-law , with .
The characteristic exponents for the domain growth are inherent to the underlying mechanism driving the coarsening, and hence they are system-dependent 62, 63, 64, 65, 66, 57, 56, 54, 67. Thus, for phase-separating solid mixtures the domains are expected to grow as , which is the result of diffusion driven by the chemical potential gradient 68, 69. For systems where hydrodynamics is relevant (as fluids and polymers), linear growth () is predicted at long times in the viscous hydrodynamic regime 70. A clear emergence of both the early diffusive () and the late hydrodynamic () regime 62 is often absent. Thus, an apparent sublinear regime with exponent has been observed, e.g., in simulations of gas-liquid separation 56, which has been proposed to be an effective interpolation between the diffusive and hydrodynamic regimes. On the other hand a clear linear growth, , has been found for the coil-to-globule transition in off-lattice linear polymer chains 71, 53. The exponent found in our disordered microgels, , can be tentatively seen as an intermediate result between the former cases, namely faster than the -growth for gas-liquid separation and slower than the linear growth for single polymer chain collapse. Thus, the presence of thin branches connecting the nucleating centers accelerates coarsening with respect to gas-liquid separation. However, the absence of a common backbone for ‘reptation’ of the nucleating centers prevents them to merge coherently, leading to slower coarsening than in the single chain case.
The coarsening kinetics of the diamond microgel is rather different from that of the disordered microgels. Instead of a power law, a stretched exponential with exponent provides a good description over the whole growth process (solid curve in 16a). The apparent stretched exponential growth of the domains in the diamond microgel can be tentatively seen as the result of two processes (dashed lines in 16a). Thus, a close inspection of the data shows that the initial growth is still roughly compatible with the power-law observed in the whole time window for the disordered microgels. At late times an acceleration of the deswelling kinetics is found (roughly scaling as ). This unusual feature can be understood as follows. At early times the domains are still small and do not feel the large-scale (regular or disordered) connectivity of the network. However, unlike in the disordered case, the diamond network facilitates the formation of an homogeneous spatial distribution of nucleation centers, which grow up in a similar fashion. As a consequence, all them merge together in a narrow time window, leading to the late acceleration of the collapse kinetics.
Worsening the solvent quality (increasing the strength of the attractive tail in 1) leads to slow monomer dynamics, and a glass transition is expected in the globular state for very large values of . Though the interplay of the glass transition and the domain growth is beyond the scope of this work, it is worth noting that some effects are visible for the deepest investigated quench, at . Indeed, a late slowing down of is observed for in 17. To highlight this feature, we show the function in log-lin scale for the diamond and the small, middle and large disordered microgels during their deswelling at (18, data for and ). The late stage of the microgel collapse is apparently consistent with logarithmic domain growth, as has been observed for the liquid-gas phase separation in the presence of a glass transition 55, 56.
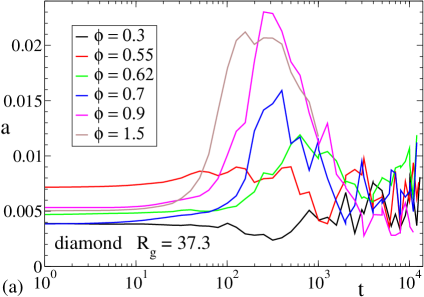
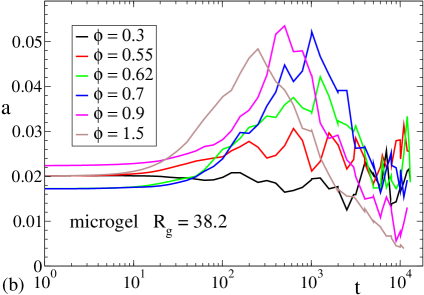
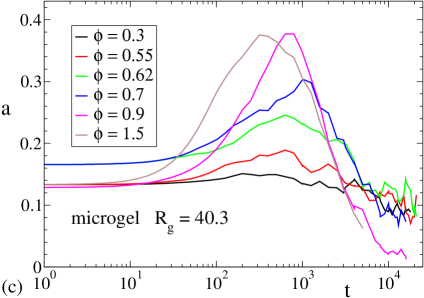
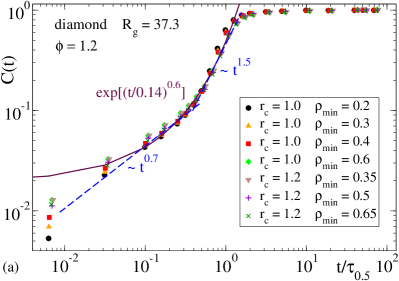
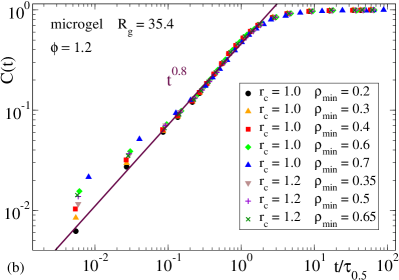
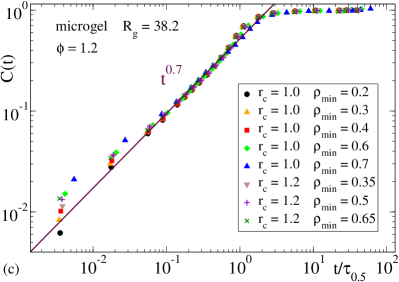
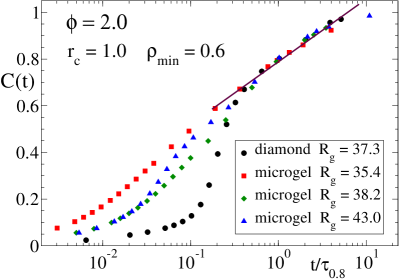
Inspired by the mapping to the Ising system usually performed in other systems, we test the possibility of scaling behavior of the dynamics with the growing length scale of the domains 72, 53. First, we measure the domain self-correlation function, , where the variable is computed for each monomer of the microgel. if the position of the monomer in the grid used for defining the density field corresponds to a filled cell. if it corresponds to an empty cell. 19 shows the relaxation of the domain self-correlator for the diamond and two disordered microgels during the collapse at (with parameters and for defining the density field). The time for each data set has been rescaled by , with defined as in 16. The correlator for the disordered microgels can be described by power-law behavior over its whole decay. The same power-law is found for the diamond microgel until . However, a faster relaxation, roughly described by , arises at late times. This crossover from slow to fast relaxation is concomitant with the crossover (also occurring at ) from slow to fast domain growth in the diamond microgels (16a). On the other hand, the single power-law regime observed for the domain growth of the disordered microgels has its counterpart in the single power-law decay observed in the self-correlator .
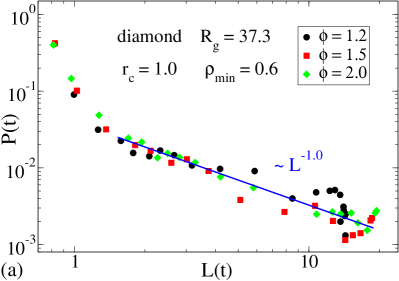
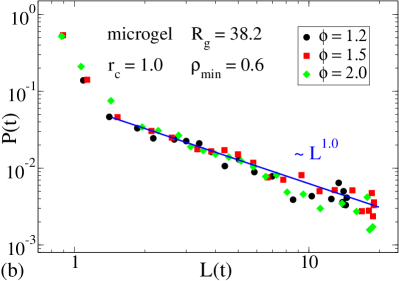
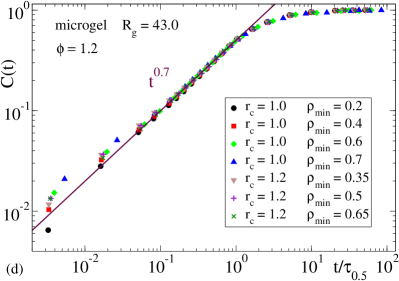
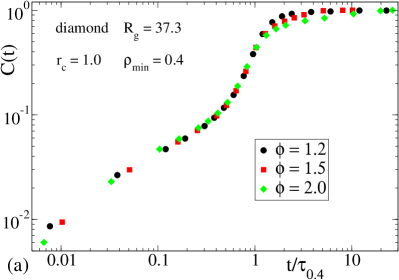
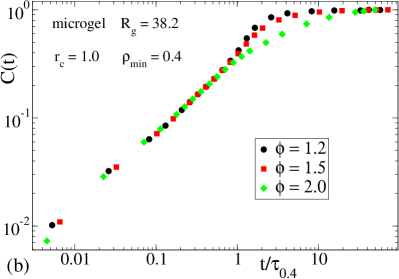
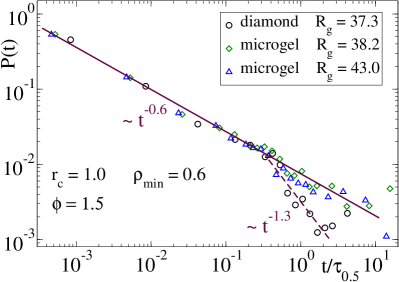
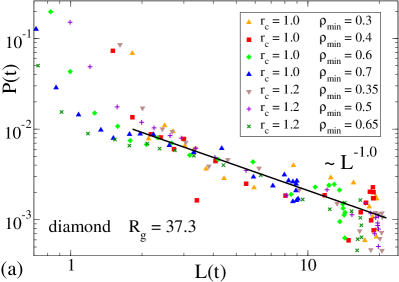
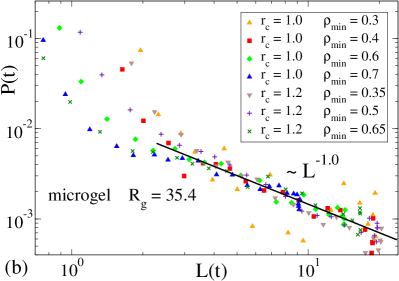
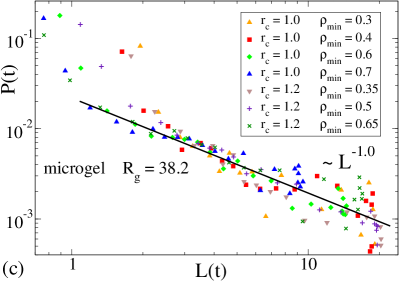
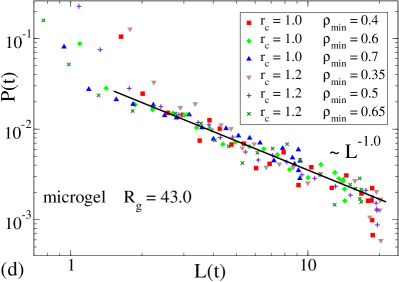
From the computation of and the domain size a direct relation can be obtained. 20 shows results for this relation in the diamond and in the small, middle and large disordered microgel. The data correspond to the collapse at and, as in 16, have been computed for a broad range of the parameters and used to define the density field. The different data sets have been shifted vertically to obtain master plots. Though the results are not fully conclusive because of the poor statistics, they are compatible (no systematic deviations) with a common power law in each system, irrespective of the specific values of and . Unlike for the case of the domain growth (), the specific microstructure does not seem to play a major role in , and both the diamond and disordered microgels exhibit scaling . The observed scaling behavior is again independent of the state point, as can be seen in 21 for different values of at fixed and . Thus, the presence of two regimes in the and of the diamond microgels (as opposite to the single regime in the disordered microgels) does not result in significantly different scaling of . Indeed, up to both and behave in a similar fashion to their counterparts in the disordered microgels, and the accelaration of the diamond domain growth at is compensated by a similar accelaration (with a very similar exponent, see 16a and 19) of the relaxation of . Interestingly, the recent analysis of the coil-to-globule transition of a linear polymer chain 53, 54, 73 has revealed a similar scaling () to that of the microgel deswelling, in spite of the clear differences between the respective kinetics.
5 Conclusions
We have presented realistic computer simulations of the synthesis of microgels through cross-linking of functionalized polymer chains confined in a cavity. This model is inspired by the microfluidic fabrication of microgels from polymeric precursors 30, 31, 32, 33, and is different from the usual polymerization routes that have inspired very recent simulation works 26, 27. Most of the cross-linking events are of intramolecular character, and the global connectivity of the microgel network is mediated by a small fraction of inter-chain cross-links. As expected, the microgels are quite spherical and topologically polydisperse. Their scattering form factors can be accounted by the standard fuzzy sphere model usually invoked in real microgels.
We have investigated the effect of the network microstructure on the thermodynamics and kinetics of the deswelling transition. For this purpose, we have compared results in three topologically disordered microgels and a regular diamond-like microgel network, all them with the same molecular weight and the same effective degree of cross-linking. Whereas the specific microstructure has no apparent effect on the locus of the volume phase transition, it strongly affects the kinetics of deswelling. Following the methodology proposed in a different context 56, we have characterized the coarsening kinetics through the analysis of the growing domains of a smooth density field representation of the microgel. This representation removes the fast interfacial fluctuations of the real-coordinate structure, and allows for a consistent characterization of the domain growth, with no significant dependence on the specific parameters used to define the density field. The internal structure of the microgel strongly affects the coarsening process during deswelling. Thus, the domain size grows in a stretched exponential fashion in the diamond network, whereas power-law behavior is found in the disordered microgels, in all cases showing very similar exponents . The apparent stretched exponential growth of the domains in the diamond microgel can be seen as the result of two processes: i) an early regime analogous to that of the disordered microgels (and therefore independent of the microstructure), and ii) a late regime where all domains fastly merge into the final collapsed globule. This specific behavior is unusual and is tentatively related to the regular structure of the diamond network, which leads to the formation of an homogeneous spatial distribution of nucleation centers that grow in a similar fashion. As a consequence, all them merge together in a narrow time window.
Following a similar procedure to studies of coarsening in other systems, as Ising systems, phase-separating mixtures or collapsing linear polymers 57, 72, 53, we have invoked the Ising model to establish a scaling relation of the domain dynamic correlations with the growing length scale . In this case the specific microstructure (regular or disordered) has no significant effect on the scaling behavior. The faster domain growth in the late stage of the coarsening of the diamond microgels is compensated by a similarly faster late relaxation of the dynamic self-correlations. A universal power-law is observed, with , irrespective of the microstructure. Though we do not expect qualitative differences in the observed coarsening scenario, quantitative differences in the scaling exponents might arise in the presence of hydrodynamic interactions, which have been neglected in this investigation. Work in this direction is in progress.
Finally, our results contribute to highlight the importance of developing realistic simulation models for microgels that incorporate the synthesis procedure, an aspect that is often skipped in the simulation literature by assuming regular networks. The analysis presented in our work reveals that regular networks can be inadequate for investigating some dynamic aspects of microgels as the deswelling kinetics. On the other hand, we believe that our characterization of the coarsening process during the microgel collapse will motivate future experimental works by super-resolution microscopies, which are currently experiencing noteworthy advances.
We acknowledge financial support from the projects MAT2015-63704-P (MINECO-Spain and FEDER-UE) and IT-654-13 (Basque Government, Spain). Computation/simulation for the work described in this paper was supported in part by the DeiC National HPC Centre, SDU (ABACUS 2.0). We thank L. Rovigatti, E. Zaccarelli, D. Truzzolillo, J.A. Pomposo, E. Minina, S. Kantorovich, R. Blaak and C.N. Likos for useful discussions.
References
- Fernandez-Nieves et al. 2011 Fernandez-Nieves, A., Wyss, H. M., Mattsson, J., Weitz, D. A., Eds. Microgel Suspensions: Fundamentals and Applications; John Wiley & Sons: Weinheim, Germany, 2011
- Das et al. 2006 Das, M.; Zhang, H.; Kumacheva, E. Microgels: Old Materials with New Applications. Annu. Rev. of Mater. Res. 2006, 36, 117–142
- Plamper and Richtering 2017 Plamper, F. A.; Richtering, W. Functional Microgels and Microgel Systems. Acc. Chem. Res. 2017, 50, 131–140
- Oh et al. 2008 Oh, J. K.; Drumright, R.; Siegwart, D. J.; Matyjaszewski, K. The development of microgels/nanogels for drug delivery applications. Prog. Polym. Sci. 2008, 33, 448 – 477
- Klinger and Landfester 2012 Klinger, D.; Landfester, K. Stimuli-responsive microgels for the loading and release of functional compounds: Fundamental concepts and applications. Polymer 2012, 53, 5209 – 5231
- Zhang et al. 2014 Zhang, Q. M.; Xu, W.; Serpe, M. J. Optical Devices Constructed from Multiresponsive Microgels. Angew. Chem. Int. Ed. 2014, 53, 4827–4831
- Islam et al. 2014 Islam, M. R.; Ahiabu, A.; Li, X.; Serpe, M. J. Poly (N-isopropylacrylamide) Microgel-Based Optical Devices for Sensing and Biosensing. Sensors 2014, 14, 8984–8995
- Ancla et al. 2011 Ancla, C.; Lapeyre, V.; Gosse, I.; Catargi, B.; Ravaine, V. Designed Glucose-Responsive Microgels with Selective Shrinking Behavior. Langmuir 2011, 27, 12693–12701
- Zhang et al. 2016 Zhang, Q. M.; Wang, W.; Su, Y.-Q.; Hensen, E. J. M.; Serpe, M. J. Biological Imaging and Sensing with Multiresponsive Microgels. Chem. Mater. 2016, 28, 259–265
- Parasuraman et al. 2012 Parasuraman, D.; Sarker, A. K.; Serpe, M. J. Poly(N-Isopropylacrylamide)-Based Microgels and Their Assemblies for Organic-Molecule Removal from Water. ChemPhysChem 2012, 13, 2507–2515
- Jin et al. 2015 Jin, L.; Sun, Q.; Xu, Q.; Xu, Y. Adsorptive removal of anionic dyes from aqueous solutions using microgel based on nanocellulose and polyvinylamine. Bioresour. Technol. 2015, 197, 348 – 355
- Lopez and Snowden 2003 Lopez, V. C.; Snowden, M. The role of colloidal microgels in drug delivery. Drug Deliv. Syst. Sci. 2003, 3, 19–23
- Murthy et al. 2003 Murthy, N.; Xu, M.; Schuck, S.; Kunisawa, J.; Shastri, N.; Fréchet, J. M. J. A macromolecular delivery vehicle for protein-based vaccines: Acid-degradable protein-loaded microgels. Proc. Natl. Acad. Sci. USA 2003, 100, 4995–5000
- Morris et al. 1997 Morris, G.; Vincent, B.; Snowden, M. Adsorption of lead ions onto N-isopropylacrylamide and acrylic copolymer microgels. Prog. Colloid Polym. Sci. 1997, 190, 198–205
- Xu et al. 2003 Xu, S.; Zhang, J.; Paquet, C.; Lin, Y.; Kumacheva, E. From Hybrid Microgels to Photonic Crystals. Adv. Funct. Mater. 2003, 13, 468–472
- Gelissen et al. 2016 Gelissen, A. P. H.; Oppermann, A.; Caumanns, T.; Hebbeker, P.; Turnhoff, S. K.; Tiwari, R.; Eisold, S.; Simon, U.; Lu, Y.; Mayer, J.; Richtering, W.; Walther, A.; W ll, D. 3D Structures of Responsive Nanocompartmentalized Microgels. Nano Lett. 2016, 16, 7295–7301
- Conley et al. 2016 Conley, G. M.; Nöjd, S.; Braibanti, M.; Schurtenberger, P.; Scheffold, F. Superresolution microscopy of the volume phase transition of pNIPAM microgels. Colloids Surf. A 2016, 499, 18 – 23
- Conley et al. 2017 Conley, G. M.; Aebischer, P.; Nöjd, S.; Schurtenberger, P.; Scheffold, F. Jamming and overpacking fuzzy microgels: Deformation, interpenetration, and compression. Sci. Adv. 2017, 3, e170096
- Bergmann et al. 2018 Bergmann, S.; Wrede, O.; Huser, T.; Hellweg, T. Super-resolution optical microscopy resolves network morphology of smart colloidal microgels. Phys. Chem. Chem. Phys. 2018, 20, 5074–5083
- Jha et al. 2011 Jha, P. K.; Zwanikken, J. W.; Detcheverry, F. A.; de Pablo, J. J.; Olvera de la Cruz, M. Study of volume phase transitions in polymeric nanogels by theoretically informed coarse-grained simulations. Soft Matter 2011, 7, 5965–5975
- Kobayashi and Winkler 2014 Kobayashi, H.; Winkler, R. G. Structure of Microgels with Debye–Hückel Interactions. Polymers 2014, 6, 1602–1617
- Ghavami et al. 2016 Ghavami, A.; Kobayashi, H.; Winkler, R. G. Internal dynamics of microgels: A mesoscale hydrodynamic simulation study. J. Chem. Phys. 2016, 145, 244902
- Ahualli et al. 2017 Ahualli, S.; Mart n-Molina, A.; Maroto-Centeno, J. A.; Quesada-P rez, M. Interaction between Ideal Neutral Nanogels: A Monte Carlo Simulation Study. Macromolecules 2017, 50, 2229–2238
- Sean et al. 2018 Sean, D.; Landsgesell, J.; Holm, C. Computer Simulations of Static and Dynamical Properties of Weak Polyelectrolyte Nanogels in Salty Solutions. Gels 2018, 4, 2
- Kamerlin and Elvingson 2016 Kamerlin, N.; Elvingson, C. Collapse Dynamics of Core-Shell Nanogels. Macromolecules 2016, 49, 5740–5749
- Gnan et al. 2017 Gnan, N.; Rovigatti, L.; Bergman, M.; Zaccarelli, E. In Silico Synthesis of Microgel Particles. Macromolecules 2017, 50, 8777–8786
- Rovigatti et al. 2018 Rovigatti, L.; Gnan, N.; Zaccarelli, E. Internal structure and swelling behaviour of in silico microgel particles. J. Phys.: Condens. Matter 2018, 30, 044001
- Stieger et al. 2004 Stieger, M.; Richtering, W.; Pedersen, J. S.; Lindner, P. Small-angle neutron scattering study of structural changes in temperature sensitive microgel colloids. J. Chem. Phys. 2004, 120, 6197–6206
- Eckert and Richtering 2008 Eckert, T.; Richtering, W. Thermodynamic and hydrodynamic interaction in concentrated microgel suspensions: Hard or soft sphere behavior? J. Chem. Phys. 2008, 129, 124902
- Tumarkin and Kumacheva 2009 Tumarkin, E.; Kumacheva, E. Microfluidic generation of microgels from synthetic and natural polymers. Chem. Soc. Rev. 2009, 38, 2161–2168
- Seiffert and Weitz 2010 Seiffert, S.; Weitz, D. A. Controlled fabrication of polymer microgels by polymer-analogous gelation in droplet microfluidics. Soft Matter 2010, 6, 3184–3190
- Seiffert et al. 2010 Seiffert, S.; Romanowsky, M. B.; Weitz, D. A. Janus Microgels Produced from Functional Precursor Polymers. Langmuir 2010, 26, 14842–14847
- Sebastian 2011 Sebastian, S. Functional Microgels Tailored by Droplet-Based Microfluidics. Macromol. Rapid Commun. 2011, 32, 1600–1609
- Soddemann et al. 2001 Soddemann, T.; Dünweg, B.; Kremer, K. A generic computer model for amphiphilic systems. Eur. Phys. J. E 2001, 6, 409–419
- Lo Verso et al. 2015 Lo Verso, F.; Pomposo, J. A.; Colmenero, J.; Moreno, A. J. Simulation guided design of globular single-chain nanoparticles by tuning the solvent quality. Soft Matter 2015, 11, 1369–1375
- Kremer and Grest 1990 Kremer, K.; Grest, G. S. Dynamics of entangled linear polymer melts: A molecular dynamics simulation. J. Chem. Phys. 1990, 92, 5057–5086
- Moreno et al. 2016 Moreno, A. J.; Lo Verso, F.; Arbe, A.; Pomposo, J. A.; Colmenero, J. Concentrated Solutions of Single-Chain Nanoparticles: A Simple Model for Intrinsically Disordered Proteins under Crowding Conditions. J. Phys. Chem. Lett. 2016, 7, 838–844
- Gonzalez-Burgos et al. 2018 Gonzalez-Burgos, M.; Arbe, A.; Moreno, A. J.; Pomposo, J. A.; Radulescu, A.; Colmenero, J. Crowding the Environment of Single-Chain Nanoparticles: A Combined Study by SANS and Simulations. Macromolecules 2018, 51, 1573–1585
- Izaguirre et al. 2001 Izaguirre, J. A.; Catarello, D. P.; Wozniak, J. M.; Skeel, R. D. Langevin stabilization of molecular dynamics. J. Chem. Phys. 2001, 114, 2090–2098
- Smith et al. 2009 Smith, W.; Forester, T. R.; Todorov, I. T. The DL_POLY_2 User Manual, Version 2.19; STFC Daresbury Laboratory, Daresbury, UK, 2009
- Rawdon et al. 2008 Rawdon, E. J.; Kern, J. C.; Piatek, M.; Plunkett, P.; Stasiak, A.; Millett, K. C. Effect of knotting on the shape of polymers. Macromolecules 2008, 41, 8281–8287
- Bisbee et al. 2011 Bisbee, W.; Qin, J.; Milner, S. T. Finding the Tube with Isoconfigurational Averaging. Macromolecules 2011, 44, 8972–8980
- Bačová et al. 2017 Bačová, P.; Lo Verso, F.; Arbe, A.; Colmenero, J.; Pomposo, J. A.; Moreno, A. J. The Role of the Topological Constraints in the Chain Dynamics in All-Polymer Nanocomposites. Macromolecules 2017, 50, 1719–1731
- Willner et al. 1994 Willner, L.; Jucknischke, O.; Richter, D.; Roovers, J.; Zhou, L.-L.; Toporowski, P. M.; Fetters, L. J.; Huang, J. S.; Lin, M. Y.; Hadjichristidis, N. Structural Investigation of Star Polymers in Solution by Small-Angle Neutron Scattering. Macromolecules 1994, 27, 3821–3829
- Lo Verso et al. 2010 Lo Verso, F.; Egorov, S. A.; Milchev, A.; Binder, K. Spherical polymer brushes under good solvent conditions: Molecular dynamics results compared to density functional theory. J. Chem. Phys. 2010, 133, 184901
- Förster et al. 1996 Förster, S.; Wenz, E.; Lindner, P. Density Profile of Spherical Polymer Brushes. Phys. Rev. Lett. 1996, 77, 95–98
- Rubinstein and Colby 2003 Rubinstein, M.; Colby, R. H. Polymer Physics; Oxford University Press: Oxford, U.K., 2003; Vol. 23
- Likos et al. 1995 Likos, C. N.; Mecke, K. R.; Wagner, H. Statistical morphology of random interfaces in microemulsions. J. Chem. Phys. 1995, 102, 9350–9361
- Hoffmann et al. 2006 Hoffmann, N.; Ebert, F.; Likos, C. N.; Löwen, H.; Maret, G. Partial Clustering in Binary Two-Dimensional Colloidal Suspensions. Phys. Rev. Lett. 2006, 97, 078301
- Sanchez-Sanchez et al. 2013 Sanchez-Sanchez, A.; Akbari, S.; Moreno, A. J.; Lo Verso, F.; Arbe, A.; Colmenero, J.; Pomposo, J. A. Design and Preparation of Single-Chain Nanocarriers Mimicking Disordered Proteins for Combined Delivery of Dermal Bioactive Cargos. Macromol. Rapid Commun. 2013, 34, 1681–1686
- Narros et al. 2013 Narros, A.; Moreno, A. J.; Likos, C. N. Effects of Knots on Ring Polymers in Solvents of Varying Quality. Macromolecules 2013, 46, 3654–3668
- Habicht et al. 2014 Habicht, A.; Schmolke, W.; Lange, F.; Saalwächter, K.; Seiffert, S. The Non-effect of Polymer-Network Inhomogeneities in Microgel Volume Phase Transitions: Support for the Mean-Field Perspective. Macromol. Chem. Phys. 2014, 215, 1116–1133
- Majumder et al. 2017 Majumder, S.; Zierenberg, J.; Janke, W. Kinetics of polymer collapse: effect of temperature on cluster growth and aging. Soft Matter 2017, 13, 1276–1290
- Christiansen et al. 2017 Christiansen, H.; Majumder, S.; Janke, W. Coarsening and aging of lattice polymers: Influence of bond fluctuations. J. Chem. Phys. 2017, 147, 094902
- Testard et al. 2011 Testard, V.; Berthier, L.; Kob, W. Influence of the Glass Transition on the Liquid-Gas Spinodal Decomposition. Phys. Rev. Lett. 2011, 106, 125702
- Testard et al. 2014 Testard, V.; Berthier, L.; Kob, W. Intermittent dynamics and logarithmic domain growth during the spinodal decomposition of a glass-forming liquid. J. Chem. Phys. 2014, 140, 164502
- Majumder and Das 2010 Majumder, S.; Das, S. K. Domain coarsening in two dimensions: Conserved dynamics and finite-size scaling. Phys. Rev. E 2010, 81, 050102
- Majumder and Das 2011 Majumder, S.; Das, S. K. Diffusive domain coarsening: Early time dynamics and finite-size effects. Phys. Rev. E 2011, 84, 021110
- Levitz 1998 Levitz, P. Off-lattice reconstruction of porous media: critical evaluation, geometrical confinement and molecular transport. Adv. Colloid Interface Sci. 1998, 76-77, 71 – 106
- Atsuko et al. 2003 Atsuko, N.; Tadahiro, H.; Atsushi, T.; Kei, K.; Ikuro, S. Bubble size distributions in a convecting layer. Geophys. Res. Lett. 2003, 30, 1784
- Majumder and Das 2011 Majumder, S.; Das, S. K. Universality in fluid domain coarsening: The case of vapor-liquid transition. EPL 2011, 95, 46002
- Wong and Knobler 1981 Wong, N.-C.; Knobler, C. M. Light-scattering studies of phase separation in isobutyric acid + water mixtures: Hydrodynamic effects. Phys. Rev. A 1981, 24, 3205–3211
- Durian et al. 1991 Durian, D. J.; Weitz, D. A.; Pine, D. J. Scaling behavior in shaving cream. Phys. Rev. A 1991, 44, R7902–R7905
- Saint-Jalmes 2006 Saint-Jalmes, A. Physical chemistry in foam drainage and coarsening. Soft Matter 2006, 2, 836–849
- Barik and Roy 2009 Barik, T.; Roy, A. Statistical distribution of bubble size in wet foam. Chem. Eng. Sci. 2009, 64, 2039 – 2043
- Lambert et al. 2010 Lambert, J.; Mokso, R.; Cantat, I.; Cloetens, P.; Glazier, J. A.; Graner, F.; Delannay, R. Coarsening Foams Robustly Reach a Self-Similar Growth Regime. Phys. Rev. Lett. 2010, 104, 248304
- Gong et al. 2017 Gong, T.; Bao, R.-Y.; Liu, Z.-Y.; Xie, B.-H.; Yang, M.-B.; Yang, W. The effect of chain mobility on the coarsening process of co-continuous, immiscible polymer blends under quiescent melt annealing. Phys. Chem. Chem. Phys. 2017, 19, 12712–12719
- Lifshitz and Slyozov 1961 Lifshitz, I.; Slyozov, V. The kinetics of precipitation from supersaturated solid solutions. J. Phys. Chem. Solids 1961, 19, 35 – 50
- Bray 2002 Bray, A. J. Theory of phase-ordering kinetics. Adv. Phys. 2002, 51, 481–587
- Siggia 1979 Siggia, E. D. Late stages of spinodal decomposition in binary mixtures. Phys. Rev. A 1979, 20, 595–605
- Majumder and Janke 2015 Majumder, S.; Janke, W. Cluster coarsening during polymer collapse: Finite-size scaling analysis. EPL 2015, 110, 58001
- Midya et al. 2015 Midya, J.; Majumder, S.; Das, S. K. Dimensionality dependence of aging in kinetics of diffusive phase separation: Behavior of order-parameter autocorrelation. Phys. Rev. E 2015, 92, 022124
- Majumder et al. 2018 Majumder, S.; Christiansen, H.; Janke, W. Scaling laws during collapse of a homopolymer: Lattice versus off-lattice. J. Phys.: Conf. Series 2018, 955, 012008