EREL Selection using Morphological Relation
Abstract
This work concentrates on Extremal Regions of Extremum Level (EREL) selection. EREL is a recently proposed feature detector aiming at detecting regions from a set of extremal regions. This is a branching problem derived from segmentation of arterial wall boundaries from Intravascular Ultrasound (IVUS) images. For each IVUS frame, a set of EREL regions is generated to describe the luminal area of human coronary. Each EREL is then fitted by an ellipse to represent the luminal border. The goal is to assign the most appropriate EREL as the lumen. In this work, EREL selection carries out in two rounds. In the first round, the pattern in a set of EREL regions is analyzed and used to generate an approximate luminal region. Then, the two-dimensional (2D) correlation coefficients are computed between this approximate region and each EREL to keep the ones with tightest relevance. In the second round, a compactness measure is calculated for each EREL and its fitted ellipse to guarantee that the resulting EREL has not affected by the common artifacts such as bifurcations, shadows, and side branches. We evaluated the selected ERELs in terms of Hausdorff Distance (HD) and Jaccard Measure (JM) on the train and test set of a publicly available dataset. The results show that our selection strategy outperforms the current state-of-the-art.
Keywords
Extremal regions, Extremum level, EREL, Morphological relation, Correlation coefficient, Compactness measure
1 Introduction
This work focuses on segmentation of arterial wall boundaries from Intravascular Ultrasound (IVUS) images. Our goal is to develop an automatic way to extract the luminal border of an IVUS image. Various approaches have studied this topic such as artificial neural network [9], computational methods that tried to minimize probabilistic cost functions [8], and fast-marching and region growing methods [3][7][2]. Another state-of-the-art method is known as Extremal Regions of Extremum Level (EREL) [6, 5], a region detector that is capable of extracting repeatable regions from an image. This work is a derivation of [4] in the context of Intravascular Ultrasound (IVUS) image segmentation in which the EREL detector is applied to each IVUS frame and extracts several regions. Each EREL is fitted by a closest ellipsoid since the intrinsic shape of coronary artery is similar to a conic section [4]. Among these fitted ellipsoids, we expect one of them to have the smallest Hausdorff Distance (HD) [1] to the ground truth luminal border labeled by clinical experts and the goal is to find and represent this ellipse as a segmentation of the luminal region. In order to select the best EREL, every extracted regions in each IVUS sample is analyzed and the two-dimensional (2D) correlation coefficients between the current region and each of the other ERELs are computed. The morphological relationship between each EREL region and its fitted ellipse is studied and used as a compactness measure. These two metrics are combined as a selection strategy to find the EREL with the best performance.
| Training Set | Testing Set | Overall | |
| Number of IVUS Frames | 109 | 326 | 435 |
| Percentage in Total Dataset | 25.65% | 76.71% | 100% |
| Best Matching HD (lumen) | 0.19701 | 0.22872 | 0.2260 |
| Total Number of ERELS | 3207 | 2206 | 5413 |
| Average Number of ERELs | 29.61 | 6.77 | 12.7871 |
| Maximum Number of ERELs | 43 | 7 | 43 |
| Minimum Number of ERELs | 6 | 3 | 3 |
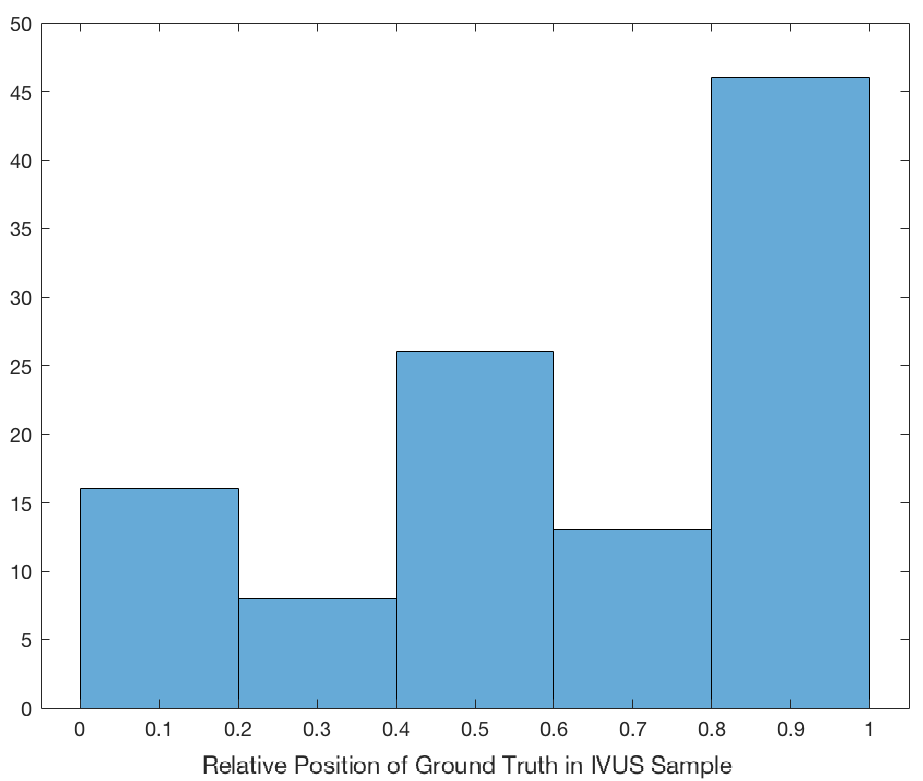
In comparison to other data analysis tasks; out of 435 20Mhz IVUS frames of this dataset, the training set takes only 25.65% of the total data. Also, the training and testing dataset have a large variation in terms of the number of ERELs and the distribution of ground truth in each sample. In training data, an IVUS frame has an average of 30 ERELs; whereas in testing set, an IVUS frame has an average of 7 ERELs. This shows that the test set contains a significantly higher number of artifacts. Table 1 reports a comparison between both datasets. Also, distributions of ground truth in both datasets are presented in Fig. 1. As a consequence, most feature learning methods such as convolutional neural networks that are highly dependent on the quantity and quality of datasets, may fail in extracting the relationship between ERELs and will eventually lead to overfit on the training data.
In order to deal with this issue, each EREL is treated as an independent entity in the proposed method. The key relationships between ERELs are extracted and the performance of each EREL is evaluated and compared to the others. Based on the variation of the number of ERELs in each sample, we assume that there is one and only one EREL that possesses the best matching qualifications regardless of the number of competitors. These qualifications are evaluated by computing two morphological metrics for each EREL: the correlation coefficient and the compactness measure. The details are given in the next section. Several advantages of the proposed method include:
-
•
This method operates immediately on ERELs by extracting them from the original IVUS frames as binary or grayscale regions such that the result is not influenced by other factors where the characteristics of these ERELs can be closely analyzed.
-
•
This method treats each EREL as an independent entity. Therefore, it works regardless of the number of ERELs in each sample.
-
•
This method uses two passes where the first pass takes the ERELs with high correlation coefficients and the second pass takes the ERELs with high compactness measures. As a result, accuracy is guaranteed in two folds.
 |
 |
The proposed method works based on the pattern observed from EREL regions in each IVUS sample. Some major patterns can be summarized as follows:
-
1.
EREL regions in each sample are ordered in an increasing fashion in terms of the size of detected features. Therefore, features in current EREL are also preserved in the following ones.
-
2.
An EREL feature detector may be influenced by noises such as shadow and bifurcation that lead to irregular shapes of the resulting EREL regions.
-
3.
The ground truth lumen region is relatively stable in terms of the growing trend and also tighter elliptical shapes compared to the others.
The procedure in selecting EREL includes several steps. First, EREL regions are preprocessed into binary and grayscale regions respectively (note that in this paper, we refer to that are filtered based on their distance to the center as EREL111The process of EREL filtering has been explained in [4]). Next, the relationships among ERELs are studied that we process on the last EREL of each sample to extract the possible lumen region. After that, a 2D correlation coefficient is computed between this extracted region and each EREL to only keep the ERELs with high correlations. Then, we further process on these EREL regions with their fitted ellipse to find the EREL with the highest compactness measure to the selected EREL. The details about each step are given as follows.
2 Method
2.1 Preprocessing
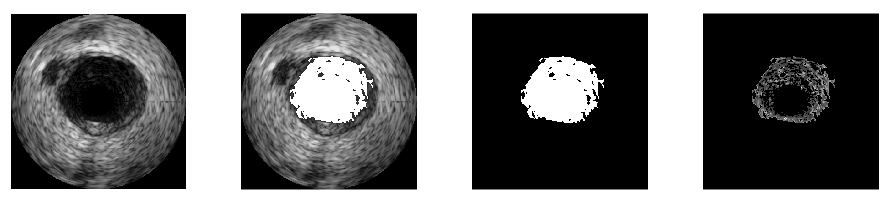
In the dataset, each EREL is represented by a set of pixel coordinates. In order to analyze their characteristics and relationships, these ERELs are extracted in binary form and grayscale form respectively, shown in Fig. 2.
2.2 Correlation Evaluation
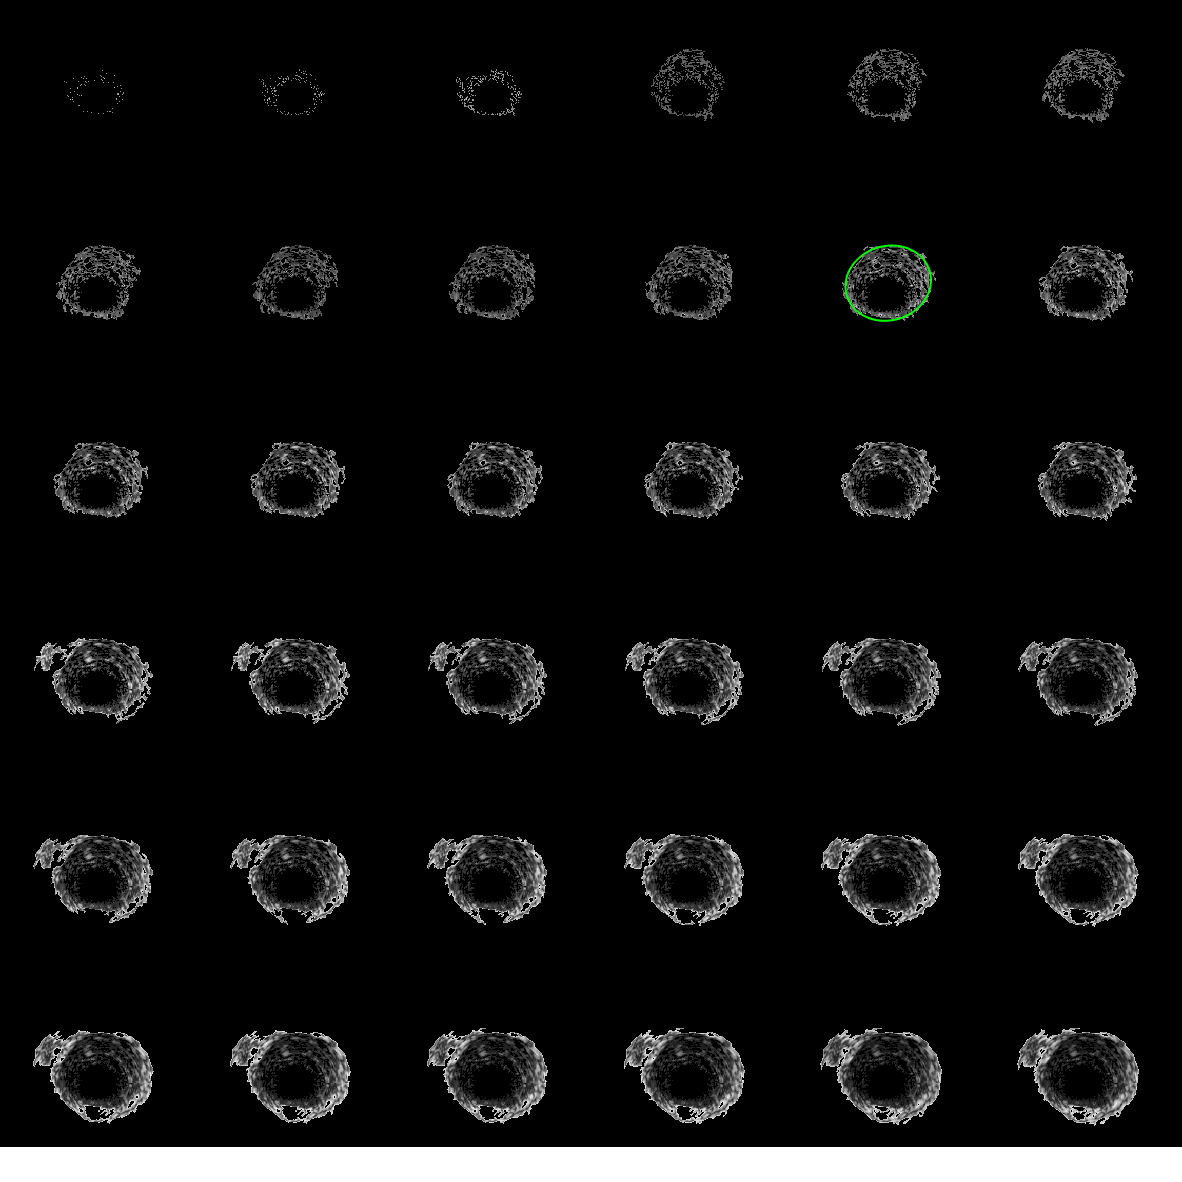
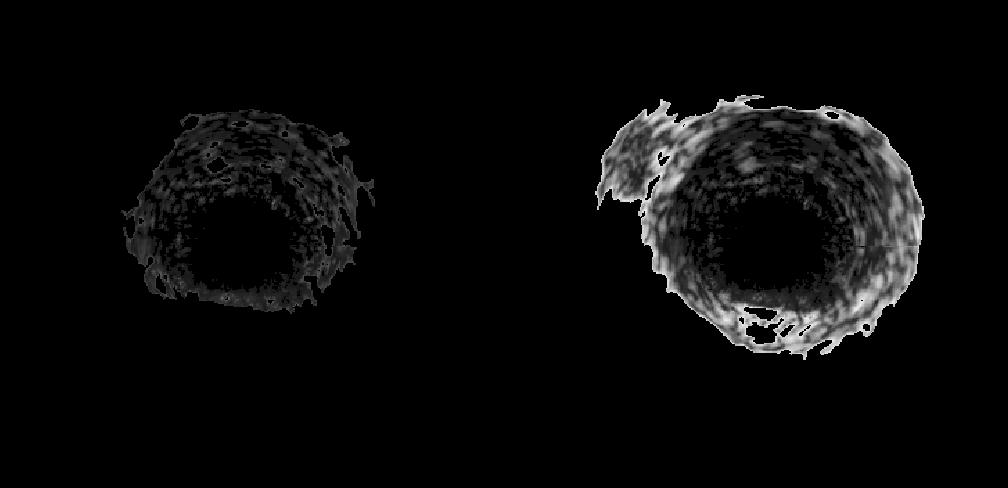
Fig. 3 visualizes EREL regions for an IVUS sample in grayscale form, where the ground truth EREL is circled. As we investigate these ERELs, we can see that the intensity and general shape of the ground truth EREL is preserved in all the subsequent ERELs. A direct comparison between the ground truth EREL and the last EREL in this sample is shown in Fig. 4(a). In the last EREL, the low intensity region in the middle tends to be the lumen region and the idea is to process on this frame to keep the possible lumen region. Then a 2D correlation coefficient is computed for each EREL (denoted by ) and the approximate lumen region (denoted by ):
| (1) |
where is the average intensity of , is the average intensity of and represent columns and rows of respectively. Presumably, the ground truth should have a high correlation with this region.
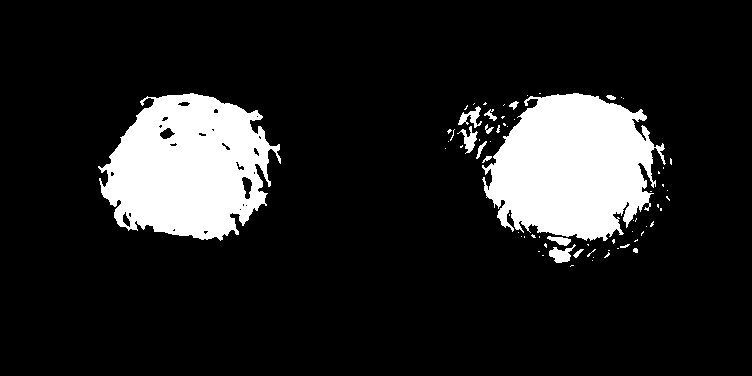
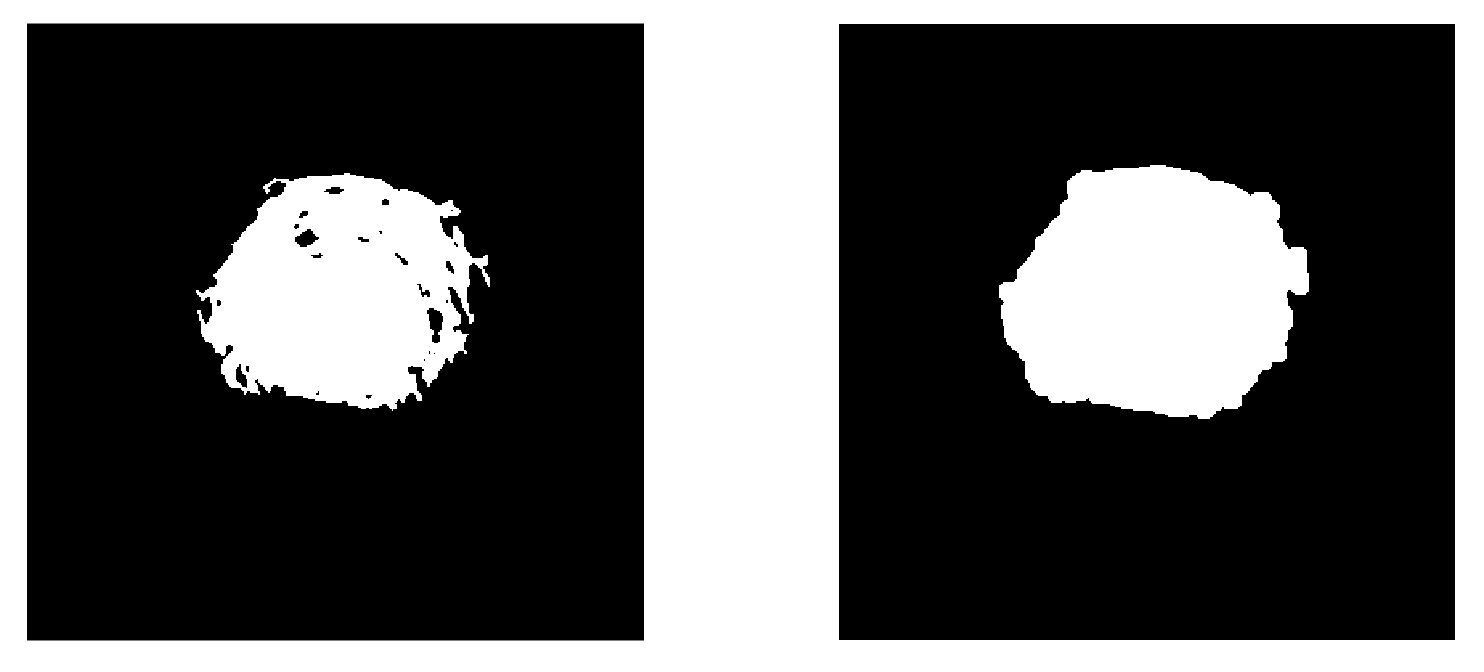
Therefore, the average intensity of the last EREL is calculated as a threshold. we process the last EREL to keep only the low intensity pixels. The result is shown in Fig. 4(b). The region on the left is the ground truth region in a binary form and the region on the right is the extracted region. As we can see these two regions are close and they should have a high correlation.
| (a) |
|
| (b) |
|
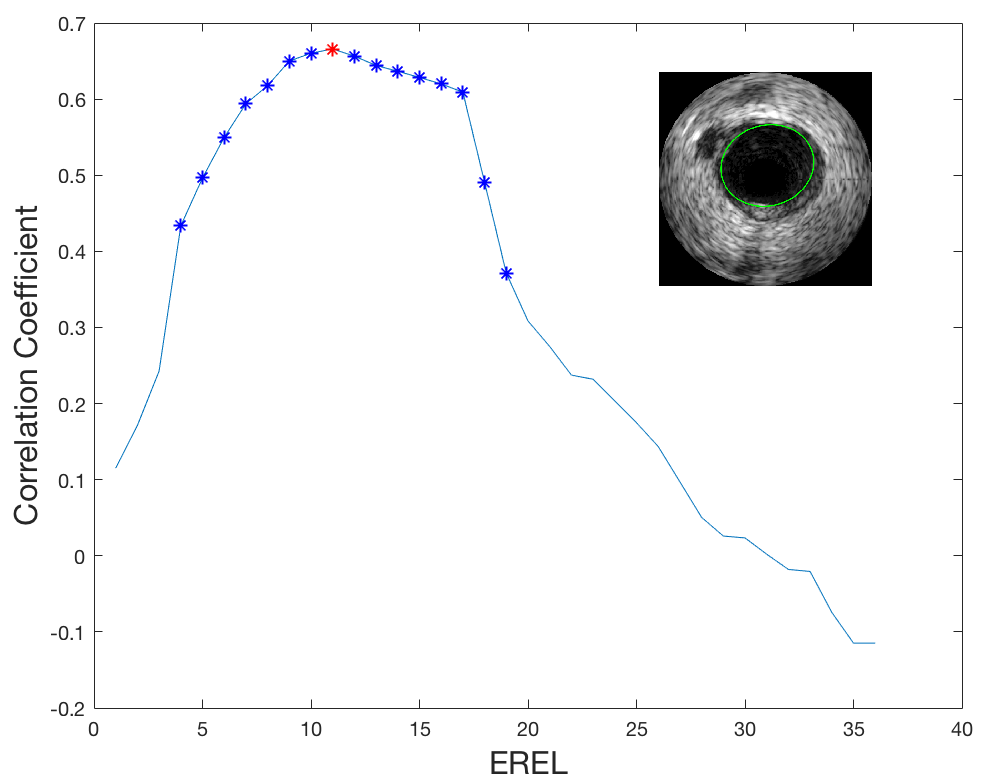
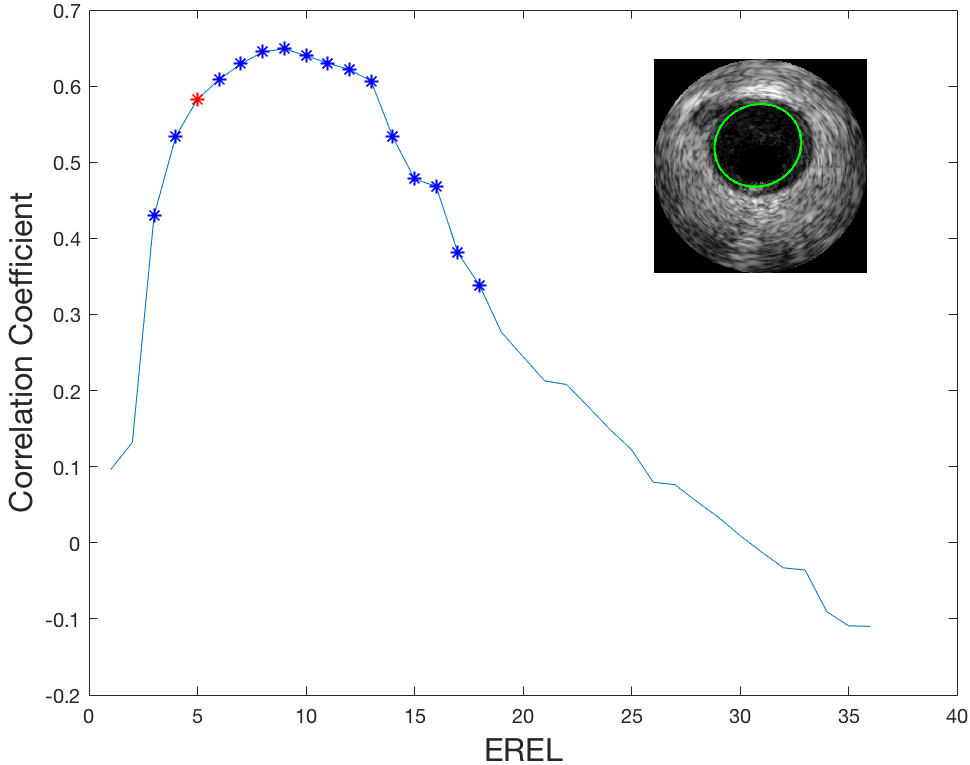
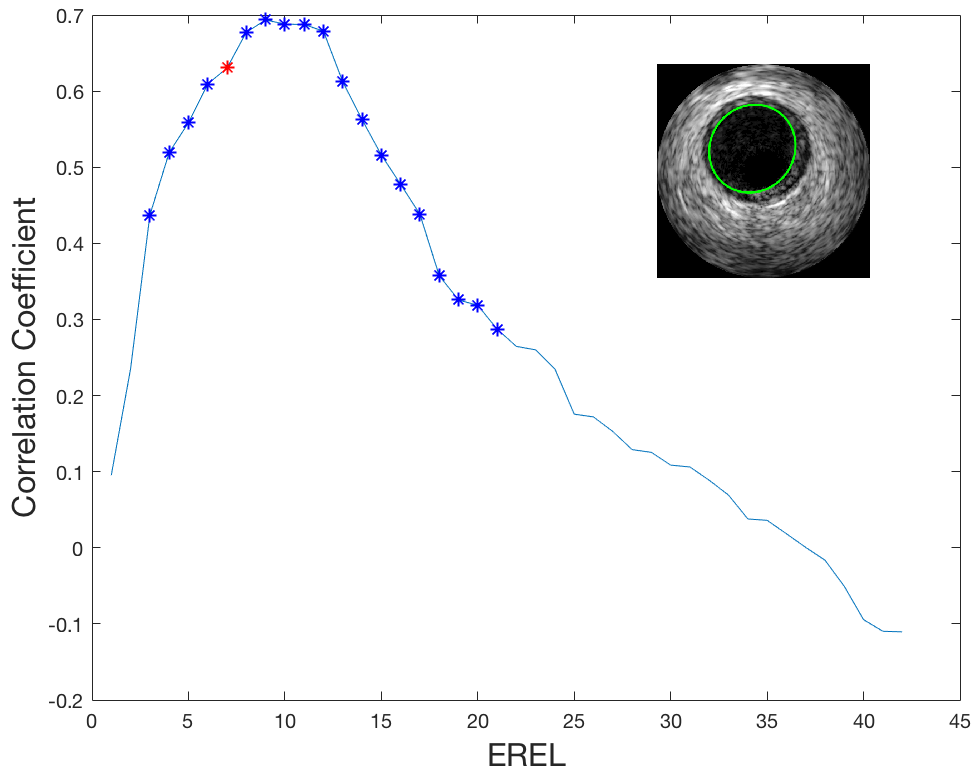
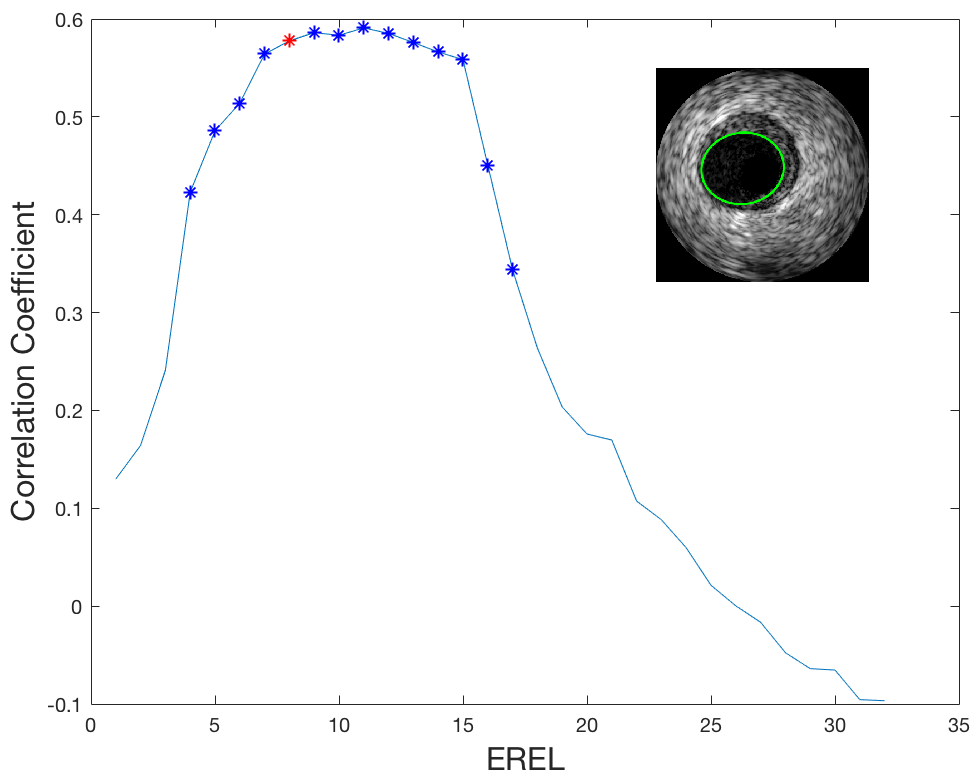
Some sample plots for correlation are shown in Fig. 5. It can be observed that these plots tend to be right-skewed and the ground truth ERELs (marked in red) are located around the peak of each plot. Without missing any ERELs, we are setting the average of these correlations as a threshold, and output all the ERELs with correlations higher than this threshold. Hence, the resulting list of ERELs is guaranteed to contain the ground truth EREL.
2.3 Compactness Evaluation
An EREL region is eventually defined by its contour; however, they may subject to internal cracks since ERELs in their nature are regions selected from a set of extremal points [6, 5]. Therefore, a morphological dilate operation is performed on each EREL. This dilation ensures that some insignificant cracks are filled to some extent, and gaps between ERELs caused by bifurcations can be narrowed where the general shape of an EREL is still preserved (shown in Fig. 6).
Due to the intrinsic shape of a luminal border, each EREL region is described by an elliptical contour [4]. The intuitive idea behind this step is that among all the EREL regions, the best matching EREL should have the tightest relationship with the fitted ellipse. Therefore, the ellipse is used as a boolean mask and the intersection between the EREL region and the ellipse is extracted (shown in Fig. 7).
 |
 |
 |
 |

 |
 |
 |
 |
For each EREL region, two measurements will be calculated:
-
1.
The intersection between EREL and its fitted ellipse over the fitted ellipse:
(2) This measurement guarantees a minimal amount of missing pixels within the fitted elliptical region after the dilation operation. Especially, it can effectively screen out those ERELs with shadow and bifurcation inaccurately included within the detected area.
-
2.
And the intersection between EREL and its fitted ellipse over the whole EREL region:
(3) This measurement guarantees that most of the detected pixels are fitted into the ellipse. It can also effectively exclude those EREL regions with bifurcation and shadow outside of the fitted ellipse that cause irregular boundary of the EREL.
Then these two measurements, and , are summed and used together as a compactness standard to define the suitability of an EREL region. A qualified EREL region is expected to have a higher value in this metric than the others in the same IVUS frame sample. Later, these measurements are arranged with the same ordering as the ERELs and the next subsection will describe how the best matching EREL is extracted.
| Dataset | HD (GT) | HD (Proposed) | JM (GT) | JM (Proposed) | |
|---|---|---|---|---|---|
| General | Training | 0.1970 (0.09) | 0.3159 (0.17) | 0.9123 (0.03) | 0.8761 (0.07) |
| Testing | 0.2287 (0.14) | 0.2952 (0.24) | 0.8906 (0.06) | 0.8747 (0.07) | |
| No Artifact | Training | 0.1861 (0.06) | 0.3080 (0.16) | 0.9138 (0.03) | 0.8755 (0.07) |
| Testing | 0.2076 (0.16) | 0.2771 (0.25) | 0.8978 (0.06) | 0.8864 (0.06) | |
| Bifurcation | Training | 0.2490 (0.19) | 0.3805 (0.22) | 0.9021 (0.05) | 0.8706 (0.06) |
| Testing | 0.4230 (0.10) | 0.5544 (0.19) | 0.8854 (0.04) | 0.7791 (0.11) | |
| Side Vessels | Training | 0.2426 (0.00) | 0.2426 (0.00) | 0.9269 (0.00) | 0.9269 (0.00) |
| Testing | 0.1914 (0.15) | 0.2406 (0.24) | 0.8809 (0.06) | 0.8872 (0.06) | |
| Shadow | Training | 0.1987 (0.07) | 0.2848 (0.13) | 0.9153 (0.02) | 0.8851 (0.05) |
| Testing | 0.2333 (0.12) | 0.2906 (0.22) | 0.8835 (0.04) | 0.8591 (0.08) |
2.4 EREL Selection
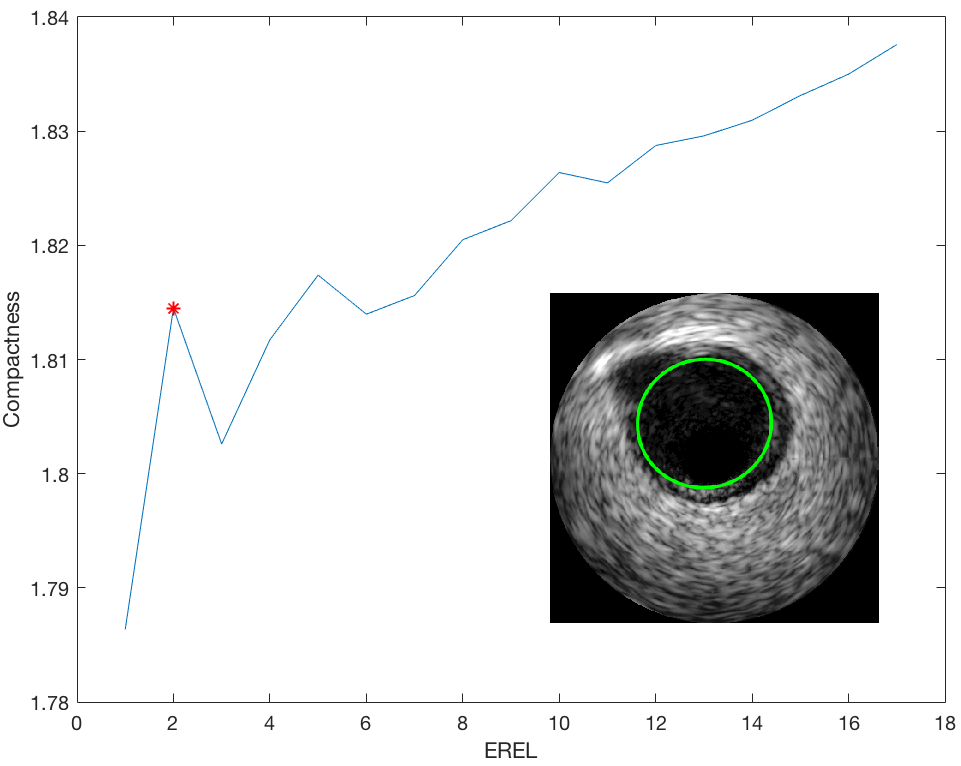
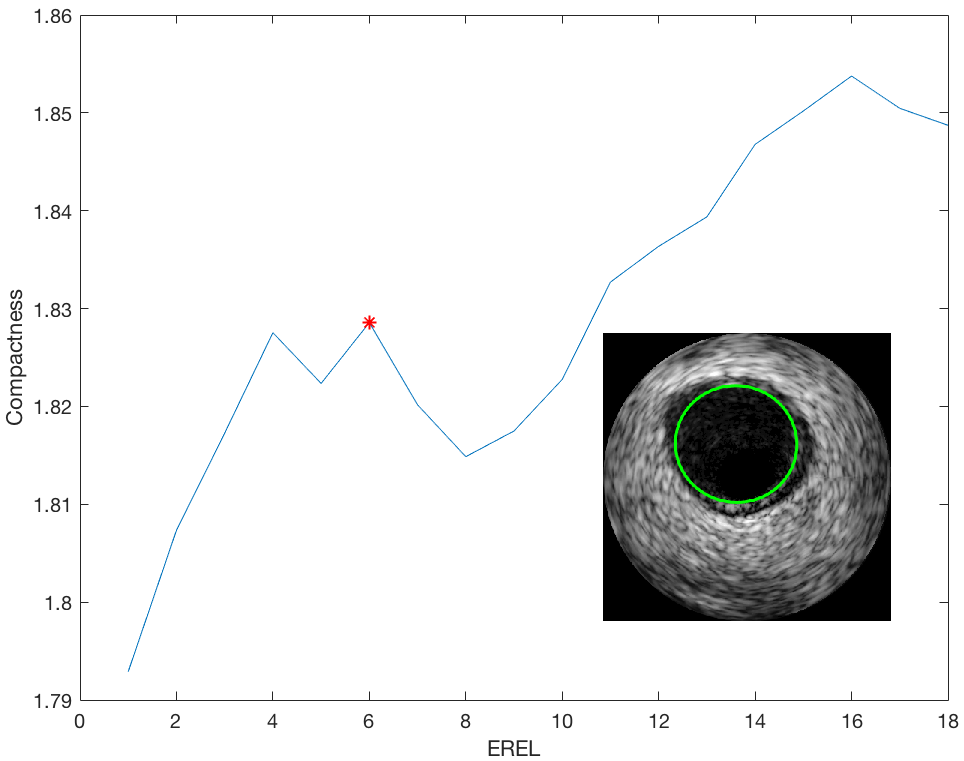
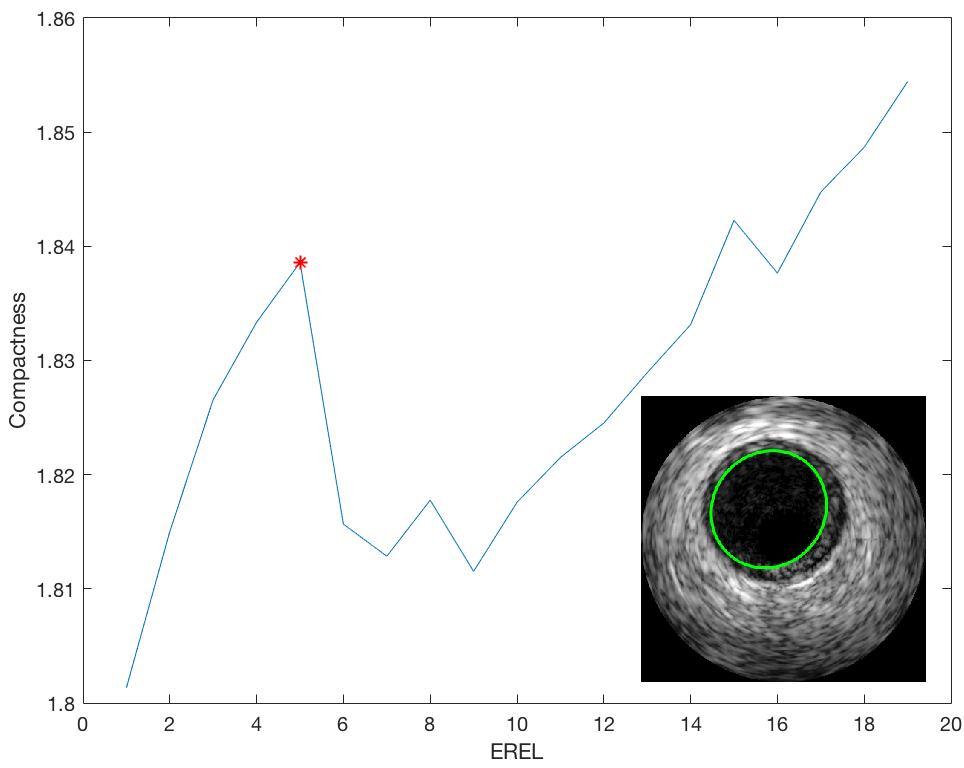
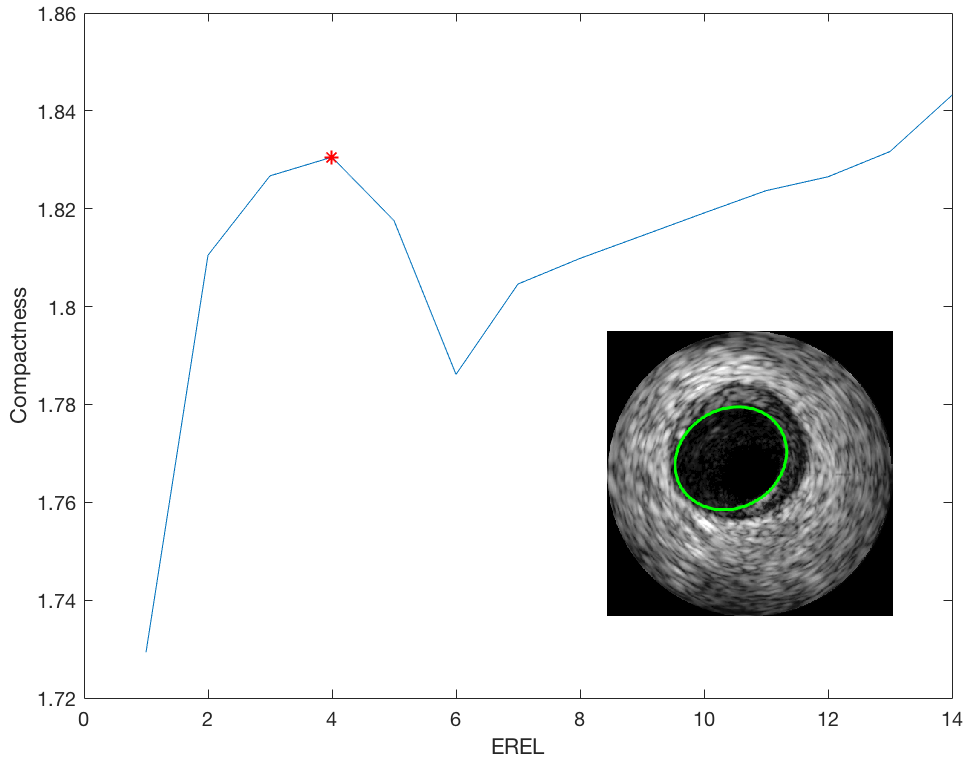
Fig. 8 visualizes the compactness plots for some sample frames, where the ground truth ERELs are marked in red. We can conclude that these plots obey a similar growing trend and the best matching EREL locates at one of the local maxima of each plot. It is also worth noting that other local maxima may correspond to the shadowed area within the lumen, the media border, and also some intermediate regions with conformance to elliptical shape.
Without loss of generality, for IVUS frames where several local maxima exist, the best matching EREL is selected from the first few local maxima where they have a high possibility to represent lumen. For samples with small number of ERELs where the compactness measure continuously grow and local maximum does not exist, the global maximal EREL is chosen. The result of this method is presented and analyzed in the next section.
3 Experimental Results
The performance of this method is summarized in Table 2. Also a comparison between the proposed method and the result in original work [4] is shown in Table 3. Among all the EREL regions, the one with the shortest Hausdorff Distance (HD) to the hand-annotated ground truth is taken as the golden standard. These numbers represent the best result that an algorithm can achieve in this EREL selection task. The performance of the proposed strategy is evaluated under five categories: the general performance, performance of the proposed method on frames with no artifacts, with bifurcation, with side vessels and with shadow.
4 Discussion and Conclusion
The proposed method in this paper uses the morphological characteristics of EREL regions as metrics to evaluate these ERELs. Other feature learning methods may require pixel-to-pixel comparison between every two EREL regions and would result in high computational consumption; where this proposed method operates on independent ERELs which makes it fast and straightforward.
Nevertheless, there are still some improvements needed for this method. In the first pass, this method extracts a possible lumen region from the last EREL in each series and computes the correlation coefficient between each EREL and this extracted region. For a small IVUS sample where the last EREL is similar to all the other ones, this method fails to extract a possible lumen region which may lead to negative correlation in all comparisons. The second pass works on the basis of the compactness of an EREL region and its fitted ellipse. A major issue comes from this method is that any EREL conformed to elliptical shape may be wrongly chosen as a suitable representation. Therefore, incorporating the characteristics of lumen into this method is necessary and beneficial to eliminate these interferences.
Furthermore, considering the simplicity and power of this combined correlation and compactness evaluations, it is also likely to produce a better result if the these metrics can be used as supplementary tools in other EREL selection algorithms to screen out the inappropriate ERELs.
The original study also involves assigning an EREL as media region of human coronary where in this work we focus on lumen only. EREL selection as media adopts a similar idea with some variations due to the particular characteristics of media, this task will be assigned as the future work of this study.
| HD[4] | HD(Proposed) | JM[4] | JM(Proposed) | |
|---|---|---|---|---|
| General | 0.30 (0.20) | 0.2952 (0.24) | 0.87 (0.06) | 0.8747 (0.07) |
| No Artifact | 0.29 (0.17) | 0.2771 (0.25) | 0.88 (0.05) | 0.8864 (0.06) |
| Bifurcation | 0.53 (0.34) | 0.5544 (0.19) | 0.79 (0.12) | 0.7791 (0.11) |
| Side Vessels | 0.24 (0.11) | 0.2406 (0.24) | 0.87 (0.05) | 0.8872 (0.06) |
| Shadow | 0.29 (0.20) | 0.2906 (0.22) | 0.86 (0.07) | 0.8591 (0.08) |
References
- [1] S. Balocco, C. Gatta, F. Ciompi, A. Wahle, P. Radeva, S. Carlier, G. Unal, E. Sanidas, J. Mauri, X. Carillo, et al. Standardized evaluation methodology and reference database for evaluating ivus image segmentation. Computerized medical imaging and graphics, 38(2):70–90, 2014.
- [2] F. Chen, R. Ma, J. Liu, M. Zhu, and H. Liao. Lumen and media-adventitia border detection in ivus images using texture enhanced deformable model. Computerized Medical Imaging and Graphics, 2018.
- [3] F. Destrempes, M.-H. R. Cardinal, L. Allard, J.-C. Tardif, and G. Cloutier. Segmentation method of intravascular ultrasound images of human coronary arteries. Computerized Medical Imaging and Graphics, 38(2):91–103, 2014.
- [4] M. Faraji, I. Cheng, I. Naudin, and A. Basu. Segmentation of arterial walls in intravascular ultrasound cross-sectional images using extremal region selection. Ultrasonics, 84:356–365, 2018.
- [5] M. Faraji, J. Shanbehzadeh, K. Nasrollahi, and T. B. Moeslund. Erel: extremal regions of extremum levels. In Image Processing (ICIP), 2015 IEEE International Conference on, pages 681–685. IEEE, 2015.
- [6] M. Faraji, J. Shanbehzadeh, K. Nasrollahi, and T. B. Moeslund. Extremal regions detection guided by maxima of gradient magnitude. IEEE Transactions on Image Processing, 24(12):5401–5415, 2015.
- [7] M. A. HAMDI, K. S. Ettabaa, and M. L. HARABI. Real time ivus segmentation and plaque characterization by combining morphological snakes and contourlet transform. International Journal of Imaging and Robotics™, 11(3):57–67, 2013.
- [8] J. D. Head and M. C. Zerner. A broyden—fletcher—goldfarb—shanno optimization procedure for molecular geometries. Chemical physics letters, 122(3):264–270, 1985.
- [9] S. Su, Z. Hu, Q. Lin, W. K. Hau, Z. Gao, and H. Zhang. An artificial neural network method for lumen and media-adventitia border detection in ivus. Computerized Medical Imaging and Graphics, 57:29–39, 2017.