Star formation and gas inflows in the OH Megamaser galaxy IRAS03056+2034
Abstract
We have obtained observations of the OH Megamaser galaxy IRAS03056+0234 using Gemini Multi-Object Spectrograph (GMOS) Integral Field Unit (IFU), Very Large Array (VLA) and Hubble Space Telescope (HST). The HST data reveals spiral arms containing knots of emission associated to star forming regions. The GMOS-IFU data cover the spectral range of 4500 to 7500 Å at a velocity resolution of 90 km s-1 and spatial resolution of 506 pc. The emission-line flux distributions reveal a ring of star forming regions with radius of 786 pc centred at the nucleus of the galaxy, with an ionized gas mass of 1.2 108M⊙, an ionizing photon luminosity of log Q[H+]=53.8 and a star formation rate of 4.9 M⊙ yr-1. The emission-line ratios and radio emission suggest that the gas at the nuclear region is excited by both starburst activity and an active galactic nucleus. The gas velocity fields are partially reproduced by rotation in the galactic plane, but show, in addition, excess redshifts to the east of the nucleus, consistent with gas inflows towards the nucleus, with velocity of 45 km s-1 and a mass inflow rate of 7.710-3 M⊙ yr-1.
keywords:
galaxies: nuclei – galaxies: kinematics and dynamics – galaxies: individual (IRAS03056+2034)1 Introduction
OH Megamasers (hereafter OHMs) are powerful extragalactic masers in which the emission occurs predominantly in the 1667/1665 MHz lines with typical luminosities of about 103 L⊙. The isotropic luminosity of OHM’s is 108 times greater than the luminosity of the OH masers in the Milk Way. The megamasers can be explained on the basis of amplification of the nuclear radio continuum by foreground molecular material with inverted level populations arising from some pumping source (e.g. Baan et al., 1998; Lo, 2005; Chen et al., 2007).
In general, OHMs have been observed in (Ultra) Luminous Infra-Red Galaxies [(U)LIRGs] with infra-red luminosities of LIR >= 1011 L⊙. These merging systems fulfill all the requirements for producing OHM emission. The merger interaction concentrates molecular gas in the galaxy nuclei, creates strong dust emission from the starburst (SB) and Active Galactic Nuclei (AGN) activity, and produces radio continuum emission from the AGN or SB (e.g. Henkel et al., 1987; Darling & Giovanelli, 2000; Chen et al., 2007).
It is not well understood if the mechanism of ionization in the systems that host OHM is dominated by star formation or AGN activity, in the sense that the hosts of OHM emission usually present features of both phenomena in their spectra. A possible explanation for these features is that they originate in a central AGN, contaminated by emission of circumnuclear star-forming regions, as the angular resolution of the observations usually corresponds to a few kiloparsecs at the galaxies. Alternatively, the OHM galaxies could represent a transition stage between a starburst and the emergence of an AGN, as suggested by Darling & Giovanelli (2006).
In an effort to investigate the nature of the ionization in OHM galaxies we have been performing a multi-wavelength study of a sample of these galaxies (Sales et al., 2015; Hekatelyne et al., 2018). In this paper we present Gemini Multi-Object Spectrograph (GMOS) Integral Field Unit (IFU) observations, Very Large Array (VLA) continuum data and Hubble Space Telescope (HST) narrow and broad band images of the galaxy IRAS03056+2034, which is a LIRG that hosts OHM emission. This target is part of a sample including another 14 OHM galaxies, for which we have the same combination of HST and VLA data. The targets selected for IFU observations were chosen based on the morphology revealed by the HST images. This paper is part of a series based on multi-wavelength observations with the aim of studying the gas kinematics and excitation of OHM galaxies.
In a previous paper (Hekatelyne et al., 2018) we mapped the eastern nucleus of the OHM galaxy IRASF23199+0123 using HST, VLA and GMOS data. We were able to conclude that the object is an interacting pair with a tail connecting the two galaxies and detected two OH maser sources associated to the eastern member. Moreover, we discovered a Seyfert 1 nucleus in the eastern member of the pair, via detection of an unresolved broad double peaked component in the Hα emission-line. In addition, the masing sources were observed in the vicinity of a region of enhanced velocity dispersion and higher line ratios, suggesting that they are associated with shocks driven by AGN outflows. These results suggest that the OH megamaser emission in IRASF23199+0123 is associated to AGN activity. Sales et al. (2015) presented a multi-wavelength study of the OH megamaser galaxy IRAS16399–0937 using HST, VLA, 2MASS, Herschel and Spitzer data. This galaxy has two nucleus separated by 3.4 kpc and its infrared spectrum is dominated by strong polycyclic aromatic hydrocarbon, but the northern nucleus shows in addition deep silicate and molecular absorption features. The analysis of the spectral energy distribution reveals that the northern nucleus contains an AGN with bolometric luminosity of erg s-1.
IRAS03056+2034 (hereafter IRAS03056) is a spiral galaxy (SB(rs)B (Vaucouleurs et al., 1991)) that presents strong OHM emission. This detection was obtained with the Nancay radio telescope in 1990, indicating FIR luminosity of 151010 L⊙ (Bottinelli et al., 1990). Baan et al. (1998) used spectroscopic data obtained with the 200 inch Hale telescope at the Palomar Observatory in order to determine the optical classifications of 42 OH Megamaser galaxies, based on line ratios, and classified IRAS03056 as a starburst galaxy. We adopt the distance of 116 Mpc as derived by Theureau et al. (2007) from the Tully-Fisher relation.
We have obtained GMOS-IFU data covering the central region of IRAS03056 in order to map the distribution and kinematics of the emitting gas and investigate the origin of the line emission in the central region of this object. This paper is organized as follows. The observations and the data reduction procedure are described in Sec. 2, the emission-line flux distributions, emission-line ratio and kinematics maps obtained from GMOS data, as well as the HST and VLA images are presented in Sec. 3. These results are discussed in Sec. 4 and then in Sec. 5 we present the final remarks.
2 Observations and data reduction
2.1 HST images
The HST images of IRAS03056 were obtained with the Advanced Camera for Surveys (ACS). The acquired images consist of continuum and emission line imaging of a sample of 15 OHM galaxies (Program id 11604; PI: D.J. Axon). The observations were done with the wide-field channel (WFC) using broad (F814W), narrow (FR656N) and medium-band (FR914M) filters. The total integration times were 600 sec for the broad band filter, 200 sec for the medium-band and 600 sec in the narrow-band filter which contains the H and [N ii] lines.
The images were processed using IRAF packages (Tody, 1986, 1993). First of all, the cosmic rays were removed from the images using the lacos im task (van Dokkum, 2001). In order to build a continuum-free H[Nii] image of IRAS03056 we estimate the count rate for foreground stars considering the medium and narrow band images. This procedure allowed us to define a mean scaling factor that was applied to the medium-band image. It provided us a scaled image that was subtracted from the narrow band image (Sales et al., in preparation).
2.2 VLA Radio Continuum data
We reduced archival VLA A-array data at 1.425 GHz from the project AB660. These data were acquired on 14 December 1992. The data were reduced following standard procedures in AIPS. The final image of IRAS03056 was created after a couple of phase-only and phase+amplitude self-calibrations, using the AIPS tasks CALIB and IMAGR iteratively. The r.m.s. noise in the image is Jy beam-1. The restoring beam is arcsec at a PA = . The peak intensity of the compact radio core seen in the image is mJy beam-1. An image at 4.86 GHz from the project AB660 at a resolution of arcsec (beam PA=) was also available in the NRAO image archive. A point source of peak intensity mJy beam-1 is visible in this image; the r.m.s. noise is Jy beam-1.
2.3 GMOS-IFU data
Optical spectroscopic data for IRAS03056 was obtained at the Gemini North telescope, using the Gemini Multi-Object Spectrograph Integral Field Unit (GMOS-IFU, Allington-Smith et al., 2002; Hook et al., 2004). The observations were performed in 2013, October, November and December (Gemini project GN-2013B-Q-97 – PI: D. Sales). The observations were carried out using the B600 grating in combination with the G5307 filter, with the major axis of the IFU oriented along position angle , approximately along the major axis of the galaxy.
The total integration time was 12 000 sec divided into 10 individual exposures of 1 200 sec each. The one slit mode of GMOS IFU was used, resulting in a total angular coverage of 5035, and a spectral range that includes the Hα, [N ii]6583, [S ii]6717, H, [O iii]5007 and [O i]6300 emission-lines.
In order to process the data we followed the standard steps for spectroscopic data reduction using GEMINI package routines of IRAF (Lena, 2014). The basic steps of data reduction comprise bias level subtraction, flatfielding, trimming and wavelength calibration. We used the CuAr arc lamps as reference in order to apply the wavelength calibration to the data and subtracted the sky emission contamination. In order to apply the flux calibration we used a sensitivity function that was generated from a spectrum of the BD+28 4211 photometric standard star, observed in the same night of the galaxy exposures.
After flux calibration we created datacubes for each exposure at a sampling of 0101. These datacubes were median combined using IRAF gemcombine task resulting in the final data cube for the object. In the mosaicking process, we used as a reference the peak of the continuum emission and used the sigclip algorithm to remove bad pixels.
The adopted GMOS configuration resulted in a spectral resolution of 1.8 Å, as obtained from the Full-width at half maximum (FWHM) of CuAr arc lamp lines used to perform the wavelength calibration, corresponding to 90 km s-1. The angular resolution is 0.9′′, as measured from the FWHM of field stars in the acquisition image. This corresponds to 506 pc at the galaxy.
As the final cube presented unwanted noise, we performed a spatial filtering using the IDL routine 111The routine is available at , which allows the choice of the cut-off frequency () and the order of the filter . The filtering process does not change the angular resolution of the data and all measurements presented in the forthcoming sections were done using the filtered cube.
3 Results
3.1 Large-scale structure and merger stage
IRAS03056+2034 has been spectroscopically classified as a starburst (Baan et al., 1998) with infrared and OH maser luminosities of L⊙ and log L L⊙ (Baan et al., 2008; Kandalian, 1996).
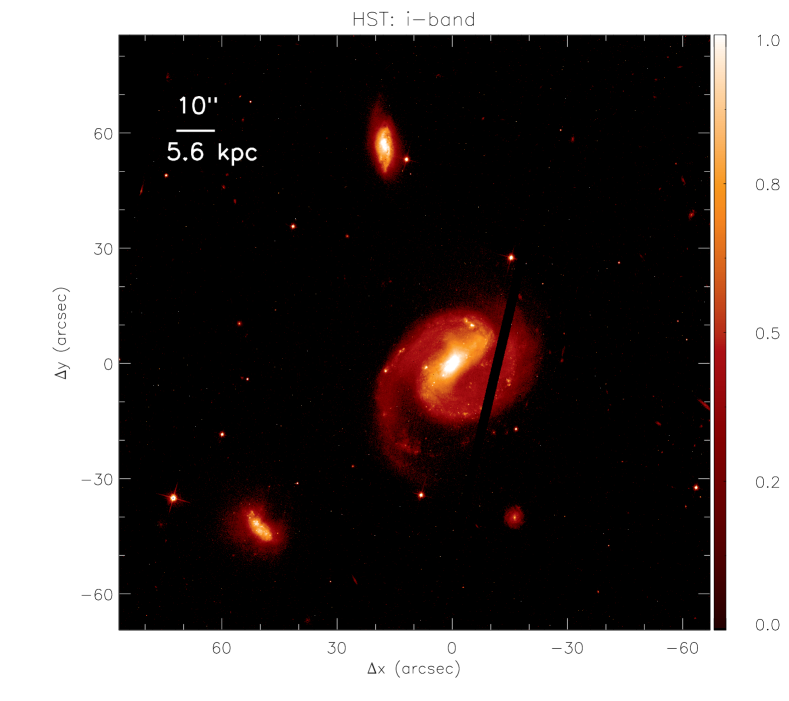
Figure 1 shows the large scale i-band image of IRAS03056 obtained with HST. This image shows a barred spiral galaxy with two symmetric arms. Two smaller companion galaxies at projected distances of roughly 31 kpc and 34.1 kpc from the nucleus of IRAS03056 are seen to the north and to south-east, respectively.
Haan et al. (2011) studied a sample of 73 nearby ( ) LIRGs and classified the objects into six different merger stages, based on H-band HST images. Using theirs classification scheme, IRAS03056 is classified as type 1 (separated galaxies) and this group constitutes only 8.3% of their sample.
Our large scale images exhibit a scenario that, in general, IRAS03056 is a fairly typical example of a LIRG that has low infrared luminosity (LL⊙) with a wide nuclear projected separation between the nuclear components, however, presenting composite (starburst+AGN) spectra (see Fig. 12 and Tab. 6 of Yuan, Kewley & Sanders, 2010). In terms of star-formation and molecular gas content, it is also important to note that IRAS03056 is widely similar to (U)LIRGs lying at the high end of the linear relation between the surface density of dense molecular gas (as traced by HCN) and the surface density of star-formation rate (SFR) with a positive correlation coefficient (see Fig. 5 and Tab. 2 of Liu et al., 2015).
The two OHM galaxies previously studied by our group (Sales et al., 2015; Hekatelyne et al., 2018) show a more advanced merger stage than IRAS03056, presenting “close binary" nuclei. In addition, the previously studied galaxies are slightly more luminous (log L 11.5 – 11.6 L⊙) than IRAS03056.

3.2 VLA and HST images
Figure 2 shows the 20 cm continuum image of IRAS03056 obtained with VLA. A compact radio source is detected at the nucleus of the galaxy and no extended emission is seen. We created a (1.425 - 4.86) GHz spectral index image of IRAS03056 and found that the core has a steep spectral index of ; this is consistent with optically thin synchrotron emission that could arise in an AGN jet (Pacholczyk, 1970). Moreover, we estimated the brightness temperature () of the 1.4 GHz radio core by using the total flux density (=11.7 mJy) and the beam-deconvolved size of the core (=0.51" x 0.24"), as derived from the AIPS Gaussian-fitting task JMFIT, and the relation for an unresolved component from Ulvestad et al. (2005). This turned out to be = K, supporting an AGN-related origin (e.g. Berton et al., 2018).
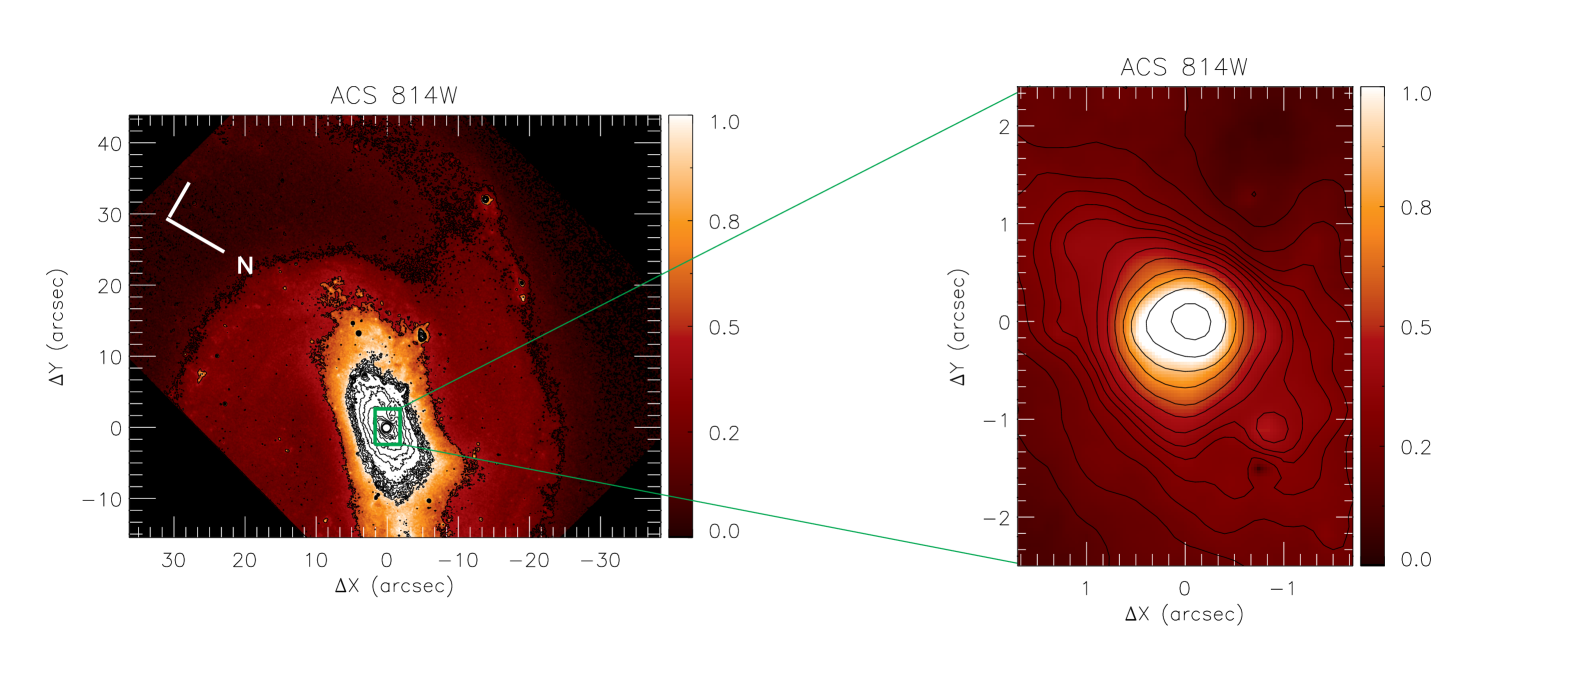
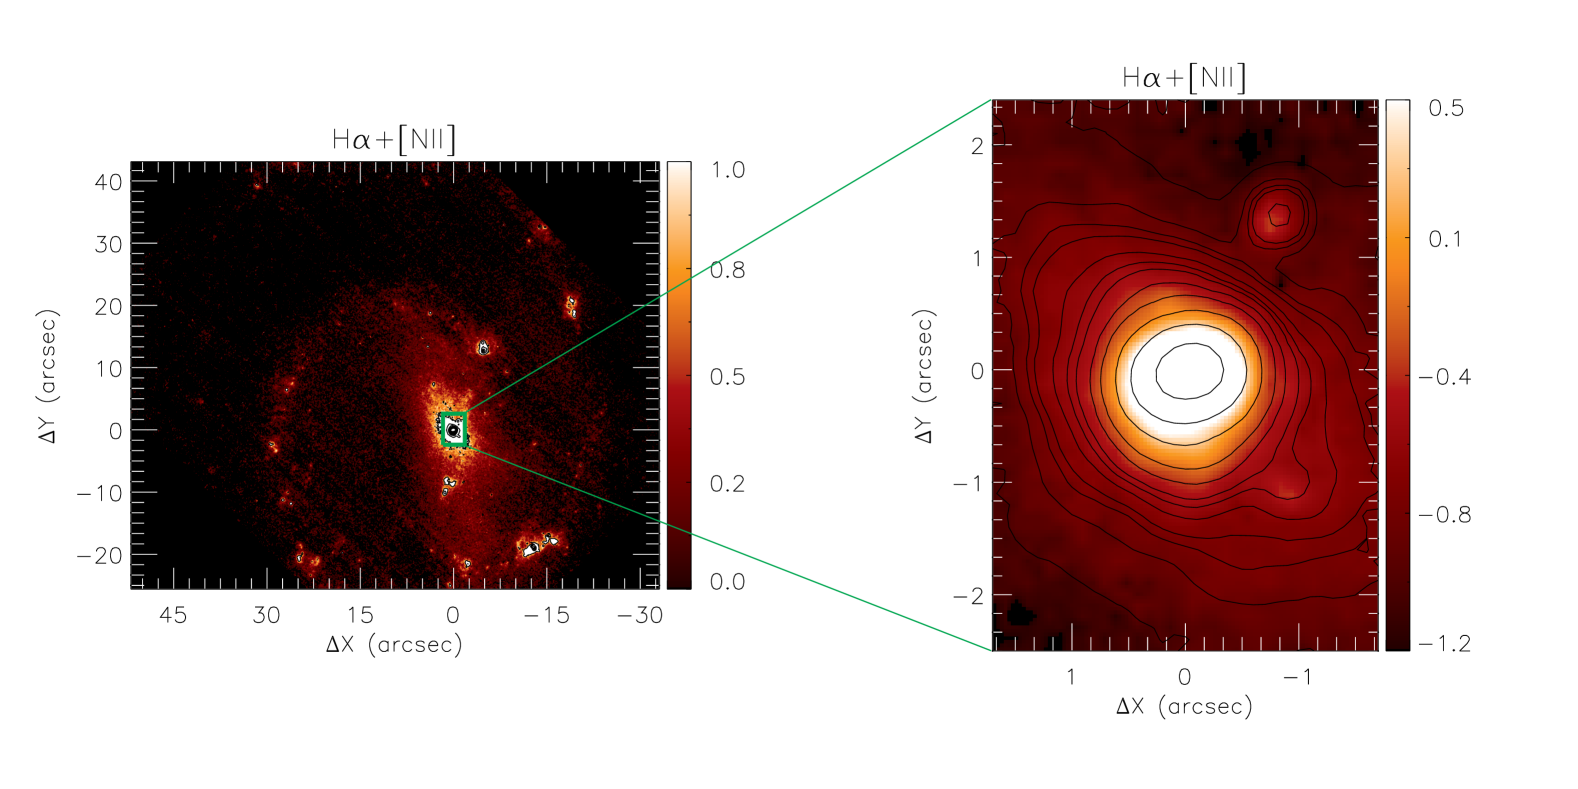
The HST images of IRAS03056 are presented in Figure 3. The left panels present the broad-band continuum (F814W) image (top panel) and the narrow-band [N ii]+H image (bottom panel) of the inner 2020 arcsec2 of IRAS03056. The green boxes represent the field-of-view (FoV) of the GMOS-IFU data. The right panels shows a zoom of the central region of the HST images, corresponding to the GMOS FoV. The HST images were rotated to the same orientation of the GMOS-IFU data.
The HST continuum image shows the most elongated emission along PA100/280∘ and presents a structure that seems to be associated with a spiral arm seen to the northeast of the nucleus. Moreover, the zoomed image (top-right panel) shows a strip of emission that extends from 1′′ north to 1′′ south of the nucleus.
The H+[N ii] flux distribution is similar to that in the continuum but shows more clearly the presence of spiral arms, one to the west and another to the southeast of the nucleus. At the central region (bottom-right panel) unresolved knots of emission are seen in both H+[N ii] and i band images, one at 15 north and another at 15 east of the nucleus.
3.3 Emission-line flux distributions
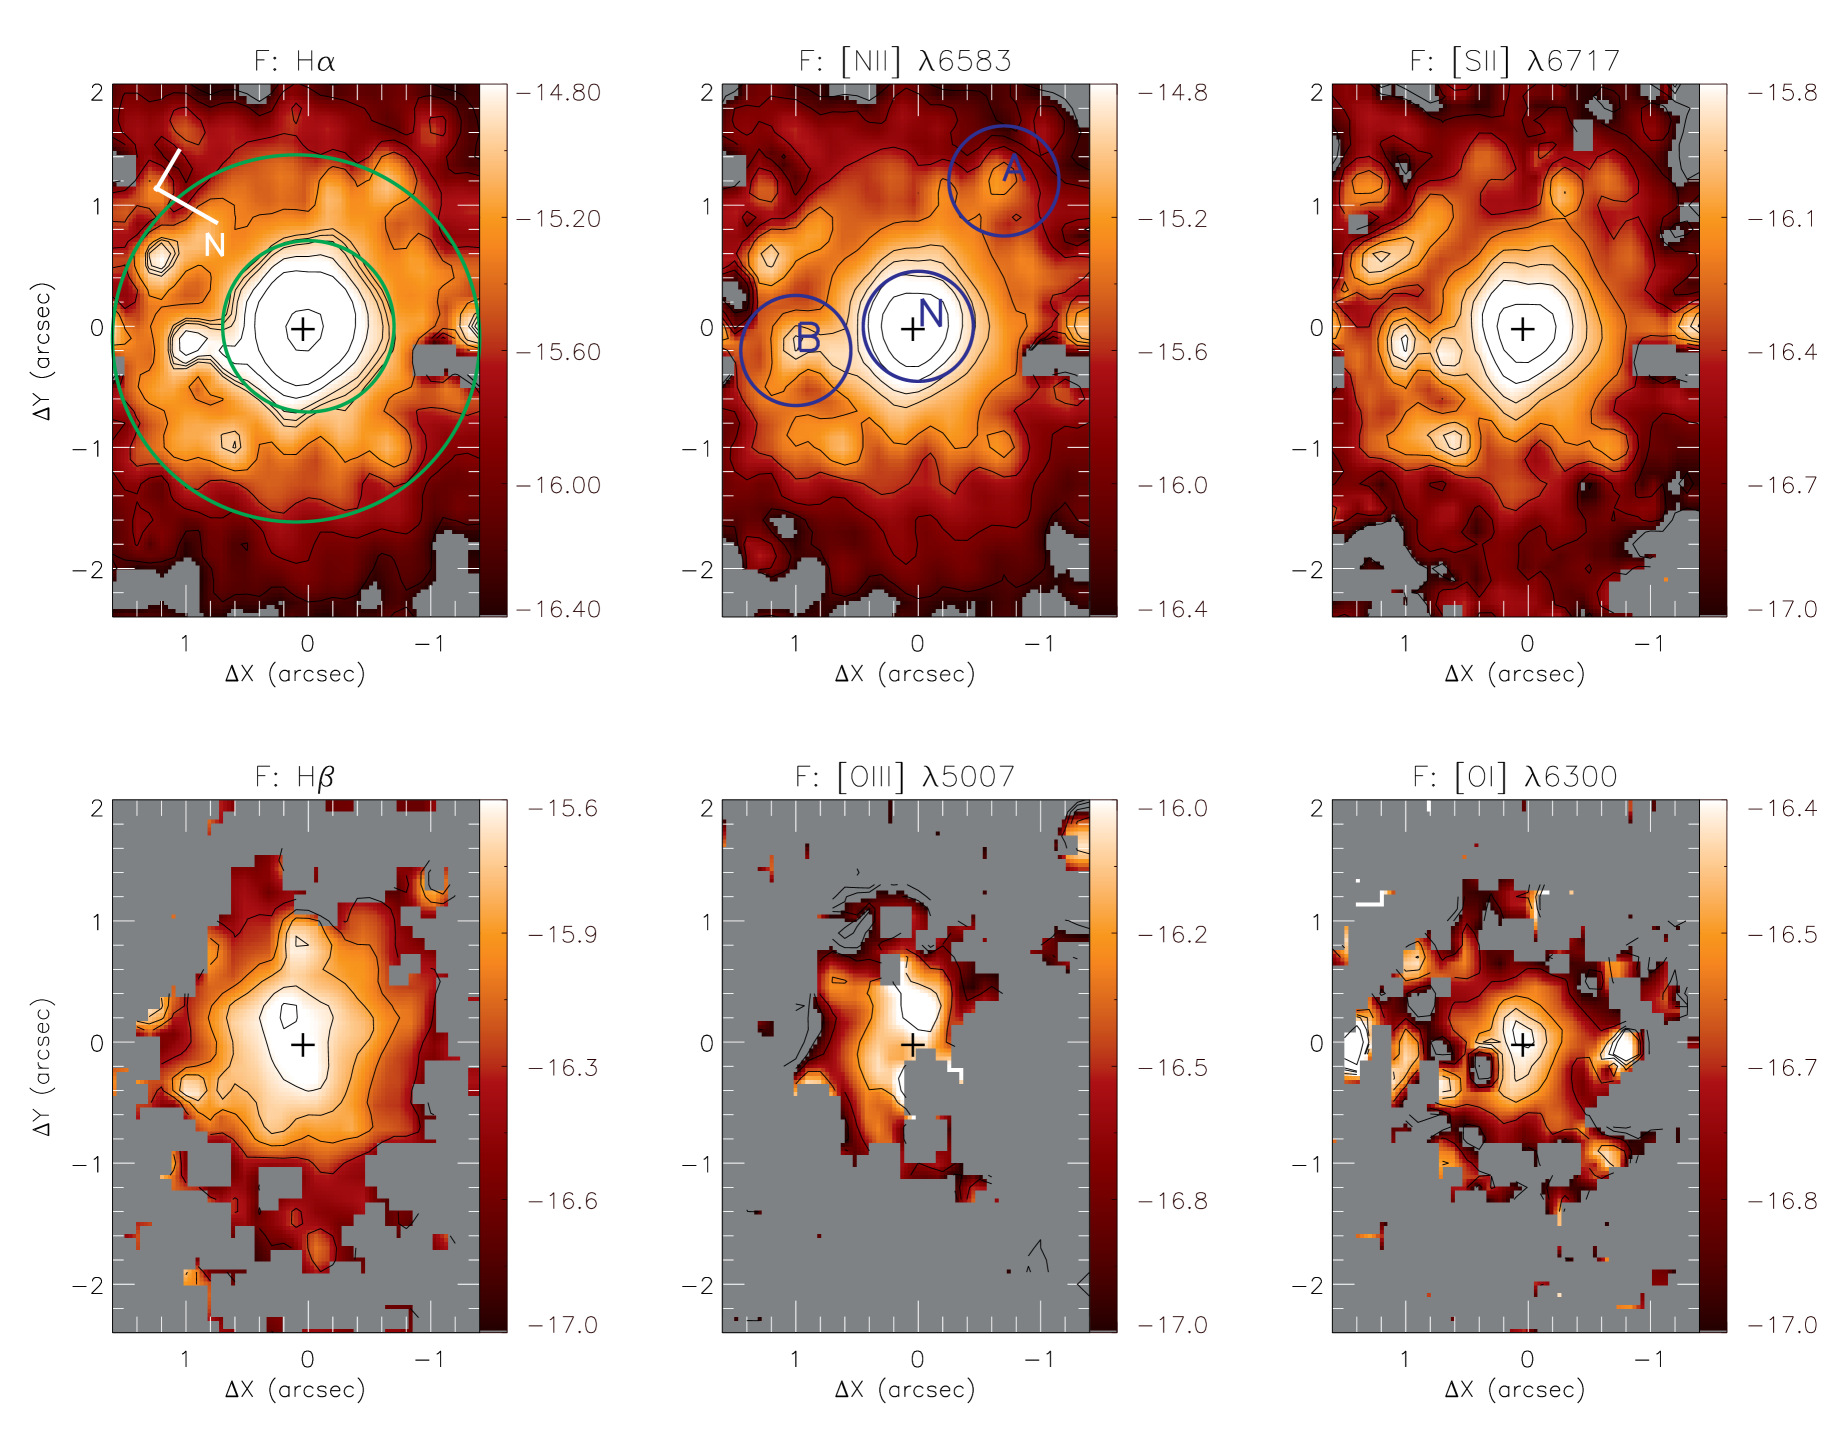
Figure 4 shows examples of IRAS03056 spectra obtained from the GMOS-IFU datacube for the three locations indicated as blue circles in the top-middle panel of Fig. 5 and labeled as N (nucleus), A (15 east) and B (10 southwest). These spectra were obtained by integrating the fluxes within circular apertures of 045 radius. The strongest emission lines are identified in the nuclear spectrum.
Aiming to map emission-line flux distributions, line-of-sight velocity () and velocity dispersion () of the emitting gas, we have fitted the emission-line profiles of H, [N ii]6548,6583, H, [S ii]6717, [O i]6300 and [O iii]5007 by Gaussian curves. The fitting procedure was performed using modified versions of the line-PROfile FITting (profit) routine (Riffel et al., 2010). This routine performs the modeling of the observed emission-line profile using the MPFITFUN routine (Markwardt et al., 2009), via a non-linear least-squares fit. The outputs of the routine are the emission-line flux, the centroid velocity, the velocity dispersion and their corresponding uncertainties for each emission line.
The fitting process for the [N ii]6548,6583+H complex was performed simultaneously, considering one Gaussian per line. During the fit, we kept tied the kinematics ( and ) of the [N ii] and fixed the [N ii]6583/[N ii]6548 intensity ratio to its theoretical value (3, Osterbrock, 1989). The underlying continuum was fitted by a linear equation, constrained by the adjacent continuum regions.
Figure 5 presents the flux distributions for H, [N ii]6583, [S ii]6717, H, [O iii]5007 and [O i]6300 emission-line. The color bars show the flux in logarithmic units of erg s-1cm2 and the grey regions represent masked locations where the signal-to-noise ratio was not high enough to obtain good fits of the emission-line profiles. These locations present flux uncertainty larger than 30%. The central crosses mark the location of the nucleus, defined as the position of the peak of continuum emission. H, [N ii]6583 and [S ii]6717 emission-lines flux distributions are similar presenting extended emission over the whole GMOS FoV. One can notice the presence of unresolved knots of emission surrounding the nucleus at 1′′ from it.
The bottom panels of Fig. 5 show the flux distribution maps for H, [O iii]5007 and [O i]6300, which are generally detected only within a smaller region around the nucleus. As for H, the H flux map shows some unresolved knots of emission at 1′′ away from the nucleus and faint extended emission is seen to up to 2′′ from it. The [O iii]5007 emission is detected only very close to the nucleus, at distances smaller than 1′′. The [O i]6300 emission is also mostly concentrated within 1′′ of the nucleus.

3.4 Line-Ratio maps
The [N ii]6583/H, [S ii]6717/H, [O i]6300/H and [O iii]5007/H emission-line flux ratios can be used to investigate the origin of the line emission. The lines of each ratio above are close in wavelength and thus the effects of dust extinction can be neglected. Figure 6 presents the flux ratio maps for [N ii]6583/H, [S ii]6717/H, [O i]6300/H and [O iii]5007/H.
The [N ii]6583/H ratio map is remarkably uniform, presenting small values of roughly 0.75, except for the regions located to the north and northwest of the nucleus, close to the borders of the GMOS FoV. The [S ii]6717/H map shows constant values of surrounding the nucleus at 1′′, approximately coincident with the ring of enhanced H emission seen in Figure 5. Some smaller values are seen within the ring and values of up to 0.5 are seen at larger distances from the nucleus. The [O i]6300/H ratio map presents constant values of 0.02 within the inner 1′′. The [O iii]5007/H ratio typically has values close to 0.2, but a few knots show higher values, reaching 0.5.
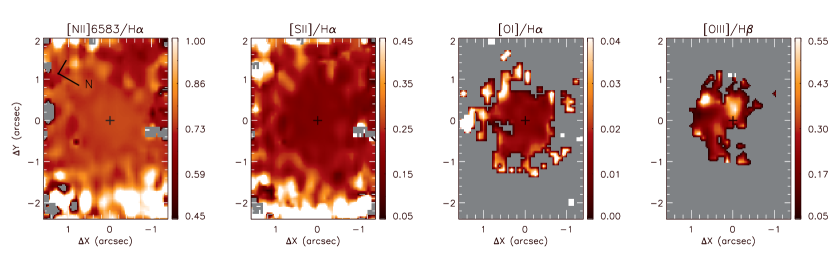
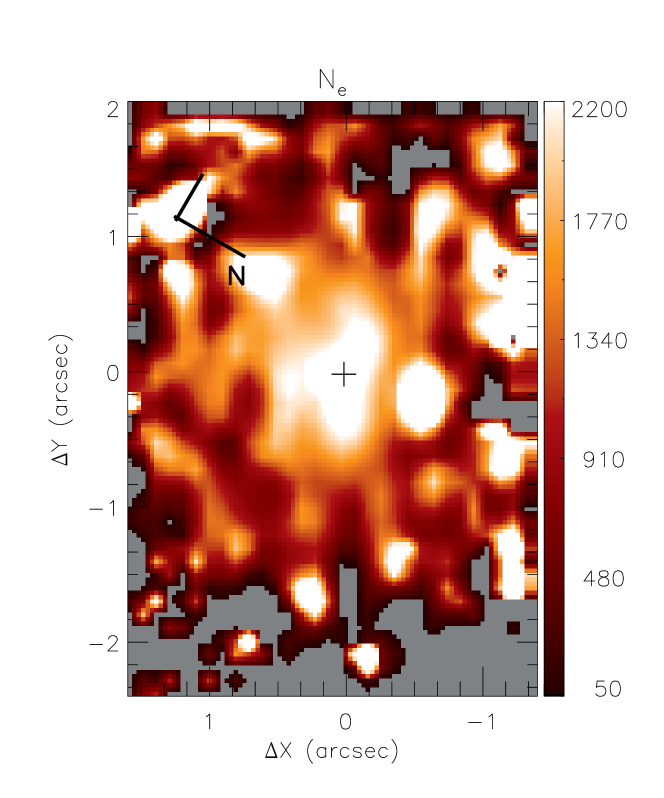
Figure 7 shows the electron density Ne map, measured from the [S ii] 6717/ 6731 line-ratio, assuming an electron temperature of 10 000 K for the ionized gas as input for the temden routine in the stsdas.iraf package. The map shows values ranging from 100 to 2200 cm-1, with the highest ones observed at the nucleus and in unresolved structures in its surroundings.
3.5 Gas velocity fields and velocity dispersion maps
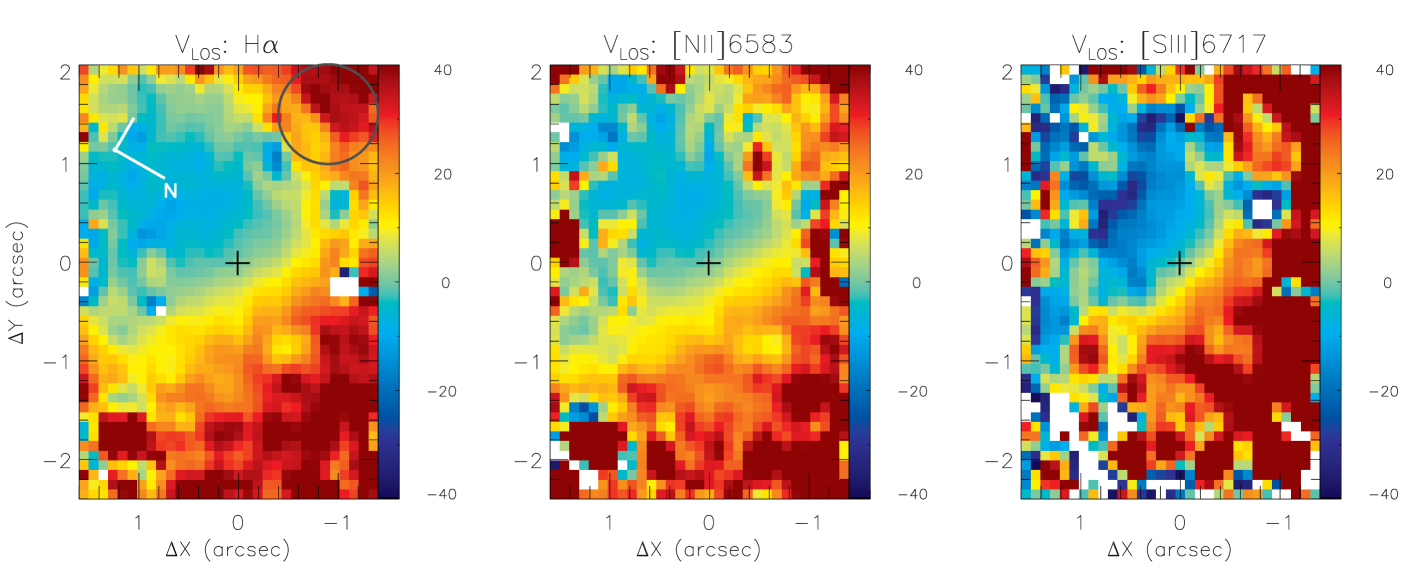
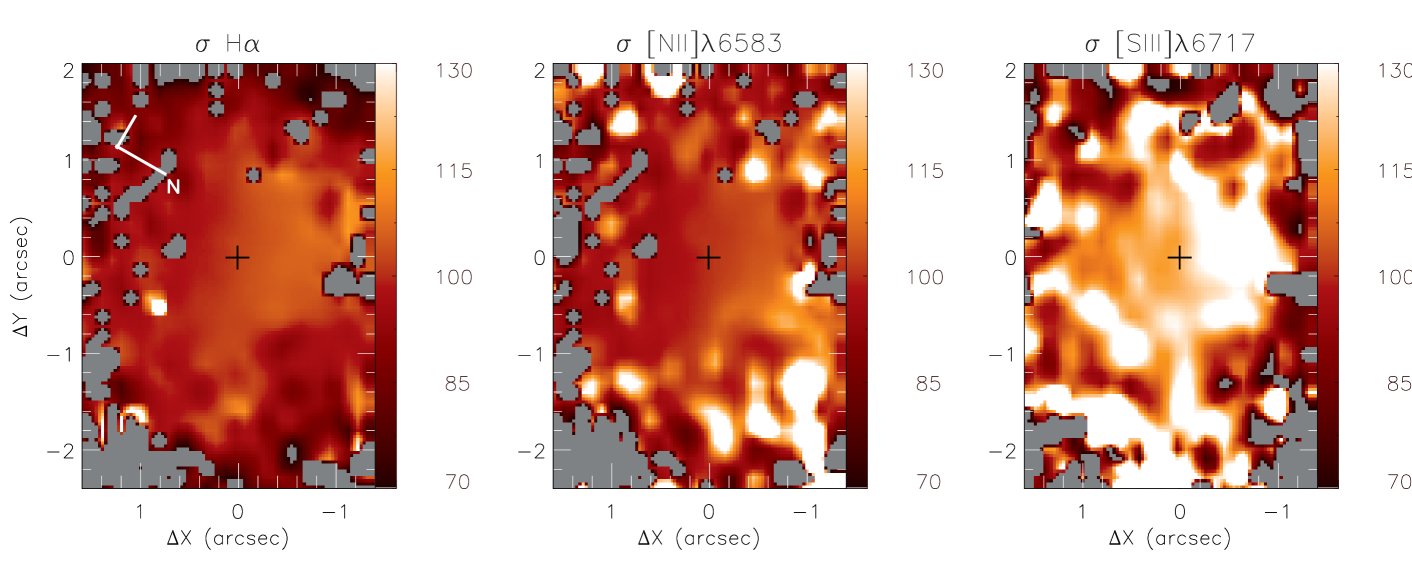
Figure 8 presents the line-of-sight velocity fields (top panels) and the velocity dispersion maps (bottom panels) for the H, [N ii]6583 and [S ii]6717 emission-lines. As the H, [O iii]5007 and [O i]6300 emission is seen only closer to the nucleus, and the measured kinematics is similar to that seen in the other lines showing more extended emission, we do not show the corresponding maps for these lines. The grey regions in all maps represent masked locations following the same criteria used for the flux maps, described in Sec. 3.3. The heliocentric systemic velocity of 8087 km s-1 was subtracted from the observed velocities. This value was derived by modeling of the Hα velocity field with a disc rotation model (see section 4.4).
The velocity fields for all emission-lines are similar, presenting blueshifts and redshifts of km s-1 to south and north, respectively. In addition, redshifts can be seen to the northeast at 2′′ from the nucleus, close to the border of the GMOS FoV (identified by a circle in the top-right panel of Fig. 8).
The velocity dispersion map for H presents values smaller than 100 km s-1 at most locations. The [N ii]6583 map presents some higher values of 130 km s-1 to the north and surrounding the nucleus, while the highest values are seen for the [S ii]6717 emitting gas, with values higher than 100 km s-1 observed at most locations.
4 Discussion
4.1 Merger stage
IRAS23199+0123 (Hekatelyne et al., 2018) and IRAS16399-0937 (Sales et al., 2015) show clear evidence of advance merger stage, as tidal tails seen in HST images. On the other hand, IRAS03056 appears to be an isolated barred spiral galaxy, as our HST images (Figs. 1 and 3) show no clear evidence of interaction.
Regarding the OH maser emission, IRAS23199+0123 and IRAS16399-0937 present =102.35 and =101.7 L⊙ respectively (Baan et al., 1998; Darling & Giovanelli, 2000). On the other hand, IRAS03056 shows a smaller luminosity =101.3 L⊙ (Baan et al., 2008), suggesting that objects at more advanced merger stages present stronger OH maser emission.
4.2 Gas excitation and BPT diagram
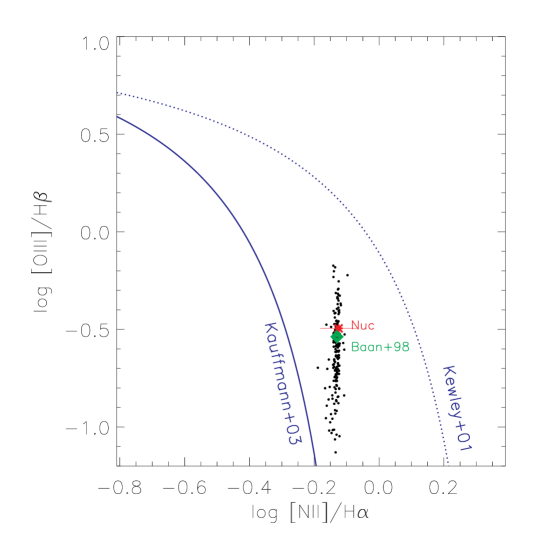
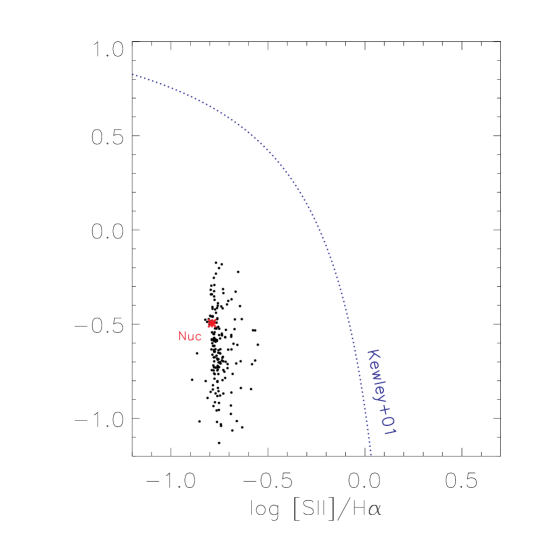
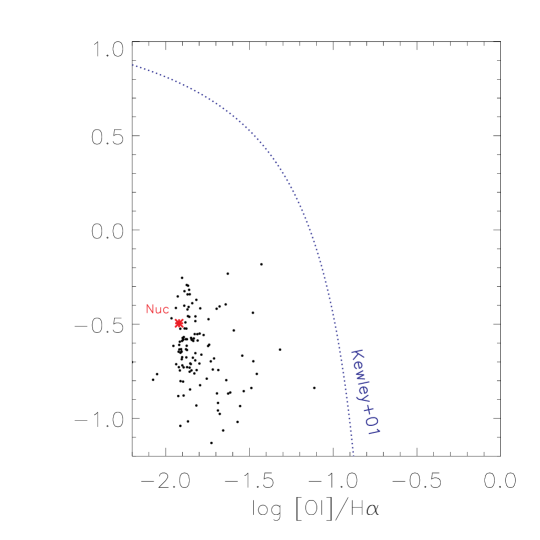
Baldwin, Phillips & Terlevich (1981) proposed three diagnostic diagrams using emission-line ratios that allow us to distinguish gas excitation by AGN or starburst activity. These BPT diagrams are based on the following four line ratios: [N ii]/H, [O iii]/H, [S ii]6717/H and [O i]6300/H. The advantage of the BPT diagrams is that emission lines of each ratio are close in wavelength and thus the extinction effects can be neglected.
Figure 9 presents the BPT diagrams for IRAS03056, where the x-axis show the [N ii]/H, [S ii]6717/H and [O i]6300/H respectively and the y-axis shows the [O iii]/H line ratios. The dotted curve corresponds to the line of Kewley et al. (2001) that delineates the region occupied by AGN (to the right and above the line), while the solid line represents the revised Kauffmann criteria that separates pure star-forming galaxies (to the left an below the line) from AGN-HII composite objects (Kauffmann et al., 2003). Points located between the solid and dotted lines represent regions that have contributions to the gas excitation from both AGN and Starbursts (Kewley et al., 2006). To construct the BPT diagrams shown in Fig. 9, we calculated the flux ratio for each spaxel, excluding flux measurements with uncertainties larger than 30 %.
The [N ii]/H vs. [O iii]/H diagnostic diagram (left panel of Fig. 9) shows all observed points in the region between the Kewley et al. (2001) and Kauffmann et al. (2003) lines, suggesting a contribution of both AGN and star-formation to the gas excitation. The other two diagrams show observed line ratios below the Kewley et al. (2001) criteria for all locations.
In Fig. 9, the red asterisk corresponds to the nuclear position of the galaxy, as obtained from the measurements of the emission-line ratios within a circular aperture of 05 radius. The green diamond corresponds to the line ratios measured by Baan et al. (1998), which are similar to our nuclear values. These authors performed optical classification of 42 galaxies using spectroscopic data obtained at the Palomar Observatory and classified the nucleus of IRAS03056+2034 as starburst. However, their spectra were obtained with a long-slit of width of 2′′ and extractions of 6′′, which corresponds to 1.12.8 kpc2 at IRAS03056 and thus includes a large fraction of circumnuclear emission. The GMOS angular resolution is about 3 times better than that provided by the aperture used by Baan et al. (1998).
Although we were able to map the [O iii]5007 emission only for the inner 1′′ region, we notice that the [O iii]5007/H vary with the distance from the nucleus, where the highest values are seen. On the other hand, the [N ii]/H line ratio values do not change. This behaviour can be interpreted as an increasing contribution of an AGN to the production of the high excitation [O iii] emission at the nucleus, which might be confirmed with higher resolution observations.
4.3 Star forming regions
The H flux map (Fig.5) suggests the presence of a ring of circumnuclear star forming regions located between 07 and 15 from the nucleus, as several unresolved knots of higher fluxes are seen at this location.
In order to characterize the star formation in the ring, we have extracted spectra from within a ring with inner radius of 07 and outer radius of 15 (identified as green circles in Fig.5).
Using the Hα/Hβ emission-line ratio and following Freitas et al. (2018), we obtained an extinction of A0.2 mag for the ring, which can be used to correct the observed line intensities. The H luminosity of the ring (corrected by reddening) is erg s-1, which can be used to estimate the mass of ionized gas, rate of ionizing photons and star formation rate of the ring.
In order to estimate the mass of ionized gas we used (e.g. Peterson, 1997):
| (1) |
where (H) is the H luminosity in units of 1041 erg s-1 and n3 is the electron density () in units of 103 cm-3.
Using the ratio between the fluxes of the [S ii] emission lines for the ring ([S ii] 6717/ 67310.8) we obtain an electron density cm-3, assuming an electron temperature K. This value is larger than those typically observed in star forming regions (Díaz et al., 2007; Dors et al., 2008).
The estimated mass of ionized gas is =7.5105 M⊙, which is similar to the values previously found for rings of circumnuclear star forming regions (e.g. Riffel et al., 2016, 2009; Hennig et al., 2018).
We estimated the rate of ionizing photons ([H+]) and star formation rate (SFR) under the assumption of a continuous star formation regime. We derived using Osterbrock (1989):
| (2) |
where is the hydrogen recombination coefficient to all energy levels above the ground level, is the effective recombination coefficient for H, is the Planck’s constant and is the frequency of the H emission line. Using =2.59 1013 cm3s-1 and =1.1710-17cm3s-1 (Osterbrock, 1989) we obtain:
| (3) |
The SFR was computed using the following relation (Kennicutt, 1998):
| (4) |
We found values of ionizing photons rate of Q[H+]53.8 and star formation rate of SFR=4.9 M⊙ yr-1, which are in agreement with previous reported values for circumnuclear star forming regions in nearby galaxies (e.g. Wold & Galliano, 2006; Galliano & Alloin, 2008; Dors et al., 2008; Riffel et al., 2009, 2016; Hekatelyne et al., 2018).
4.4 Gas kinematics
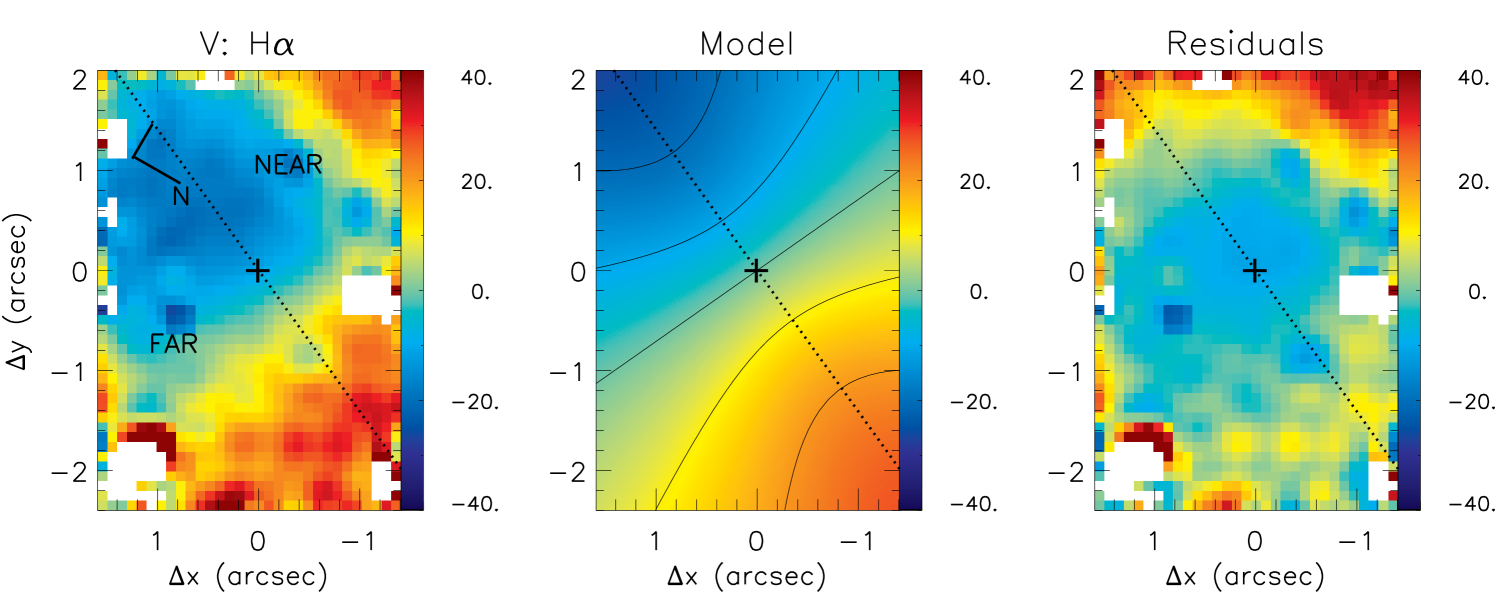
The gas velocity fields of IRAS03056 presented in Fig. 8 show a clear rotation pattern with blueshifts to the south and redshifts to the north of the nucleus. In order to model these kinematics, we used a simple rotation model (van der Kruit & Allen, 1978; Bertola et al., 1991), under the assumption that the gas moves in circular orbits in the plane of the galaxy, subjected to a central gravitational potential. In this model, the rotation velocity field is given by:
| (5) |
where and are the coordinates of each spaxel in the plane of the sky, is the systemic velocity of the galaxy, is the velocity amplitude, is the major axis position angle, is the disc inclination in relation to the plane of the sky ( for face-on disc), is a model fitting parameter (for p = 1 the rotation curve at large radii is asymptotically flat while for p = 3/2 the system has a finite mass) and is a concentration parameter, defined as the radius where the rotation curve reaches 70 % of the velocity amplitude.
The fit of this model provides information about the physical parameters of the system, such as the systemic velocity and orientation of the kinematic major axis. Moreover, the residual map (difference between the observed velocities and the model) allow us to detect deviations from pure rotation and identify non-circular motions.
We have chosen the velocity field of the Hα emission-line to perform the fit, as this is the brightest line at most locations. We used the IDL222
routine MPFITFUN Markwardt et al. (2009) in order to fit the observed velocity field with Eq. 5.
During the fit, we excluded the redshifted region to the east of the nucleus, which clearly does not follows the rotation pattern.
The resulting best fit model is shown in the central panel of Figure 10 and its parameters are km s-1, =8 08720 km s-1 (corrected to the heliocentric rest frame), =1562∘, =1904, 3∘. The obtained systemic velocity is about 140 km s-1 smaller than that quoted in NASA/IPAC Extragalactic Database (NED)333http://ned.ipac.caltech.edu. The value is consistent with the orientation of the apparent major axis of IRAS03056 as seen in the HST i-band image (Fig. 3), and is about 20∘ displaced from the value quoted in NED (135∘) as obtained from 2MASS KS photometry (Skrutskie et al., 2006). The disk inclination is consistent with the value shown in NED, obtained from the 2MASS photometry.
Figure 10 also presents the observed Hα velocity field in the left panel and residuals map in the right panel. The velocity field presents redshifts to the north and blueshifts to the south, which are well described by the rotating disk model, as indicated by the residual map, that shows values at most locations that are within -10 km s-1and +10 km s-1, except for a region to the east of the nucleus (close to the border of the GMOS FoV, identified as a circle in Fig. 8), whose kinematics is not reproduced by our model. At the same location, the HST H[N ii] narrow-band image (Figure 3) shows a strip of enhanced emission, which may be due to a patchy spiral arm.
Considering the observed velocity fields of Fig. 8 and the orientation of the spiral arms seen in the bottom-left panel of Fig. 3, we conclude that the northeast is the near side of the galaxy disk, while the southwest is the far side of the galaxy, under the assumption that the spiral arms seen is IRAS03056 are trailing. This assumption is supported by the fact that the vast majority of galaxies present spiral arms of the trailing type (e.g. Binney & Tremaine, 2008). Thus, the excess of redshifts seen to the east of the nucleus can be interpreted as being due to gas streaming motions along a nuclear spiral arm, under the assumption that the gas is located at the plane of the galaxy. Similar gas inflows along nuclear spiral arms have been previously observed in nearby active galaxies (e.g. Riffel et al., 2008; Riffel, Storchi-Bergmann, & Winge, 2013; Müller Sánchez et al., 2009; van de Ven & Fathi, 2010; Fathi et al., 2013; Schnorr-Muller et al., 2014b; Luo et al., 2016; Busch et al., 2017).
We can use these residual velocities observed along the nuclear spiral arm to estimate the mass inflow rate. Assuming that the gas is streaming towards the centre, we estimate the mass inflow rate as
| (6) |
where is the electron density, is the inflowing velocity, is the proton mass, is the area through which the gas is flowing and is the filling factor. One can estimate the filling factor using
| (7) |
where =3.53410-25 erg cm-3s-1 (Osterbrock, 1989) and is the Hα luminosity emitted by a region with volume .
We assume that the volume of the inflowing gas region can be approximated by that of a cylinder with radius and height . Thus we obtain
| (8) |
In order to obtain LHα and we measured the integrated flux of H and the [S ii] line ratio within the redshifted region seen in the residual map. The resulting H flux is , which corresponds to erg s-1 assuming the distance of 116 Mpc for IRAS03056. The mean [S ii] 6717/ 6731 ratio for the redshifted region is 0.88. Using the temden iraf task and adopting an electron temperature of =10 000K, we estimate cm-3.
To estimate the mass inflow rate, we assume kpc (18), as the distance between the nucleus of the galaxy and the redshifted region (center of the circle in Fig. 10), as measured directly from our maps. The mean inflow velocity is km s-1, measured from the residual map and corrected for the inclination of the disk (, as derived from the rotation model). The resulting mass inflow rate obtained from Eq. 8 is . The determination of the uncertainty in is not an easy task. Considering the derived uncertainties for and , we obtain and uncertainty of . he value derived for IRAS0356 is consistent with those of previous estimates of mass inflow rates in ionized gas for nearby Seyfert galaxies (e.g. Storchi-Bergmann et al., 2007; Schnorr-Muller et al., 2011, 2014b, 2017, 2017b; Riffel et al., 2014a; Müller Sánchez et al., 2009; van de Ven & Fathi, 2010).
As a speculation, we can estimate the dynamical time () it takes for the inflowing gas to move from 1 kpc (the adopted distance) to the nucleus. Assuming that the inflow has a constant velocity ( km s-1), we obtain yr, which is consistent with typical AGN lifetimes (e.g. Hopkins & Hernquist, 2006).
5 Conclusions
We have analyzed Gemini GMOS-IFU, VLA and HST data of the galaxy IRAS03056+2034, which is known to host a source of OH megamaser emission. The GMOS observations cover the inner 1.72.5 kpc2 at a spatial resolution of 506 pc and velocity resolution of 90 km s-1. Our main conclusions are:
-
•
The HST images reveal flocculent spiral arms, evidencing several knots of emission along them. Comparing the GMOS-IFU flux distributions with the [N ii]+Hα HST image we associate these knots with star forming regions located within a ring with inner radius of 337 pc and outer radius of 786 pc.
-
•
The 6 and 20-cm VLA image show compact radio emission at the nucleus of IRAS03056. No extended emission is observed.
-
•
Considering the Hα flux of the ring of circumnuclear star forming regions we derived that it has mass of ionized gas of 7.5105 , ionized photons rate of log =53.8, and star formation rate of 4.9 M⊙ yr-1.
-
•
Based on emission-line ratios, we conclude that the nucleus of IRAS0356 shows line ratios consistent with the presence of both an AGN and starburst activity.
-
•
The electron density derived from the [S ii] lines reaches values of up to 2200 cm-3 in the nucleus of the galaxy.
-
•
The gas velocity fields show a rotation pattern with the south side of the disk approaching and the north side receding. The observed projected velocity amplitude is 40 km s-1 and the kinematic major axis is oriented along . The gas kinematics is well reproduced by a disk rotating model, assuming circular orbits in the galaxy plane.
-
•
Besides the rotating disk component, the gas kinematics reveal also an excess of redshifts seen at 18 east of the nucleus with velocity of 45 km s-1. This component which is possibly associated with a patchy nuclear spiral arm seen in the HST image, is located at the far side of the galaxy, and can be interpreted as inflows towards the nucleus. In this case, we estimate an ionized gas mass inflow rate of M⊙ yr-1, which is similar to the inflow rate observed in nearby Seyfert galaxies.
Acknowledgements
We thank the referee for his/her suggestions that improved the paper. This work is based on observations obtained at the Gemini Observatory, which is operated by the Association of Universities for Research in Astronomy, Inc., under a cooperative agreement with the NSF on behalf of the Gemini partnership: the National Science Foundation (United States), the Science and Technology Facilities Council (United Kingdom), the National Research Council (Canada), CONICYT (Chile), the Australian Research Council (Australia), Ministério da Ciência e Tecnologia (Brazil) and south-eastCYT (Argentina). Support for program HST-SNAP 11604 was provided by NASA through a grant from the Space Telescope Science Institute, which is operated by the Association of Universities for Research in Astronomy, Inc., under NASA contract NAS 5-26555. This research has made use of the NASA/IPAC Extragalactic Database (NED) which is operated by the Jet Propulsion Laboratory, California Institute of Technology, under contract with the National Aeronautics and Space Administration. We acknowledge the usage of the HyperLeda database (http://leda.univ-lyon1.fr). C. H. thanks for CAPES financial support. RAR and DAS acknowledge support from CNPq and FAPERGS.
References
- Allington-Smith et al. (2002) Allington-Smith, J.et al. 2002, PASP, 114, 892.
- Baan et al. (1998) Baan, W. A., Salzer, J. J., LeWinter, R. D., 1998, ApJ, 509, 633.
- Baan et al. (2008) Baan, W. A., Henkel, C., Loenen, A. F., Baudry, A., & Wiklind, T. 2008, A&A, 477, 747
- Baldwin, Phillips & Terlevich (1981) Baldwin, J. A., Phillips, M. M., Terlevich, R., 1981, PASP, 93, 5.
- Bertola et al. (1991) Bertola, F., Bettoni, D., Danziger, J., Sadler, E., Sparke, L., de Zeeuw, T., 1991, ApJ, 373, 369
- Berton et al. (2018) Berton, M. et al., A&A, 2018, arXiv:1801.03519
- Binney & Tremaine (2008) Binney J., Tremaine S., 2008, Galactic Dynamics, 2nd edn. Princeton Univ. Press, Princeton, NJ.
- Bottinelli et al. (1990) L. Bottinelli, L. Gouguenheim, P. Fouqué, G. Paturel, 1990, A&A, 391, 488
- Brum et al. (2017) Brum, C., Riffel, R. A., Storchi-Bergmann, T., Robinson, A., Schnorr Muller, A., Lena, D., 2017, MNRAS, 469, 3405.
- Busch et al. (2017) Busch, G., Eckart, A., Valencia-S., M., Fazeli, N., Scharwächter, J., Combes, F., García-Burillo, S., 2017, A&A, 598, 55.
- Chen et al. (2007) Chen, P. S., Shan, H. G., Gao, Y., F., 2005, APJ, 133, 496
- Darling & Giovanelli (2000) Darling, J., Giovanelli, R. 2000, AJ, 119, 3003
- Darling & Giovanelli (2001) Darling, J., Giovanelli, R. 2001, AJ, 121, 1278
- Darling & Giovanelli (2002) Darling J., Giovanelli, R., APJ, 572, 810
- Darling & Giovanelli (2006) Darling J., 2006, Giovanelli, R., APJ, 132,2596
- Díaz et al. (2007) Díaz, Á. I., Terlevich, E., Castellanos, M., & Hägele, G. F. 2007, MNRAS, 382, 251.
- Dors et al. (2008) Dors O. L., Storchi-Bergmann T., Riffel R. A., Schmidt A. A., 2008, A&A, 482, 59
- Fathi et al. (2013) Fathi, K. et al., 2013, ApJ, 770, 27.
- Galliano & Alloin (2008) Galliano, E., & Alloin, D. 2008, A&A, 487, 519
- Haan et al. (2011) Haan, S. et al., 2011, ApJS, 197, 27.
- Hekatelyne et al. (2018) Hekatelyne, C., Riffel, R. A., Sales, D., Robinson, A., Gallimore, J., Storchi-Bergmann, T., Kharb, P., O’Dea, C., Baum, S., 2018, MNRAS, 474, 5319.
- Henkel et al. (1987) Henkel, C., Guesten, R., Baan, W. A. 1987, A&A, 185, 14
- Hennig et al. (2018) M. G. Hennig, Riffel, R. A., Dors O. L., Riffel, R., Storchi-Bergmann, T., Colina, L., 2018, MNRAS, tmp536
- Hook et al. (2004) Hook, I., Jorgensen, I., Allington-Smith, J. R., Davies, R. L., Metcalfe, N., Murowinski, R. G., Crampton, D., 2004, PASP, 116, 425
- Hoopes et al. (1999) Hoopes, C. G., Walterbos, R. A. M., & Rand, R. J. 1999, ApJ, 522, 669
- Hopkins & Hernquist (2006) Hopkins, P. F., Hernquist, L., 2006, ApJSS, 166, 1.
- Freitas et al. (2018) Freitas, I. C. et al., 2018, MNRAS, 476, 2760
- Kandalian (1996) Kandalian, R. A. 1996, Ap, 39, 237
- Kauffmann et al. (2003) Kauffmann, G. et al. 2003a, MNRAS, 346, 1055
- Kennicutt (1998) Kennicutt, R. C. 1998, ARA&A, 36, 189
- Kewley et al. (2001) Kewley, L. J., Dopita, M. A., Sutherland, R. S., Heisler, C. A., Trevena, J. 2001a, ApJ, 556, 121
- Kewley et al. (2006) Kewley, L. J, Groves, B, Kauffmann G., Heckman, T., 2016, MNRAS, 372
- Lena (2014) Lena, D., 2014, arXiv:1409.8264 2015, ApJ, 806, 84
- Lo (2005) Lo, K. Y., ARA&A, 2005, 43, 625
- Liu et al. (2015) Liu, L., Gao, Y., & Greve, T. R. 2015, ApJ, 805, 31
- Luo et al. (2016) Luo, R., Hao, L., Blanc, G. A., Jogee, S., van den Bosch, R. C. E., Weinzirl, T., 2016, ApJ, 823, 85.
- Markwardt et al. (2009) Markwardt C. B., 2009, in Bohlender D. A., Durand D., Dowler P., eds, ASP Conf. Ser. Vol. 411, Astronomical Data Analysis Software and Systems XVIII. Astron. Soc. Pac., San Francisco, p. 251
- McMullin et al. (2007) McMullin, J. P., Waters, B., Schiebel, D., Young, W., & Golap, K. 2007, Astronomical Data Analysis Software and Systems XVI, ASP Conf. Ser. 376, ed. R. A. Shaw, F. Hill, & D. J. Bell, San Francisco, CA: ASP, 127
- Müller Sánchez et al. (2009) Sánchez, F. M., Davies, R. I., Genzel, R., Tacconi, L. J., Eisenhauer, F., Hicks, E. K. S., Friedrich, S., & Sternberg, A., 2009, ApJ, 691, 749.
- Osterbrock (1989) Osterbrock, D. E., 1989, Astrophysics of Gaseous Nebulae and Active Galactic Nuclei, University Science Books, Mill Valley, California.
- Pacholczyk (1970) Pacholczyk A. G., 1970, Radio Astrophysics. Freeman, San Francisco
- Pearson & Readhead (1984) Pearson, T. J., & Readhead, A. C. S. 1984, ARAA, 22, 97
- Peterson (1997) Peterson B. M., 1997, An Introduction to Active Galactic Nuclei, Cambridge, New York Cambridge University Press
- Rau & Cornwell (2011) Rau, U. & Cornwell, T.J. 2011, AA, 532, 71
- Riffel et al. (2006) Riffel, R. A., Storchi-Bergmann, T., & Winge, C., Barbosa, F. K. B., 2006, MNRAS, 373, 2.
- Riffel et al. (2008) Riffel, R. A., Storchi-Bergmann, T., Winge, C., McGregor, P. J., Beck, T., Schmitt, H., 2008, MNRAS, 385, 1129.
- Riffel et al. (2009) Riffel, Rogemar A., Storchi-Bergmann, T., Dors, O. L., Winge, C., 2009, MNRAS, 393, 783
- Riffel et al. (2010) Riffel R. A., 2010, ApSS, 327, 239.
- Riffel, Storchi-Bergmann, & Winge (2013) Riffel, R. A., Storchi-Bergmann, T., Winge, C., 2013, MNRAS, 430, 2249.
- Riffel (2013) Riffel R. A., 2013, BAAA, 56, 13.
- Riffel et al. (2014a) Riffel, R. A., Storchi-Bergmann, T., & Riffel, R. 2014, MNRAS, 451, 3587.
- Riffel et al. (2014b) Riffel, R. A., Storchi-Bergmann, T., & Riffel, R. 2014, ApJL, 780, L24
- Riffel et al. (2015) Riffel, R. A., Storchi-Bergmann, T., & Riffel, R. 2015, MNRAS, 451, 3587
- Riffel et al. (2016) Riffel, Rogemar A., Colina, L., Storchi-Bergmann, T., Piqueras, L0́pez J., Arribas, S., Riffel, R., Pastoriza, M., Sales, Dinalva A., Dametto, N. Z., Labiano, A. & Davies, R. I., 2016, MNRAS, 461, 4192.
- Rossa & Dettmar (2000) Rossa, J., & Dettmar, R.-J. 2000, A&A, 359, 433
- Rossa & Dettmar (2003) Rossa, J., & Dettmar, R.-J. 2003, A&A, 406, 505
- Sales et al. (2015) Sales, D. A., Robinson, A., Axon, D. J., et al. 2015, ApJ, 799, 25
- Schnorr-Muller et al. (2011) Schnorr Muller A., Storchi-Bergmann T., Riffel R. A., Ferrari F., Steiner J. E., Axon D. J., Robinson A., 2011, MNRAS, 413, 149
- Schnorr-Muller et al. (2014b) Schnorr Muller A., Storchi-Bergmann T., Ferrari F., Nagas N. M., 2014b, MNRAS, 438, 3332
- Schnorr-Muller et al. (2017b) Schnorr Muller A., Storchi-Bergmann T., Ferrari F., Nagar N. M., Robinson, A., Lena, D., 2017, MNRAS
- Schnorr-Muller et al. (2017) Schnorr Muller A., Storchi-Bergmann T., Ferrari F., Nagar N. M., 2017, MNRAS, 466, 4370
- Schwab (1984) Schwab, F. R. 1984, AJ, 89, 1076-1081
- Skrutskie et al. (2006) Skrutskie, M., F. et al., 2006, AJ, 131, 1163.
- Storchi-Bergmann et al. (2007) Storchi-Bergmann, T., Dors, O. L. Jr., Riffel, R. A., Fathi, K., Axon, D. J., Robinson, A., Marconi, A., Ostlin, G., 2007, ApJ, 670, 959.
- Theureau et al. (2007) Theureau, G., Hanski, M. O., Coudreau, N., Hallet, N., Martin, J.-M., 2007, A&A, 465, 71.
- Tody (1986) Tody, D. 1986, The IRAF Data Reduction and Analysis System in Proc. SPIE Instrumentation in Astronomy VI, ed. D.L. Crawford, 627, 733
- Tody (1993) Tody, D. 1993, IRAF in the Nineties" in Astronomical Data Analysis Software and Systems II, A.S.P. Conference Ser., Vol 52, eds. R.J. Hanisch, R.J.V. Brissenden, J. Barnes, 173.
- Ulvestad et al. (2005) Ulvestad, J. S.; Antonucci, R. R. J.; Barvainis, R., 2005, ApJ, 621, 123.
- Vaucouleurs et al. (1991) de Vaucouleurs, G., de Vaucouleurs, A., Corwin JR., H.G., Buta, R. J. Paturel, G., Fouque, P. Third reference catalogue of bright galaxies, version 3.9
- van der Kruit & Allen (1978) van der Kruit, P.C., Allen, R.J., 1978, ARA&A, 16, 103
- van de Ven & Fathi (2010) van de Ven, G., & Fathi, K., 2010, ApJ, 723, 767.
- van Dokkum (2001) P. G. 2001, PASP, 113, 1420
- Wold & Galliano (2006) Wold, M., Galliano, E., 2006, MNRAS, 369, 47.
- Yuan, Kewley & Sanders (2010) Yuan, T.-T., Kewley, L. J., & Sanders, D. B. 2010, ApJ, 709, 884