X-ray total scattering study of regular and magic-size nanoclusters of cadmium sulphide
Abstract
Four kinds of magic-size CdS clusters and two different regular CdS quantum dots have been studied by x-ray total scattering technique and pair distribution function method. Results for the regular CdS quantum dots could be modelled as a mixed phase of atomic structures based on the two bulk crystalline phases, which is interpreted as representing the effects of stacking disorder. However, the results for the magic-size clusters were significantly different. On one hand, the short-range features in the pair distribution function reflect the bulk, indicating that these structures are based on the same tetrahedral coordination found in the bulk phases (and therefore excluding new types of structures such as cage-like arrangements of atoms). But on the other hand, the longer-range atomic structure clearly does not reflect the layer structures found in the bulk and the regular quantum dots. We compare the effects of two ligands, phenylacetic acid and oleic acid, showing that in two cases the ligand has little effect on the atomic structure of the magic-size nanocluster and in another it has a significant effect.
I introduction
Metal chalcogenide semiconductor nanoclusters, which form as quantum dots (QDs)Yin and Alivisatos (2005); Qin et al. (2014); Dolai et al. (2015), have been explored for applications in biomedical labelling Zhang et al. (2016), solar cells Dolai et al. (2015), light emitting diodes Dolai et al. (2015) etc. Typically QDs have their surfaces coated by ligands to passivate the surfaces Corsini et al. (2017), shape the QDsAlivisatos (1996), and protect the QDs from aggregation and corrosionTan et al. (2012). Moreover, these coatings can tune the optical properties Chen et al. (2011); Tohgha et al. (2013).
The quantum dots are found either as regular quantum dots (RQDs) or magic-size clusters Yu (2012) (MSCs), which are normally in the size range up to around 30 ÅDolai et al. (2015). MSCs contain a well-defined number of atoms Kudera et al. (2007) and thus a single size. The high stability of MSCs enables them to form so-called “cluster assembled materials”, providing a promising approach for the design of nano-devices Zhang et al. (2015).
The strong quantum confinement of electrons in quantum dots means they have size-dependent electrical, optical, magnetic and catalytic phenomenaGary et al. (2016); Tohgha et al. (2013), which cannot be realised by their bulk counterparts Kim et al. (2014). However, the effect of detailed atomic structure has been less well understood, and some important aspects for both CdS RQDs and MSCs are explored in this paper.
Our method of choice is x-ray total scattering methodMasadeh et al. (2007); Billinge and Levin (2007), which directly gives us real-space structural information through the pair distribution function (PDF), which is closely related to the histogram of interatomic distancesBillinge and Levin (2007). Standard methods such as transmission electron diffraction can give some information on size and shape, but this is tempered by the fact that there can be too low a contrast between the nanocluster cores and ligands Kim et al. (2014); Gary et al. (2015). In favourable circumstances it is possible to grow single crystals from self-aggregation of MSCsGary et al. (2016), but we do not have this good fortune for CdS. Thus total scattering is our preferred method here.
In this paper we report a number of new insights into the atomic-scale structure of the cores of CdS RQDs and MSCs. Comparison of PDFs from the bulk sample and RQDs, combined with structure fitting, gives a diameter for the RQDs and shows that the atomic structures of the RQDs are closely related to the layer structures of the bulk. On the other hand, our PDF measurements show that the atomic structures of the MSCs with two different ligands contain the same local tetrahedral coordination as in the bulk, but that neighbouring tetrahedra are connected without the layer arrangements of the bulk. An atomic model based on a recent crystal structure refinement for a self-assembled arrangement of InP MSC Gary et al. (2016) gives a model for one CdS MSC that reproduces well the data presented here. We will show that two other MSCs similarly have the same local structure but different longer-scale arrangements of atoms. The work presented here definitively excludes the possibilities that the MSCs have cage-like atomic structures. In the following sections we first discuss the methods we have used, then consider separately the new insights into the atomic-scale structures of the RQDs and MSCs.
II Methods
II.1 Sample synthesis and characterisation
II.1.1 Magic-size clusters
The single-size CdS MSCs with phenylacetic acid (PA) ligands were prepared using two-step approaches. The first step involved heating Cd and S precursors at a relatively high temperature, and the second step involved cooling the resulting mixture to a relatively low temperature and dispersing it into a solvent such as cyclohexane or tolueneZhu et al. (2017); Zhang et al. (ress); Liu et al. (2017); Zhu et al. (2018). The single-size CdS MSCs with oleic acid (OA) ligands were synthesised by a one-pot method Nevers et al. (2017, 2018). Details are given in the electronic supplementary information(ESI).
Each sample of CdS MSCs was characterised on the basis of their ultraviolet visible (UV-vis) absorption spectrum, and in this paper we follow standard practice and label different NCs on the basis of the wavelength of the peak in the absorption spectrum, with units of nm. The UV-Vis spectra of the four CdS MSC are given in Figure S1 of the ESI. These show sharp absorption peaks at 311 nm and 322 nm as seen in previous work.
The surface ligands were characterised by Fourier transform infrared spectroscopy (FTIR) as described in the ESI. We were able to confirm the presence of the PA and OA ligands in the NC sample.
II.1.2 Regular quantum dots
Two methods were used for the preparation of RQDs. The first, which led to a sample with UV-vis absorption peak at 355 nm (Figure S1 of the ESI), was prepared following the same method to generate the PA MSCs, but the heating in the second stage was at the higher temperature of 110 ∘C.
In the second method (author FSR) the RQDs were synthesised at a relatively low temperature from organo-metallic precursors in a weakly-coordinating solvent at ambient condition. Details about the synthetic method will be reported elsewhere. A new multi-step purification protocol for the effective removal of organic compounds was developed allowing the ‘interference-free’ characterisation of the inorganic nano-sized CdS core material. Details about the purification process are reserved due to a patent application being prepared. The RQD produced this way had an absorption peak at 439 nm (Figure S1).
II.2 Total scattering measurements and extraction of the pair distribution function
The x-ray total scattering measurements were performed on a PANalytical Empyrean diffractometer with a silver anode X-ray tube within the QMUL laboratory, with measurement times of 20 hours for scanning of scattering angle to . Samples were loaded into kapton tubes of diameter 1 mm. In addition to performing the measurement of the sample, separate measurements of the empty kapton tube and of the empty instrument were performed for data correction purposes. The sets of measurements were combined and converted using the GudrunX program Soper and Barney (2011), which generates an overall scattering function , where the scattering vector , with equal to half the scattering angle, and Å is the x-ray wavelength.
The conversion of the scattering data to the PDF was performed based on the following equations. Writing as the overall number of atoms per unit volume (number density), and as the density of atoms as type , we can express the number of atoms of type lying within a spherical shell of thickness at a distance from an atom of type as , where the partial PDF represents the difference of the distribution from random. The partial PDFs are combined as
| (1) |
where is the atomic scattering factor.
The Fourier transform of this function gives the experimentally-derived scattering function:
| (2) |
where , with being the measured function after corrections for sources of additional scattering and attenuation, and after normalisation. The component arises from the self-scattering term proportional to , and is scattering around . In turn, the function has the reverse transformation:
| (3) |
which is the key equation for converting the scattering data to the PDF.
Whilst there are many formulations of the PDF Keen (2001), the function is our function of choice for analysis, because it is the fundamental Fourier transform of the data. GudrunX Soper and Barney (2011) was used to convert the scattering function to , exploiting a number of features that can be used to remove the inevitable effects of noise albeit at the cost of a small broadening of the resultant PDF.
II.3 Lattice simulations
To support the experimental analysis we have performed calculations of the PDF using a special module within the General Utility Lattice Program (GULP) Gale and Rohl (2003), as described in reference Cope and Dove, 2007. The key point of this module is to calculate the widths of the Gaussian functions that describe the individual peaks in the PDF based on the underlying phonon frequencies and eigenvectors and a given temperature.
For these calculations, we used the simple force field model of Fan et al. Fan et al. (2014), who used interaction potential functions of the form
| (4) |
The first term describes the long-range Coulomb interactions. The second and the third terms are the Buckingham potential describing the repulsive and dispersion interactions. Parameter values of , and for Cd–Cd, Cd–S and S–S pairs were derived by Fan et al. Fan et al. (2014).
To simulate the final size of a nanoparticle, it is assumed that the nanoparticle has spherical shape and that the PDF of the bulk is modulated by the standard spherical envelop function Gamez-Mendoza et al. (2017); Gilbert (2008):
| (5) |
where is the diameter of the nanocluster, and for . This allows a simulated PDF to be compared with the results of the X-ray total scattering experimental data.
II.4 PDFgui modelling
We used PDFgui Farrow et al. (2007) to fit theoretical three-dimensional structures to the atomic PDF data. For nanocrystals this approach is based on representing the atomic structure on that of a bulk crystal structure, with thermal motion, and multiplied by an envelope function that simulates the finite length scale. Here the envelope function is that for a spherical nanoparticle as given by equation 5. In this case the diameter can be treated as a refineable variable, which gives a route to determine the nanoparticle size. Within the refinement the other parameters that are fitted include the lattice parameters, atomic positions and anisotropic atomic displacement parameters, parameters that describe correlated atomic motion, and parameters that model experimental factors that may affect the data.
III PDF studies of regular quantum dots of cadmium sulphide
III.1 Simulated PDFs
The value of simulating the PDF is that it gives a noise-free impression of the PDF in advance, enabling us to identify key features. In the present case, it allows us to identify the differences between CdS crystals in either the zinc blend (ZB, cubic space group ) or wurtzite (WT, hexagonal space group ) structures. The simulations of these two phases are compared in Figure 1. Although the first three peaks are identical, the PDFs are different after around 5 Å, with the WT PDF having some more pronounced features. For example, the WT PDF has a strong double peak at around 8 Å, the distance at which there is a clear dip in the PDF of the ZB phase, and a strong peak at around 11 Å where there is a much weaker peak in the PDF of the ZB phase.
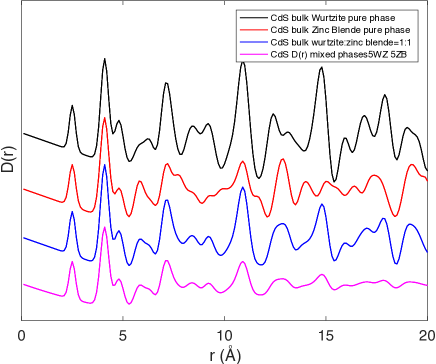
In Figure 1 we also show a PDF obtained as a 50:50 mixture of the PDFs of the two crystalline phases to resemble a disordered crystal, and finally we multiply this PDF by an envelop function (equation 5) with Å to simulate a disordered nanoparticle. In the nanoparticle the key signatures of the presence of the WT phase are the double peak at 8 Å and the strong feature at 11 Å. It can be seen that beyond this point the features in the PDF become weak and we are unable to discriminate the presence or otherwise of features of either phase.
The mixture of the PDFs of the two phases is a reasonably good description of a system with large disorder in the stacking sequence; a previous PDF study of RQDs of CdSe reported the existence of stacking disorder Masadeh et al. (2007). Both structures contain layers of tetrahedra in a hexagon arrangement. When stacked the layers are displaced laterally to give the bond connections between layers. There are three choices of lateral displacement which we denote as A, B and C. In the WT structure, the layers are stacked in sequence ABAB… along the hexagonal axis, whereas in ZB the stacking sequence is ABCABC… along the direction. If the stacking sequences in nanoparticles are disordered, we may get quite random sequences, providing nearest neighbours are different. If the start layer is A, the second must be B (C is equivalent, as it will be in each case when we relate to A), then the third layer can be A or C and this is picked up by the mixture of the WT and ZB phases respectively. Similarly the 4th layer may be A or B, and these are also picked up from the ZB and WT phases respectively. It is only when we come to the fifth layer that the mixture always has the A layer, but by the time we get to the fifth layer (distance 28 Å) we are now outside or near the diameter of the nanoparticle and thus this is not important. What this demonstrates is that by simulating either within a GULP model or in PDFfit using a mixture of two phases we can simulate random stacking sequences in the NCs to a reasonable extent.
III.2 Experimental data for regular quantum dots and the bulk phase
The total scattering functions measured for bulk CdS, RQD-439 and RQD-355 are shown in Figure S3. The CdS bulk has sharp peaks (although the diffractometer has a relatively low resolution because it has a short wavelength and is optimised for intensity), which are consistent with the hexagonal wurtzite crystal structure. On the other hand, the total scattering from the two CdS RQDs have broader peaks, and the fine detail fades on increasing .
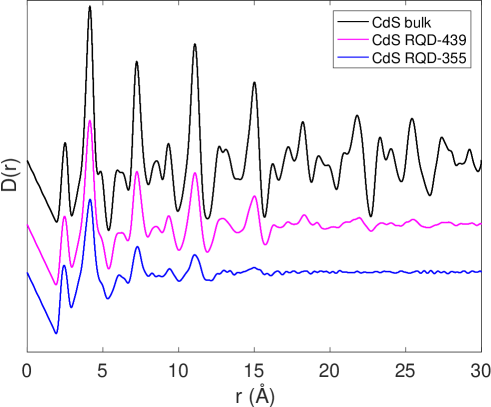
The PDFs of the RQDs are shown in Figure 2. The three functions show many similarities to each other, and in turn are very similar to the simulated PDFs shown in Figure 1. As discussed in Section III.1, there are characteristics within the PDF that can be identified with the WT and ZB phases, and in the case of the PDF of the bulk it can be seen by inspection to be dominated by features of the WT phase, consistent with the crystal structure analysis. The striking thing is the similarities between the PDFs of the RQDs and the bulk, not only in the first three peaks that define the local structure, but also across the full range of data up to the distance reflecting the effective diameter of the NCs. This implies that the atomic structures of the RQDs are very similar to that of the bulk, based on tetrahedral atomic coordination with stacking of layers as discussed in Section III.1. We also see clearly that the diameter of RQD-439 is larger than that of RQD-355, which is consistent with the longer wavelength of the UV-vis absorption peak Zhu et al. (2017); Yu and Liu (2009), as shown in Figure S1.
Although methods used to generate the PDF data in Figure 2 (as well as in later figures) have removed noise from the region 0–2 Å, we performed analysis where we retained the noise in this region. Specifically we checked carefully for peaks in the PDF at distances between 1.1–1.6 Å, which would correspond to C–C and C–O distances in the ligands. The noise in the data were below around 1 Å, and from this analysis we conclude that we are not seeing pair correlations from within the organic ligands in our experimental PDFs. This of course is not surprising given that peaks in the PDF are weighted by the products of atomic numbers, which are much larger for cadmium and sulphur. This is consistent with data published in reference Zhang et al., ress, and with a previous PDF study of CdSe Masadeh et al. (2007).
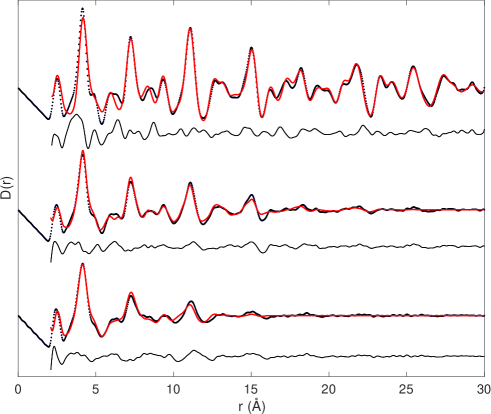
The three PDFs of Figure 2 were analysed using PDFguiFarrow et al. (2007), fitting the experimental PDFs with calculated functions based on a mixture of both WT and ZB structures, treating the phase fraction as a variable in the fitting process, together with the parameters of the crystal structures. In fact we tried fitting to single phases as shown in Figure S4, but in each case the quality of the fit was worse, indicated by comparing the fitted and experimental PDFs by eye, and quantified by the goodness-of-fit parameter as defined in reference Masadeh et al., 2007.
| Bulk | RQD-355 | RQD-439 | |
|---|---|---|---|
| % WT | 69.92(8) | 35(14) | 66(28) |
| ZB (Å) | 5.9164(9) | 5.92(9) | 5.92(8) |
| WT (Å) | 4.1889(6) | 4.1(3) | 4.18(6) |
| WT (Å) | 6.8217(9) | 6.8(5) | 6.9(1) |
| (Å) | — | 17(4) | 28(4) |
| 0.24 | 0.26 | 0.24 |
The experimental and fitted PDFs are compared in Figure 3, and values of the refined parameters are given in Table 1. The two RQDs have relatively small diameters as obtained in the fitting, Å for RQD-439 and Å for RQD-355. The refined values of the phase fractions are different in each case; however, it should be noted that these values have relatively large errors for the two nanoclusters, whereas there is a much smaller error for the bulk. We found that the refinement of the diameter of nanoparticle is highly correlated with other parameters such as anisotropic ADPs, phase factors, and correlated motion parameters Farrow et al. (2007). Thus the refinement result is not as robust as usually found for crystalline materials. In this case we can identify some possible reasons for this. First is that the differences between the PDFs of the two crystalline phases is not large at small , as we discussed in Section III.1, and may be smaller than the difference between the experimental and simulated PDFs at low . Second, the description of the PDF as that of a bulk with a shape function neglects effects at the edge, which is more important for smaller NCs. In particular, we are likely to have more Cd atoms at the edge relative to the bulk because of the coating with negatively-charged ligands. In turn this may lead to inconsistencies within the fitting, for example with the number of Cd–S neighbours being different than assumed by this representation of the NC structure. We also found that the values of the lattice parameters of two phases when fitted together can have large errors. To a large extent this can be understood through correlations with the peak width parameters. The lattice parameters are largely determined by the Cd–S distance and thus will lead to the same first two peaks in the PDF. A small divergence of the lattice parameters will broaden these peaks, which is the correlation we have noted. There are too few additional peaks to act as a constraint. The value of the NC diameter is determined by the high- data. However, at high the PDF is relatively small. In the refinement of the model structure, the least squares algorithm may pay more attention to the low- area because that is where the discrepancies between model and data are largest. These discrepancies are larger than the structure in the PDF at large , which means that the least-squares refinement can effectively “choose” to ignore the large- data. As a result, we end up with a relatively large error on the diameter.
IV PDF studies of magic-size clusters
IV.1 CdS MSC-311
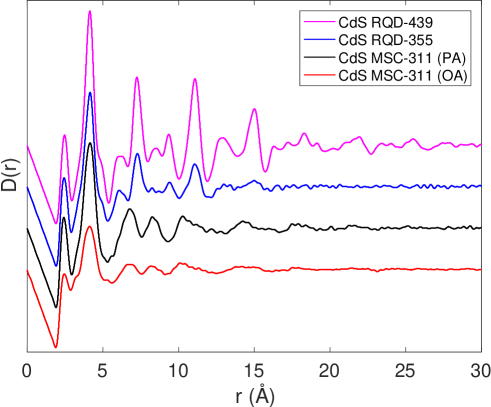
The PDFs of both OA MSC-311 and PA MSC-311 are shown in Figure 4, where they are compared to the PDFs of RQD-355 and RQD-439. The PDFs of both MSC-311 samples are very similar in terms of the positions, widths and relative heights across the full range of distances within the PDF, and also with respect to the decrease in the PDF amplitude on increasing distance. Our data in Figure 4 are also consistent with separate measurements for PA MSC-311 on different samples as reported in reference Zhang et al., ress, and, importantly, we have reproduced the PDFs from measurements on several different samples ourselves.
Up to 5 Å the PDFs of the MSCs and RQDs look very similar. This means that the local coordination of the atoms in the MSCs are very similar to those in the RQDs, both in terms of interatomic distances and numbers of neighbours. This effectively precludes the possibility that the atomic structure of these MSCs has the form of a shell reminiscent of C60 Hawkins et al. (1991), because the coordination number of atoms in a shell is 3 rather than 4 in the bulk, which the local atomic structures of the RQDs resemble.
Beyond 5 Å, the PDFs of MSC-311 and the RQDs look very different. For example, in the range of 5–9 Å, the CdS RQDs have four peaks in their PDFs, while the PDFs of the MSCs display two peaks only, and without any correspondence of peak position. It is clear therefore that CdS MSC-311 has a significantly different atomic structure from that of the RQDs beyond the first 2–3 neighbours.
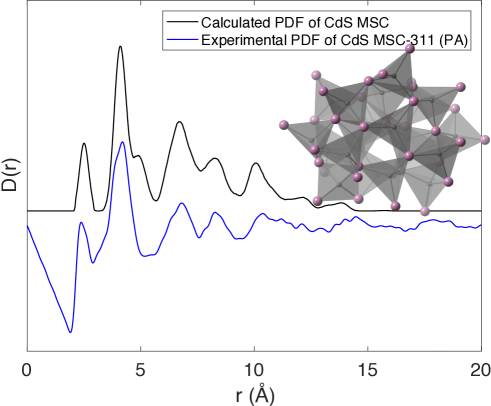
It is instructive to compare our results with the atomic structure of the single-crystal assemblage of InP MSCs Gary et al. (2016). This consists of corner-sharing PIn4 tetrahedra, and within the core each In atom has four P neighbours as in the bulk phases. The cluster has formula P20In37, with the excess of In cations being on the outside of the cluster to ensure that every P atom has tetrahedral environment. The In cations on the edge of the NC are available to bond to the negatively-charged ligands. Unlike in the bulk and RQDs, the PIn4 tetrahedra are not arranged in layers. Based on replacing the In and P atoms by Cd and S respectively (we did not need to change the interatomic distance), and neglecting the ligands since they are negligible in the x-ray total scattering data, we have calculated the histogram of interatomic distances. This is compared with the function for PA 311 in Figure 5, where the structure is shown as an inset to the figure. It is striking that the key features that differentiate the PDFs of MSC-311 and of the RQDs, namely the peaks after 5 Å, are reproduced by the InP structure. Thus we propose that the InP structure, with corner-sharing SCd4 tetrahedra arranged in a manner that is different from that of the bulk phases, is a good initial model for the structure of MSC-311. The mass of this cluster is 4800 Da, excluding any contribution from the ligands. The mass of CdS MSCs has been measured as 5160 Da.Zhang et al. (ress) The small difference (7.5 %) may be accounted for by addition of one S and three Cd atoms to the InP-based nanocluster.
We can see from Figure 4 that the decrease in the amplitudes of the features in the PDFs with increasing is between that of the two RQDs. This means that the effective diameter of MSC-311 is between those of RQD-355 (17 Å) and RQD-439 (28 Å). From comparison to the results for the RQDs given in Table 1, and noting that visually it appears that the diameter is closer to that of RQD-355 than RQD-439, we estimate a value of round Å for the diameter of MSC-311. This is larger than the largest Cd–Cd distance in a NC based on the InP structure (15.7 Å), which is consistent with our suggestion above that the MSC-311 may have slightly more atoms in the InP MSC.
It is also important before we consider MSC-322 to re-iterate that the PDF measurements have shown that the atomic structures of OA MSC-311 and PA MSC-311 have effectively identical atomic structure, in spite of the fact that they are coated with different ligands.
IV.2 CdS MSC-322
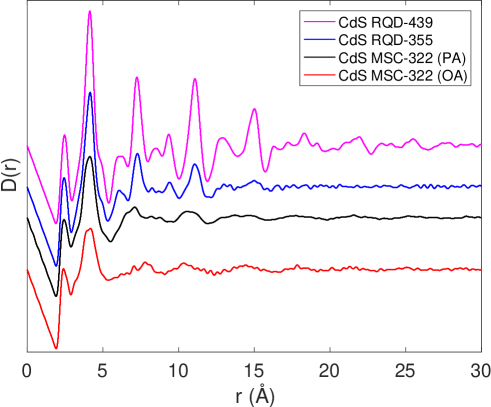
The PDFs of OA MSC-322 and PA MSC-322 are shown in Figure 6, and again they are compared with the PDFs of RQD-355 and RQD-439. Our data for PA MSC-322 presented here are consistent with the data for PA MSC-322 obtained by independent measurements on a different sample in reference Zhang et al., ress. We have reproduced the data for OA MSC-322 given in Figure 6 using three different samples.
As in the case of MSC-311, the PDFs of the MSC-322 samples are similar to those of the RQDs up to a distance of 5 , and by comparison with Figure 4 they also similar to the PDF of MSC-311 over this range of distances. Similar to MSC-311, the PDFs for both samples of MSC-322 are significantly different from the RQD PDFs for distances above 5 Å. What is particularly interesting in Figure 6 is the differences between the PDFs of OA MSC-322 and PA MSC-322 for distances between 5–9 Å. In particular, PA MSC-322 has a peak at 7 Å and OA MSC-322 has a peak at 8 Å. The case of PA MSC-322 is interesting because its PDF has many similarities with MSC-311, with the only significant difference being with regard to the peak at 8 Å in MSC-311.
V Discussion and conclusions
In this paper we have presented an X-ray total scattering study of various nanoclusters of CdS, focussing analysis on the PDFs derived from the scattering data. The results are sensitive primarily to the Cd and S ions, with the organic ligands showing no discernible features in the PDF. We have compared the PDFs of the nanoclusters with that for the bulk, and compared the PDFs of regular quantum dots with magic-size clusters. The results present an interesting contrast between regular and magic-size clusters.
Measurements on two CdS RQDs of different diameter have shown that their atomic structures are very similar to the atomic structures of the bulk phases, with disorder in the stacking of the layers found in the crystalline phases. We have obtained estimates of their effective diameter through fitting an atomic model to the PDF data assuming that the atomic structure is based on a disordered stacking sequence of the tetrahedral layers found in the two bulk phases, wurtzite and zinc blend, and that the effect of the finite sizes of the NCs can be represented by a multiplicative spherical shape function. We obtained diameter values of and Å.
Whilst the CdS RQDs have atomic structures that resemble the bulk phases of CdS, it is clear that the atomic structures of the MSCs are only similar over short distances. This implies that the atomic structures of the MSCs are based on the same tetrahedral arrangements of atoms, but that their longer-range structure departs from the layer structures of the bulk phases that are also found in the RQDs. This result excludes the possibility that the MSCs have qualitatively different types of atomic structures such as cage structures with equal numbers of cations and anionsKasuya et al. (2004); Tohgha et al. (2013); Nguyen et al. (2010). A recently published structure of the MSC of InP shows that it is possible to form structures consistent with this conclusion, and indeed the PDF from a model for CdS based on the InP structure shows remarkable agreement with the PDF for the MSC-311, particularly with regard to the features that are different in the PDFs of the RQDs. Thus we conclude that the MSCs have atomic structures that consist of arrangements of corner-sharing SCd4 tetrahedra that are dissimilar to the stacking within layers as seen in the bulk and RQDs, with Cd cations on the surface of the MSCs.
One interesting result is that MSC-311 has the same atomic structure with both PA and OA ligands as coatings, but that, by contrast, the atomic structure of MSC-322 appears to be different for the two ligands. The short-range structure of both types of MSC-322 is again similar to that of the RQDs and MSC-311, suggesting the same structural base of corner-sharing SCd4 tetrahedra, but the exact arrangement is different in the two cases albeit with a very similar band gap.
The challenge now is to use the PDF data to develop detailed models for the atomic structure of these MSCs. In the absence of single crystals we will need to use advance modelling techniques such as the Reverse Monte Carlo method; we are now tackling this challenging problem.
Acknowledgements.
LT and LF are grateful for financial support from the Chinese Scholarship Council and Queen Mary University of London.References
- Yin and Alivisatos (2005) Y. Yin and A. P. Alivisatos, Nature 437, 664 (2005).
- Qin et al. (2014) H. Qin, Y. Niu, R. Meng, X. Lin, R. Lai, W. Fang, and X. Peng, Journal of the American Chemical Society 136, 179 (2014).
- Dolai et al. (2015) S. Dolai, P. Dutta, B. B. Muhoberac, C. D. Irving, and R. Sardar, Chemistry of Materials 27, 1057 (2015).
- Zhang et al. (2016) Y. Zhang, O. Ersoy, A. Karatutlu, W. Little, and A. Sapelkin, Journal of Synchrotron Radiation 23, 253 (2016).
- Corsini et al. (2017) N. R. C. Corsini, N. D. M. Hine, P. D. Haynes, and C. Molteni, Nano Letters 17, 1042 (2017).
- Alivisatos (1996) A. P. Alivisatos, Science 271, 933 (1996).
- Tan et al. (2012) Y. Tan, S. Jin, and R. J. Hamers, The Journal of Physical Chemistry C 117, 313 (2012).
- Chen et al. (2011) O. Chen, Y. Yang, T. Wang, H. Wu, C. Niu, J. Yang, and Y. C. Cao, Journal of the American Chemical Society 133, 17504 (2011).
- Tohgha et al. (2013) U. Tohgha, K. K. Deol, A. G. Porter, S. G. Bartko, J. K. Choi, B. M. Leonard, K. Varga, J. Kubelka, G. Muller, and M. Balaz, ACS Nano 7, 11094 (2013), arXiv:NIHMS150003 .
- Yu (2012) K. Yu, Advanced Materials 24, 1123 (2012).
- Kudera et al. (2007) S. Kudera, M. Zanella, C. Giannini, A. Rizzo, Y. Li, G. Gigli, R. Cingolani, G. Ciccarella, W. Spahl, W. J. Parak, and L. Manna, Advanced Materials 19, 548 (2007).
- Zhang et al. (2015) J. Zhang, C. Rowland, Y. Liu, H. Xiong, S. Kwon, E. Shevchenko, R. D. Schaller, V. B. Prakapenka, S. Tkachev, and T. Rajh, Journal of the American Chemical Society 137, 742 (2015).
- Gary et al. (2016) D. C. Gary, S. E. Flowers, W. Kaminsky, A. Petrone, X. Li, and B. M. Cossairt, Journal of the American Chemical Society 138, 1 (2016).
- Kim et al. (2014) B. H. Kim, M. J. Hackett, J. Park, and T. Hyeon, Chemistry of Materials 26, 59 (2014).
- Masadeh et al. (2007) A. S. Masadeh, E. S. Božin, C. L. Farrow, G. Paglia, P. Juhas, S. J. L. Billinge, A. Karkamkar, and M. G. Kanatzidis, Physical Review B 76 (2007), 10.1103/physrevb.76.115413.
- Billinge and Levin (2007) S. J. L. Billinge and I. Levin, Science 316, 561 (2007).
- Gary et al. (2015) D. C. Gary, M. W. Terban, S. J. L. Billinge, and B. M. Cossairt, Chemistry of Materials 27, 1432 (2015).
- Zhu et al. (2017) T. Zhu, B. Zhang, J. Zhang, J. Lu, H. Fan, N. Rowell, J. A. Ripmeester, S. Han, and K. Yu, Chemistry of Materials 29, 5727 (2017).
- Zhang et al. (ress) B. Zhang, T. Zhu, M. Ou, N. Rowell, H. Fan, J. Han, L. Tan, M. T. Dove, Y. Ren, X. Zuo, S. Han, and K. Yu, Nature Communication (in press).
- Liu et al. (2017) M. Liu, K. Wang, L. Wang, S. Han, H. Fan, N. Rowell, J. A. Ripmeester, R. Renoud, F. Bian, J. Zeng, and K. Yu, Nature Communications 8, 15467 (2017).
- Zhu et al. (2018) D. Zhu, J. Hui, N. Rowell, Y. Liu, Q. Y. Chen, T. Steegemans, H. Fan, M. Zhang, and K. Yu, The Journal of Physical Chemistry Letters , 2818 (2018).
- Nevers et al. (2017) D. R. Nevers, C. B. Williamson, T. Hanrath, and R. D. Robinson, Chem. Commun. 53, 2866 (2017).
- Nevers et al. (2018) D. R. Nevers, C. B. Williamson, B. H. Savitzky, I. Hadar, U. Banin, L. F. Kourkoutis, T. Hanrath, and R. D. Robinson, Journal of the American Chemical Society 140, 3652 (2018).
- Soper and Barney (2011) A. K. Soper and E. R. Barney, Journal of Applied Crystallography 44, 714 (2011).
- Keen (2001) D. A. Keen, Journal of Applied Crystallography 34, 172 (2001).
- Gale and Rohl (2003) J. D. Gale and A. L. Rohl, Molecular Simulation 29, 291 (2003).
- Cope and Dove (2007) E. R. Cope and M. T. Dove, Journal of Applied Crystallography 40, 589 (2007).
- Fan et al. (2014) Z. Fan, R. S. Koster, S. Wang, C. Fang, A. O. Yalcin, F. D. Tichelaar, H. W. Zandbergen, M. A. van Huis, and T. J. H. Vlugt, The Journal of Chemical Physics 141, 244503 (2014).
- Gamez-Mendoza et al. (2017) L. Gamez-Mendoza, M. W. Terban, S. J. L. Billinge, and M. Martinez-Inesta, Journal of Applied Crystallography 50, 741 (2017).
- Gilbert (2008) B. Gilbert, Journal of Applied Crystallography 41, 554 (2008).
- Farrow et al. (2007) C. L. Farrow, P. Juhas, J. W. Liu, D. Bryndin, E. S. Boin, J. Bloch, T. Proffen, and S. J. Billinge, Journal of Physics Condensed Matter 19 (2007), 10.1088/0953-8984/19/33/335219.
- Yu and Liu (2009) Q. Yu and C. Y. Liu, Journal of Physical Chemistry C 113, 12766 (2009).
- Hawkins et al. (1991) J. M. Hawkins, A. Meyer, T. A. Lewis, S. Loren, and F. J. Hollander, Science 252, 312 (1991).
- Kasuya et al. (2004) A. Kasuya, R. Sivamohan, Y. A. Barnakov, I. M. Dmitruk, T. Nirasawa, V. R. Romanyuk, V. Kumar, S. V. Mamykin, K. Tohji, B. Jeyadevan, K. Shinoda, T. Kudo, O. Terasaki, Z. Liu, R. V. Belosludov, V. Sundararajan, and Y. Kawazoe, Nature Materials 3, 99 (2004).
- Nguyen et al. (2010) K. A. Nguyen, P. N. Day, and R. Pachter, The Journal of Physical Chemistry C 114, 16197 (2010).