The measurements of matter density perturbations amplitude
from cosmological data
Abstract
We compare various physically different measurements of linear matter density perturbation amplitude, , which are obtained from the observations of CMB anisotropy, galaxy cluster mass function, weak gravitation lensing, matter power spectrum and redshift space distortions. We show that measurement from CMB gravitational lensing signal based on Planck CMB temperature anisotropy data at high multipoles, , contradict to all other measurements obtained both from remaining Planck CMB anisotropy data and from other cosmological data, at about significance level. Therefore, these data currently should not be combined with other data to constrain cosmological parameters.
With the exception of Planck CMB temperature anisotropy data at high multipoles, all other measurements are in good agreement between each other and give the following measurements of linear density perturbation amplitude: , mean density of the Universe: , and Hubble constant: km s-1 Mpc-1. Taking in account the data on baryon acoustic oscillations and (or) direct measurements of the Hubble constant, one can obtain different constraints on sum of neutrino mass and number of relativistic species.
keywords:
cosmological parameters, matter density perturbation amplitude, mean density of the Universe, Hubble constant, sum of neutrino mass, number of relativistic species2018001[0]
May 4, 2018
1 Introduction
The measurements of cosmic microwave background (CMB) temperature and polarization obtained in Planck all-sky survey (Planck Collaboration I, 2016; Planck Collaboration XIII, 2016), constitute one of the basic cosmological datasets, currently used to constrain parameters of cosmological model. However, it is known that there is a number of tensions between cosmological parameters constraints, which are obtained from different subsets of Planck survey data as well from the data of some other cosmological measurements. These tensions were discussed previously in many papers (e.g., Addison et al., 2016; Planck Collaboration XI, 2016; Planck Collaboration XIII, 2016; Couchot et al., 2017; Planck Collaboration LI, 2017). For example, the constraints on the linear matter density perturbations amplitude perturbations obtained from measurements of galaxy cluster mass function (e.g., Vikhlinin et al., 2009a, b; Planck Collaboration XXIV, 2016), and also from weak lensing measurements (Heymans et al., 2013; Troxel et al., 2017; DES Collaboration, 2017), appears to be lower than the constraints obtained from CMB temperature anisotropy in Planck survey.
Below we compare various constraints on linear matter density perturbations amplitude, obtained using various observables and various cosmological data such as measurements of CMB anisotropy, galaxy cluster mass function, weak gravitation lensing, matter power spectrum and redshift space distortions. It is shown that the cosmological parameters constraints obtained using these heterogeneous data are in good agreement with each other, with the exception of the data on Planck CMB temperature anisotropy spectrum at high multipoles, . The cosmological parameters constraints, which can be obtained with no use of this part of Planck survey data, are studied in detail.
The calculations of the cosmological parameters constraints were carried out by Markov Chains Monte-Carlo (MCMC) simulations using CAMB (Lewis et al., 2000) and CosmoMC software (Lewis and Bridle, 2002; Lewis, 2013), version of November 2016. The CosmoMC software was modified to include the galaxy cluster mass function data from Vikhlinin et al. (2009a, b), the latest South Pole Telescope CMB polarization data (Henning et al., 2018), Dark Energy Survey weak lensing data (DES Collaboration, 2017), and the most recent baryon acoustic oscillations (BAO) data from Sloan Digital Sky Survey (Alam et al., 2017). In all MCMC simulations cosmological model was defined in the same way, as it was done in Planck Collaboration XIII (2016). In all figures below the contours at 68% and 95% confidence level are shown. All the numerical values of the confidence intervals are given at 68% confidence level, upper limits — at 95% confidence level.
2 Planck CMB anisotropy data
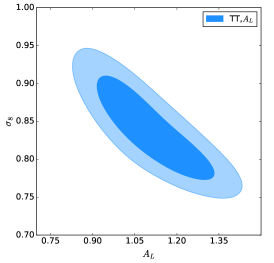
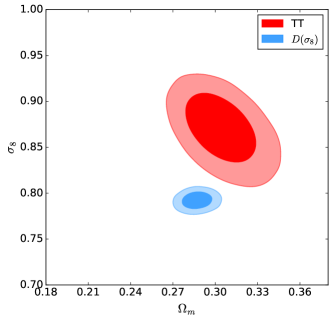
CMB anisotropy data allow to measure the density perturbation amplitude in several ways. The constraints on, — linear density perturbation amplitude at 8 Mpc scale, obtained from Planck CMB temperature anisotropy data (TT, Planck Collaboration XI, 2016; Planck Collaboration XIII, 2016), are shown in Fig. 1 with red contours. This constraint is obtained mainly from the measurement of the amplitude of CMB gravitation lensing on large scale structure. It can be easily shown, for example, as follows. If one thaw the phenomenological lensing amplitude (the coefficient by which the lensing potential, , is multiplied before the calculation of temperature anisotropy lensing is done, see, e.g., Planck Collaboration XIII 2016), it appears to be well correlated with density perturbation amplitude (see Fig. 1, left panel). For higher values of the data require to lower perturbations amplitude so that measured lensing amplitude of CMB temperature anisotropy is the same. The best constraint is obtained under the condition , when the measured lensing amplitude is directly converted into density perturbations amplitude.
The gravitational lensing of CMB temperature anisotropy on large scale structure is observed as smoothing of acoustic peaks at high multipoles, approximately at (see, e.g., Planck Collaboration XIII, 2016). If CMB temperature anisotropy spectrum is truncated at those high multipoles, only much weaker constraint can be obtained, as expected (see Fig. 1, right panel).
The exact position of the lower boundary of high multipole range in Planck CMB anisotropy spectrum, , is more or less arbitrary. It is justified by the fact that this value allow to select the region where the effect of gravitational lensing is most prominent, this value approximately corresponds to the minimum between third and fourth acoustic peaks, and also this number is a round one, i.e. this choice emphasize that no any adjustment of this value was made. Note, that similar definition of high multipole region in Planck CMB anisotropy spectrum was used in some other works (Addison et al., 2016; Henning et al., 2018), although with somewhat different justification.
Note that the constraints on lensing amplitude obtained from TT data only, allows both standard value and also higher values, (see Fig. 1, left panel). These data are typically used in combination with other data, e.g., with CMB polarization measurements at low multipoles, which produce lower value of perturbations amplitude (see below). This explains, why the higher values of were measured in some earlier works, which was fairly considered as anomaly (e.g., Planck Collaboration XIII, 2016; Planck Collaboration LI, 2017; Couchot et al., 2017).
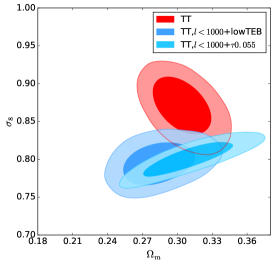
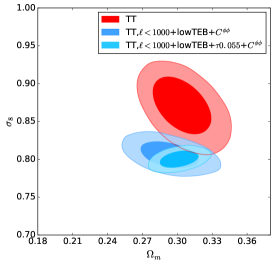
From the data on the CMB polarization at low multipoles one can obtain the constraint on reionization optical depth, , which allow to constrain density perturbation amplitude using the measurement of the CMB temperature anisotropy amplitude itself. In Planck 2015 data release the CMB polarization data obtained with Low Frequency Instrument (LFI) were published (Planck Collaboration VI, 2016; Planck Collaboration XIII, 2016), these data are included in Planck likelihood software (lowTEB). In addition, somewhat later CMB polarization data at low multipoles obtained with High Frequency Instrument (HFI) were published (Planck Collaboration XLVI, 2016; Planck Collaboration XLVII, 2016). The likelihood for these data (SimLow) is used below as a prior for reionization optical depth (Planck Collaboration XLVI, 2016).
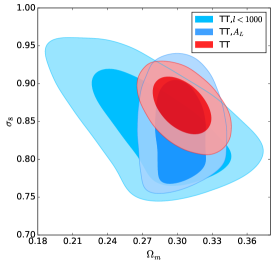
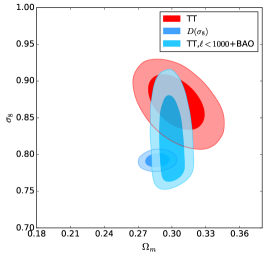
In order to do not mix the constrains from this and other individual dataset with the constraints from CMB temperature anisotropy spectrum at high multipoles discussed above, the calculations all of the constraints from individual datasets below are done in combination with Planck TT data at multipoles . Resulting constraints from Planck CMB polarization anisotropy data are presented in the left panel of Fig. 2. One can see the notable tension of these constraints with those from the complete Planck TT spectrum, where the constraint on is produced mainly by the data at high multipoles, as it was discussed above.
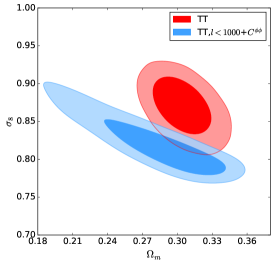
The density perturbations amplitude can also be constrained directly from the amplitude of observed lensing potential spectrum, , which can be recovered from four-point statistics (trispectrum) which was also done using Planck survey data (Planck Collaboration XV, 2016). The constrains on and , obtained with these data are shown in the middle panel of Fig. 2. These data are also in some tension with Planck TT data at high multipoles.
The and constraints obtained from the combined CMB polarization data at low multipoles and CMB lensing potential data are shown in the right panel of Fig. 2. These data, taken together, give the constraint , while Planck TT data give . Therefore, there is approximately tension between these datasets.
In fact, it is this tension in measurements of density perturbation amplitude is the source of well known anomaly in Planck survey data related to the observation of increased lensing amplitude , which was extensively discussed earlier (e.g., Planck Collaboration XIII, 2016; Planck Collaboration LI, 2017; Couchot et al., 2017). As it have been discussed above, higher value of allows to measure lower value of , which allow to reconcile the constraints presented in Fig. 2. From this figure one can also see that new Planck HFI data on CMB polarization at low multipoles should enhance this anomaly, which was also observed (Planck Collaboration XLVI, 2016).
Some of these internal tensions in Planck CMB data were noted and discussed in earlier works. The tensions between the parameters of CDM model obtained from CMB temperature anisotropy data at multipoles below and above were discussed by Addison et al. (2016). These tensions were also discussed in Planck Collaboration papers (XI, XIII, 2016; LI, 2017) where their significance was found to be not compelling enough. Recently Motloch and Hu (2018) found that these tensions can be detected in Planck CMB temperature spectrum at about 2.4 significance independently from the cosmological model and they are driven by smoothing of the acoustic peaks near multipoles –. This is in good agreement with the results discussed above, since it is this extra smoothing of acoustic peaks should be observed in result of the presence of extra gravitational lensing signal in Planck CMB temperature anisotropy spectrum.
3 Other measurements of density perturbation amplitude
3.1 South Pole Telescope CMB polarization anisotropy data
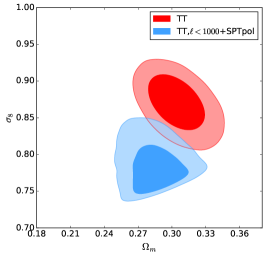
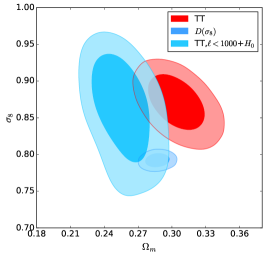
Gravitation lensing produce the smoothing of acoustic peaks not only in the spectrum of CMB temperature anisotropy, but also in CMB polarization spectrum. High sensitive measurements of CMB polarization anisotropy were obtained recently using the data of new SPTpol detector at South Pole Telescope (Henning et al., 2018). The constraints on mean matter density , and linear density perturbations amplitude, , in CDM model, obtained with these data are presented in Fig. 3, upper row, left panel.
These data constrain at notably lower values, as compared to Planck temperature anisotropy spectrum data (TT, red contours). This tension was discussed by SPTpol collaboration (Henning et al., 2018), who also note that it originates due to the SPTPol data at high multipoles, , while the data at lower multipoles, , are found to be in agreement with Planck survey data. We note, that SPTPol data both at low and high multipoles taken separately, produce only weak constraint on density perturbations amplitude. There is no good constraint from the data at since spectral index, , is poorly constrained with these data and is overestimated to the values of up to . More accurate measurement can be obtained only with SPTPol data at all multipoles, which are shown in Fig. 3 and are used below.
3.2 Galaxy clusters
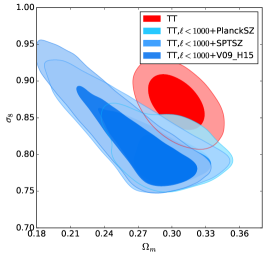
The measurements of galaxy clusters mass function give one of the most sensitive methods to constrain matter density perturbations amplitude. These measurements were obtained in many works, based on cluster samples selected in X-rays (e.g., Vikhlinin et al., 2009a, b; Mantz et al., 2015), optical (e.g., Rozo et al., 2010), and also using the observations of Sunyaev-Zeldovich effect (SZ, Sunyaev and Zeldovich, 1972) in microwave band (e.g., de Haan et al., 2016; Planck Collaboration XXIV, 2016).
All these measurements produce approximately similar results, since the accuracy of these measurements is limited by the uncertainty of the measurements of cluster masses and they are based on similar galaxy cluster mass scale calibrations. The main method to calibrate galaxy cluster mass scale is based on the observations of weak gravitational lensing in clusters, the results of these calibrations are more or less consistent among each other (e.g., Israel et al., 2014; Hoekstra et al., 2015; Smith et al., 2016; Applegate et al., 2016; Dietrich et al., 2017).
Fig. 3, upper row, right panel, shows the constraints on linear density perturbations amplitude, , obtained from the various galaxy cluster mass function datasets — the galaxy cluster data of Planck SZ survey (PlanckSZ, Planck Collaboration XXIV, 2016), South Pole Telescope (SPTSZ, de Haan et al., 2016), and also the data on clusters selected in X-rays from Vikhlinin et al. (2009a, b), see also Burenin, Vikhlinin (2012). In the last case the constraints were corrected on the basis of recent cluster mass scale calibrations (Hoekstra et al., 2015), and were taken in the form: (see details in Lyapin and Burenin, 2018).
Despite the fact that different samples of clusters of galaxies are used in the works cited above, these constraints can not be considered as completely independent ones, since very similar cluster mass scale calibrations are used. Therefore, in our work below we use only the constraints based on X-ray selected galaxy clusters sample from Vikhlinin et al. (2009a, b), taking in account new cluster mass scale calibrations (Lyapin and Burenin, 2018) — these data are referred to as V09_H15 below.
3.3 Weak gravitational lensing
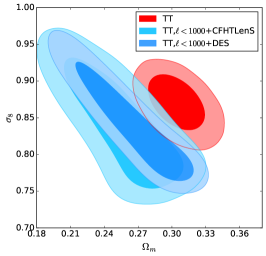
The measurements of weak gravitational lensing of distant galaxies in deep optical surveys allow to measure inhomogeneity of matter distribution that light passes, which in turn allow to obtain almost direct measurement of matter density perturbation amplitude. The left panel in the middle row of Fig. 3 shows the constraints from the data of Canada-France Hawaii Telescope Lensing Survey (CFHTLenS, Heymans et al., 2013), and also the constraints from the Dark Energy Survey first data release (DES, DES Collaboration, 2017).
3.4 Matter power spectrum and redshift space distortions
The data from large spectroscopic sky surveys allow to obtain the constraints on density perturbations amplitude from the matter power spectrum recovered from the measurements of galaxy power spectrum, and also studying the anisotropy of galaxies distribution in space with redshifts as radial coordinate, which occur due to peculiar motion of galaxies in disturbed gravitational field. Since these constraints are based on the same data, in many cases they are combined with each other and also with the constraints based on baryon acoustic oscillations (BAO), which are also measured with these data and which will be discussed below.
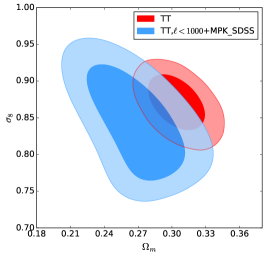
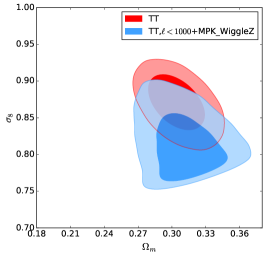
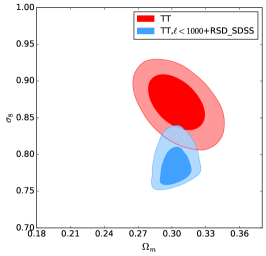
Right panel in middle row of Fig. 3 shows the constraints on density perturbations amplitude from the data on power spectrum of galaxies in SDSS 4-th data release (MPK_SDSS, Tegmark et al., 2006). In lower row of Fig. 3 the constraints from the measurements of power spectrum of galaxies in WiggleZ survey (left panel, MPK_WiggleZ, Blake et al., 2011; Parkinson et al., 2012), and also redshift space distortions measured in SDSS 12-th data release (right panel, RSD_SDSS, Alam et al., 2017) are shown. Note, that the constrains from two last datasets contain also the results of baryon acoustic oscillations measurements obtained from the same data.
3.5 Combined constraints
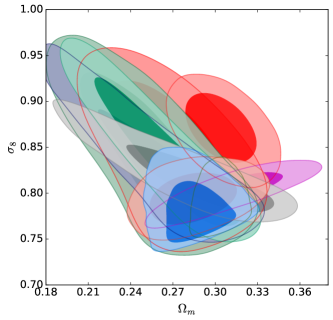
In the left panel of Fig. 4 all the constraints discussed above are shown. All these data are in good agreement with each other, with the exception of the data on Planck CMB temperature anisotropy spectrum at high multipoles, , which give significantly different and constraints. The combined constraints shown in the right panel of Fig. 4 are obtained as a combination of the following data:
-
•
Planck survey CMB temperature anisotropy spectrum at multipoles (TT,);
-
•
Planck LFI CMB polarization data at low multipoles, (lowTEB);
-
•
Planck HFI CMB polarization data at low multipoles, , used as a prior for reionization optical depth ();
-
•
Planck CMB gravitational lensing potential measurements ();
-
•
South Pole Telescope CMB polarization measurements (SPTpol);
-
•
galaxy cluster mass function measurements from X-ray selected clusters (V09_H15);
-
•
weak gravitational lensing of distant galaxies in Canada-France Hawaii Telescope Lensing Survey (CFHTLenS);
-
•
weak gravitational lensing of distant galaxies in Dark Energy Survey, first data release (DES);
-
•
luminous red galaxies power spectrum from Sloan Digital Sky Survey, data release 4 (MPK_SDSS).
The data on galaxies power spectrum in WiggleZ survey and the redshift space distortions data are not used here, because these data contain also the results of BAO measurements, which will be discussed below. In total, we use nine independent datasets, which are in good agreement among each other. The common characteristic of these datasets is that they produce direct constraints on matter density perturbations amplitude, as it is discussed above. Note, that almost all available data of that kind are used here, excluding the data on Planck CMB temperature anisotropy spectrum at high multipoles, . This combined dataset is referred as below.
| Parameter | value |
|---|---|
As it is shown in Fig. 4, the and constraints obtained with these data appears to be significantly different, as compared to the constraints from Planck CMB temperature anisotropy spectrum at high multipoles, , shown in Fig. 4 with red contours. The dataset give the constraint , while Planck TT data give . Therefore, the disagreement between these two datasets is significant at about level.
The observed significance corresponds to only one deviation of such amplitude in out of the order of 5000 realizations. In our case the number of independent trials can be estimated as the number of independent experiments, i.e. , and therefore this disagreement should be considered as a significant one. Since in our case one dataset (Planck TT spectrum at high multipoles) contradicts to many other independent measurements, most probably, it is these data which contains some unknown systematics. However, even if this disagreement were explained by statistical reasons only, one should discard significantly deviating data, since we are interested in statistically best possible estimates of the parameters. The real reasons of this disagreement should be studied further. However, already now it is clear that the combination of these data should not be used currently to constrain cosmological parameters.
The combined dataset consist of many different measurements of density perturbation amplitude, which are found to be in good agreement between each other. Therefore, the cosmological parameters constraints based on this dataset should be reliable and they are studied in detail below. The constraints on various cosmological parameters from combined dataset are presented in Table. 1. Note, that the accuracy of cosmological parameters determination appears to be comparable to that obtained from Planck 2015 data release in combination with external data (Planck Collaboration XXIV, 2016). However, best estimates of some parameters are shifted for about . For example, the best estimates of and parameters are shifted to lower values, while the best estimate of Hubble constant, , appears to be shifted high, as compared to Planck 2015 constraints. This is explained mostly by the fact, that the data on Planck TT spectrum at high multipoles, , are not used in dataset.
Note, that as compared to Planck constraints published earlier, the constraints from dataset are in much better agreement with the pre-Planck constraints, which were obtained from the combination of various cosmological data (Burenin, Vikhlinin, 2012; Burenin, 2013). The remaining differences between and measurements are explained by different galaxy cluster mass scale calibration and by using the additional constraint from direct Hubble constant measurements (Riess et al., 2011) in the earlier works cited above.
4 The measurements of distances and expansion rate of Universe
The data on baryon acoustic oscillations, type Ia supernovae and direct measurements of Hubble constant can not be used to obtain direct constraints on density perturbation amplitude. The constraints on mean matter density, , and linear density perturbations amplitude, , in CDM model from these data are shown in Fig. 5. The BAO data are taken from the measurements of luminous red galaxies power spectrum in SDSS 12-th data release (Alam et al., 2017), power spectrum of less distant galaxies measured with the data of SDSS 7-th data release (Ross et al., 2015), and also from the power spectrum of nearby galaxies measured in 6dF survey (Beutler et al., 2011). The direct Hubble constant measurement, , was taken from Riess et al. (2018), the supernova type Ia constraints are based on joint lightcurve analysis of supernovae from SDSS and SNLS samples (JLA, Betoule et al., 2014).
One can see that these data are in good agreement with both the data on Planck TT spectrum at high multipoles and with dataset. There is only a weak, approximately , tension with the direct Hubble constant measurement. The constraints from the dataset are located approximately in between the constraints from BAO and direct measurement of Hubble constant. The combination of these data gives different constraints on sum of neutrino mass and number of relativistic species, which are discussed in detail below.
5 Constraints on sum of neutrino mass and number of relativistic species
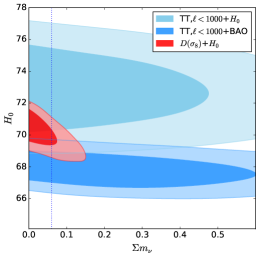
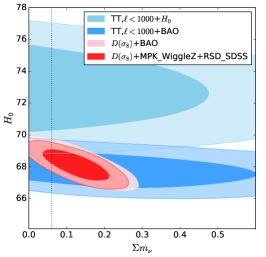
The constraints on sum of neutrino mass and Hubble constant from the BAO and direct data, and also from dataset in CDM+ model are shown in Fig. 6. Vertical dotted line show the value eV, which approximately corresponds to the minimum sum of neutrino mass from the observations of neutrino oscillations (e.g., Lesgourgues and Pastor, 2006). One can see, that constraints does not depend on sum of neutrino mass, as long as BAO and data are considered, as expected. The dataset also give rather good constraint on , but this constraint depends strongly on sum of neutrino mass. It can be shown that degeneracy is caused, eventually, by the suppression of density perturbation growth by massive neutrinos.
From Fig. 6 one can see that different combinations of datasets can give different constraints. So, for example, taken separately produce the constraint: eV, while in combination with direct measurements this same dataset gives: eV. Note, that in the last case the upper limit (at 95% confidence level) turns out to be close to the lower limit for sum of neutrino mass in the case of inverse mass hierarchy, eV (e.g., Lesgourgues and Pastor, 2006).
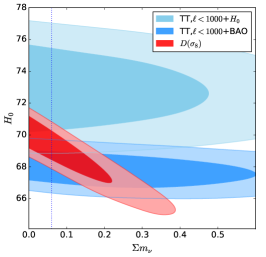
In combination with the BAO data the dataset give the measurement of non-zero sum of neutrino mass, at approximately significance: eV, the 95% upper limit in this case is eV. However, the measurement of Hubble constant based on BAO observations is known to be model dependent. This measurement is obtained using the sound horizon size as a standard ruler and therefore depends on the relativistic energy density in early Universe, which is usually parameterized through the effective number of relativistic species, . Therefore, if one add as a free parameter to cosmological model, one could reconcile all the data discussed above. The and constraints in that model, using all the cosmological data discussed above (+MPK_WiggleZ+RSD_SDSS+), are: eV and . These constraints are shown in Fig. 7.
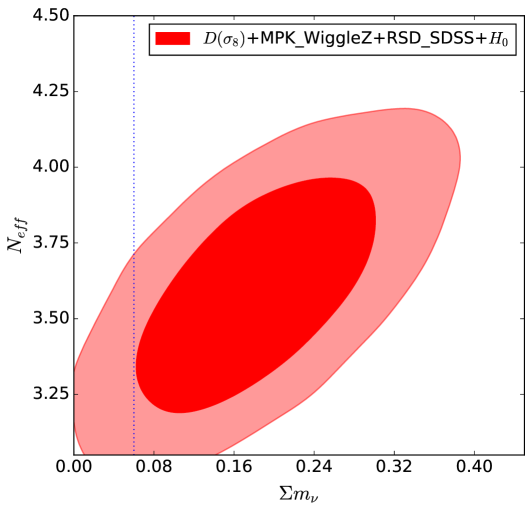
Similar measurements for non-zero sum of neutrino mass and larger than standard number of relativistic species were obtained earlier when the data on galaxy cluster mass function were combined with other cosmological data, before the publication of the first Planck survey results (Burenin, Vikhlinin, 2012; Burenin, 2013; Hou et al., 2014). These constraints, formally do not contradict to the constraints presented in Fig. 7, however, in the last case allowed region of parameter space turns out to be much smaller in its size and is shifted closer to the standard values of CDM model.
The remaining deviations of and from CDM standard values are driven by the remaining tensions between the direct measurements and BAO observations. If in future BAO would measure higher values of , consistent with current direct measurements, both and combined constraints will be consistent with CDM standard values. If instead direct measurements would produce lower values of , consistent with current BAO measurements, standard and non-zero will be measured with the combined data.
6 Discussion and conclusions
In this work various methods of density perturbations amplitude measurements, which use both Planck CMB anisotropy data and other cosmological data, are compared. We consider the measurements based on the CMB temperature and polarization anisotropy spectra, CMB lensing potential, galaxy cluster mass function, weak gravitational lensing of distant galaxies, matter power spectrum and redshift space distortions in spectroscopic surveys of galaxies. All these measurements were carried out in different experiments, are completely independent and have different systematic uncertainties.
It turns out that all these measurements are in good agreement with each other, with the exception of the data on Planck CMB temperature anisotropy spectrum at high multipoles, . This measurement contradict to all other constraints obtained both from remaining Planck CMB anisotropy data and from other cosmological data, at about significance level. The true explanation of this disagreement should be identified in a separate study. However, already now it is clear that the combination of these data should not be used currently to constrain cosmological parameters.
Since in our case one dataset (Planck TT spectrum at high multipoles, ) contradicts to large number of other independent measurements, it is in these data some unknown systematics may be contained. These data can not be compared to WMAP all sky survey data due to lower angular resolution of WMAP (Bennett et al., 2013). However, it can be shown that at larger angular scales, i.e. at multipoles about , CMB temperature anisotropy measurements made by Planck and WMAP are in good agreement (Huang et al., 2018).
The possibility of the presence of unknown systematical uncertainties in Planck survey temperature anisotropy data was studied through the comparison of these data with the temperature anisotropy data from South Pole Telescope (SPT, Aylor et al., 2017; Hou et al., 2018) and Atacama Cosmology Telescope (ACT, Louis et al., 2014, 2017). It was shown that there is a good agreement between these data inside the SPT and ACT footprints. SPT cosmological parameters constraints were compared to those from the combined Planck temperature and low- polarization all sky data and weak tensions between these datasets were found — somewhat higher value of and lower value of were measured by SPT (Aylor et al., 2017), in agreement with the results discussed in our work.
Various measurements of matter density perturbation amplitude, excluding Planck CMB temperature anisotropy data at high multipoles, , combined together, are denoted as dataset above. Since this dataset consist of many different measurements of density perturbation amplitude, which are found to be in good agreement between each other, the cosmological parameters constraints based on this dataset should be reliable and they are studied in detail.
The dataset produce the constraints with best estimates of some parameters shifted by about as compared to Planck 2015 constraints (Planck Collaboration XIII, 2016). For example, the constraints on and are shifted to lower values, but the Hubble constant constraint appears to be shifted high. Therefore, if Planck CMB temperature anisotropy spectrum data at high multipoles, , are excluded, the tension in constraints between Planck+BAO data and direct measurements (e.g., Planck Collaboration XXIV, 2016) is weaken, and the tension in measurements between Planck and large scale structure data (e.g., Planck Collaboration XXIV, 2016; Planck Collaboration XIII, 2016; Planck Collaboration LI, 2017) disappear completely. In addition, as it is shown above, the gravitational lensing amplitude anomaly observed in Planck CMB data also disappear.
The combined dataset give the Hubble constant measurement, which is located approximately in between the constraints from the BAO and direct measurements. From the different combination of these data one can obtain different constraints on sum of neutrino mass. All these data can be reconciled completely, if one assume non-zero sum of neutrino mass and larger than standard number of relativistic species.
Qualitatively, similar constraints were obtained earlier when the data on galaxy cluster mass function were combined with other cosmological data before the release of first Planck survey results (Burenin, Vikhlinin, 2012; Burenin, 2013; Hou et al., 2014). However, according to new constraints, allowed region of parameter space appears to be much smaller in size and shifted closer to the standard values of CDM model. The remaining deviations of and from CDM standard values are driven by the remaining tensions between the direct measurements and BAO observations.
Acknowledgements.
The work is supported by Russian Science Foundation grant 18-12-00520. This project was carried out using the computational resources of Spectrum-Roentgen-Gamma project data archive at IKI and also the resources of MVS-10P computer cluster at Joint Supercomputer Center of the Russian Academy of Sciences (JSCC RAS).References
- Addison et al. (2016)
- [2] 8181322016
- Alam et al. (2017)
- [4] 47026172017
- Applegate et al. (2016)
- [6] 45715222016
- Aylor et al. (2017)
- [8] 8501012017
- Bennett et al. (2013)
- [10] 208202013
- Betoule et al. (2014)
- [12] 568A222014
- Blake et al. (2011)
- [14] 41817072011
- Beutler et al. (2011)
- [16] 41630172011
- Burenin, Vikhlinin (2012)
- [18] 383952012 [\astl, 38, 347; arXiv:1202.2889]
- Burenin (2013)
- [20] 394032013 [\astl, 39, 357; arXiv:1301.4791]
- Couchot et al. (2017)
- [22] 597A1262017
- de Haan et al. (2016)
- [24] 832id.952016
- DES Collaboration (2017)
- [26] in press; arXiv:1708.01530
- Dietrich et al. (2017)
- [28] MNRAS, in press; arXiv:1711.05344
- Heymans et al. (2013)
- [30] 43224332013
- Henning et al. (2018)
- [32] 852972018
- Hoekstra et al. (2015)
- [34] 4496852015
- Hou et al. (2014)
- [36] 782742014
- Hou et al. (2018)
- [38] 85332018
- Huang et al. (2018)
- [40] in press; arXiv:1804.05428
- Israel et al. (2014)
- [42] 564A1292014
- Lesgourgues and Pastor (2006)
- [44] 4293072006
- Lewis et al. (2000)
- [46] 5384732000
- Lewis and Bridle (2002)
- [48] 661035112002
- Lewis (2013)
- [50] 871035292013
- Louis et al. (2014)
- [52] 070162014
- Louis et al. (2017)
- [54] 060312017
- Lyapin and Burenin (2018)
- [56] \pazh, 2018, in press
- Mantz et al. (2015)
- [58] 44622052015
- Motloch and Hu (2018)
- [60] in press; arXiv:1803.11526
- Parkinson et al. (2012)
- [62] 861035182012
- Planck Collaboration I (2016)
- [64] 594A12016
- Planck Collaboration VI (2016)
- [66] 594A62016
- Planck Collaboration XI (2016)
- [68] 594A112016
- Planck Collaboration XIII (2016)
- [70] 594A132016
- Planck Collaboration XV (2016)
- [72] 594A152016
- Planck Collaboration XXIV (2016)
- [74] 594A242016
- Planck Collaboration XLVI (2016)
- [76] 596A1072016
- Planck Collaboration XLVII (2016)
- [78] 596A1082016
- Planck Collaboration LI (2017)
- [80] 607A952017
- Riess et al. (2011)
- [82] 7321292011
- Riess et al. (2018)
- [84] 8551362018
- Rozo et al. (2010)
- [86] 7086452010
- Ross et al. (2015)
- [88] 4498352015
- Smith et al. (2016)
- [90] 456L742016
- Sunyaev and Zeldovich (1972)
- [92] Comments on Astrophysics and Space Physics, 4, 173 (1972)
- Tegmark et al. (2006)
- [94] 741235072006
- Troxel et al. (2017)
- [96] Phys. Rev. D, in press, arXiv:1708.01538
- Vikhlinin et al. (2009a)
- [98] 69210332009a
- Vikhlinin et al. (2009b)
- [100] 69210602009b