Quantum Technology Lab, Dipartimento di Fisica “Aldo Pontremoli”,
Università degli Studi di Milano, via Celoria 16, I-20133 Milano, Italy
INFN, Sezione di Milano, via Celoria 16, I-20133 Milano, Italy
High-precision innovative sensing
with continuous-variable optical states
Abstract
When applied to practical problems, the very laws of quantum mechanics can provide a unique resource to beat the limits imposed by classical physics: this is the case of quantum metrology and high-precision sensing. Here we review the main results obtained in the recent years at the Quantum Technology Lab of the Department of Physics “Aldo Pontremoli” of the University of Milan, also in collaboration with national and international institutions. In particular we focus on the application of continuous-variable optical quantum states and operations to improve different field of research, ranging from interferometry to more fundamental problems, such as the testing of quantum gravity.
1 Introduction
Quantum states of the radiation field represent a key ingredient to beat the limits imposed by classical light. The possibility to generate and manipulate single-photon states [kwiat, cialdi:manip] has made possible the implementation of protocols beyond the possibility of classical physical systems, paving the way to quantum cryptography [QKD:1], quantum communication [COMM:1], quantum enhanced sensing and metrology [QM, multipar:18] and the study of complex problems as, for instance, the boson sampling [boson:sci, boson:walm]. When single photons are considered, the information is usually encoded into observables with a discrete spectrum, such as the polarisation degree of freedom. Unfortunately, the information encoded in single photon states may be completely destroyed by the presence of losses: once the photon is lost, the carried information cannot be retrieved, though one can resort to schemes more tolerant to dissipation [din:14].
Therefore, many efforts have been made to extend discrete-variable quantum information protocols to the continuous-variable analogue, where the information is now encoded into observables with continuous spectrum (but not only), such as the amplitude or the phase of the field [rev:gauss, rev:QI]. Continuous-variable optical states are usually more robust to losses with respect to the single photons [fading:12, pino:15], since they may contain mesoscopic [ale:13] or macroscopic number of photons [use:15, silb:02].
In this scenario, optical correlations, both quantum and classical, represent a fundamental resource for developing technologies, opening unprecedented opportunities in the fields of metrology, positioning, imaging and sensing. Furthermore, the correlations existing between two or more [tri:olipa] light beams have also a theoretical interest, being of key relevance in quantum optics and quantum electrodynamics and are at the basis of the quantum information processing.
In this paper we are going to summarise some of the main theoretical and experimental results we achieved at the Quantum Technology Lab of the Department of Physics “Aldo Pontremoli” of University of Milan also in collaboration with national and international teams. We will focus on our research on optical continuous-variable states and their application to interferometry, imaging and also to test more fundamental theories, such as the noncommutativity of position and momentum at the Planck scale.
The structure of the paper is as follows. Section 2 introduces the basic tools of the estimation and quantum estimation theory and, in particular, the role of the Fisher and quantum Fisher information.
In section 3 we will see how it is possible to enhance the sensitivity of an interferometer exploiting the quantum features of light. We present the main results we obtained when continuous-variable states, such as coherent and squeezed states of the optical field, are used to feed the interferometers: this will be the subject of section 4, where we will study the bound imposed by quantum mechanics to the precision of an interferometer when only continuous-variable optical states are considered.
Quantum correlations can be exploited to improve the detection. In section 5 we present the first realisation of a practical quantum illumination protocol. It is a scheme to detect the presence of a faint object embedded in a noisy background, exploiting the quantum correlation existing between two light beams.
The possibility to enhance the sensitivity of optical interferometers by using setups based on two interferometers instead of a single one, is discussed in sections 6, 7 and 8. In section 7 we show how two correlated interferometers can be used to test quantum gravity and, more precisely, the noncommutativity of position and momentum at the Planck scale, outperforming schemes based on classical light. Section 8 investigates the role of a nonclassical resource, such as squeezing, to improve the performance of correlated interferometry. Finally, we draw some concluding remarks in section LABEL:s:outro.
Throughout the manuscript we will use many concepts from quantum optics. The interested reader can find a brief review of these basic notions in dedicated appendices.
2 Basics of quantum estimation theory
In this section we introduce the basic tools of estimation theory and quantum estimation theory which we will use throughout this paper. In particular, we will introduce the concepts of Fisher information and of quantum Fisher information.
When a physical parameter is not directly accessible, one needs to resort to indirect measurements. This is the case, for instance, of the measurement of a phase shift, of the entropy or of the entanglement between two or more parties of a quantum system. Here we focus on the single parameter estimation but our results can be extended to scenarios involving more than one parameter [paris:rev].

In fig. 1 we sketch a typical setup to estimate one parameter, say , through a quantum probe. In a quantum estimation protocol, a quantum probe is prepared in a known state described by the density operator . Then the probe interacts with a system, the interaction being described by the unitary operator . The evolved state of the probe, , encodes the unknown parameter and, then, undergoes a measurement described in general by the positive-operator valued measure (POVM) , being the measurement outcome. The data sample is finally processed to retrieve the value of the parameter by means of a suitable estimator . Of course, we are not only interested in the expectation value of , but also in its uncertainty . Therefore, the main goals of quantum estimation theory are to find the optimal probes which minimise the uncertainty and the optimal measurements which allow to reach such minimum uncertainty.
From the classical point of view, optimal unbiased estimators saturate the Cramér-Rao inequality or bound [helstrom]:
| (1) |
and we introduced the Fisher information:
| (2) |
being the conditional probability of the outcome given .
In the presence of a quantum probe and of a POVM, the conditional probability reads:
| (3) |
and, thus, the Fisher information can be written as (to be more general, we assume that ):
{eqnletter}
F(ϕ) &= ∫_ΩTr[∂ϕϱϕΠx]2Tr[ϱϕΠx] dx ,
= ∫_Ωℜe{Tr[ϱϕΠxLϕ]}2Tr[ϱϕΠx] dx ,
where is the symmetric logarithmic derivative such that
| (4) |
We can now maximise over all the possible POVMs to obtain the quantum Cramér-Rao bound [QCR:94, QCR:96]:
| (5) |
where is the quantum Fisher information [helstrom, QFI]. According to its definition, the eigenvectors of the symmetric logarithmic derivative correspond to the optimal POVM.
Looking for the analytical expression of the POVM and the optimal measurement is not always a simple task, since it requires an optimisation procedure. However, there are many cases in which it is possible to find some explicit relations.
In the simplest scenario the parameter to be estimated is the amplitude of a unitary perturbation applied to the probe state . This is the case, for instance, of a phase shift imposed to an optical field. If is the Hermitian generator of the perturbation, we can write . Now, expanding the input state in its eigenbasis, namely:
| (6) |
we obtain , with . It is straightforward to show that [paris:rev]:
| (7) |
and it is independent of . Moreover, if the input state is a pure state,
i.e. , eq. (7) reduces to:
{eqnletter}
H &=
4 ( ⟨ψ_0 — G^2 — ψ_0 ⟩- ⟨ψ_0 — G — ψ_0 ⟩^2 ) ,
= 4 var[G] ,
namely, the quantum Fisher information is proportional to the fluctuations of the generator
on the probe state.
In section 3 we will apply these results to find the ultimate bounds to interferometric sensitivity. The interested reader can find in refs. [paris:rev] and [datta:rev] further details about the application of quantum estimation theory to more general scenarios of interest for quantum information processing. In particular, at our Quantum Technology Lab we applied the tools of quantum estimation to quantum optics [brunelli:12, bina:dike, rossi:17], to open quantum systems [geno:phase, geno:phase:exp, bina:env] and to more fundamental problems [tama:16, rossi:16, seveso:17], just to cite some of the relevant fields of research we investigated in the last years.
3 Quantum interferometry with continuous-variable states
In this section we introduce the reader to optical quantum interferometry using the sensitivity of a typical interferometer and its connection with the Fisher information. The application of quantum estimation theory to find the ultimate bounds given by the quantum Fisher information and the analysis of more sophisticated setups, involving also active elements, will be discussed in section 4.
An optical interferometer is a paradigmatic example of one of the most precise devices available in physics. Its applications range from technological ones, to the challenging task of modern cosmology, i.e. the direct detection of gravitational waves, and also to measure Planck-scale effects predicted by quantum gravity theories. An interferometer should maximise the precision in the estimation of phase-shift fluctuations given some energy constraints on the energy circulating in the interferometer itself. To this aim one can exploit the nonclassical features of the probe beams which may outperform the performance of the corresponding classical ones, thus leaving room for quantum enhanced interferometry. However, the fluctuations associated with the very quantum nature of light pose bounds to the precision, which can be assessed by the modern tools of quantum estimation theory briefly introduced in section 2.
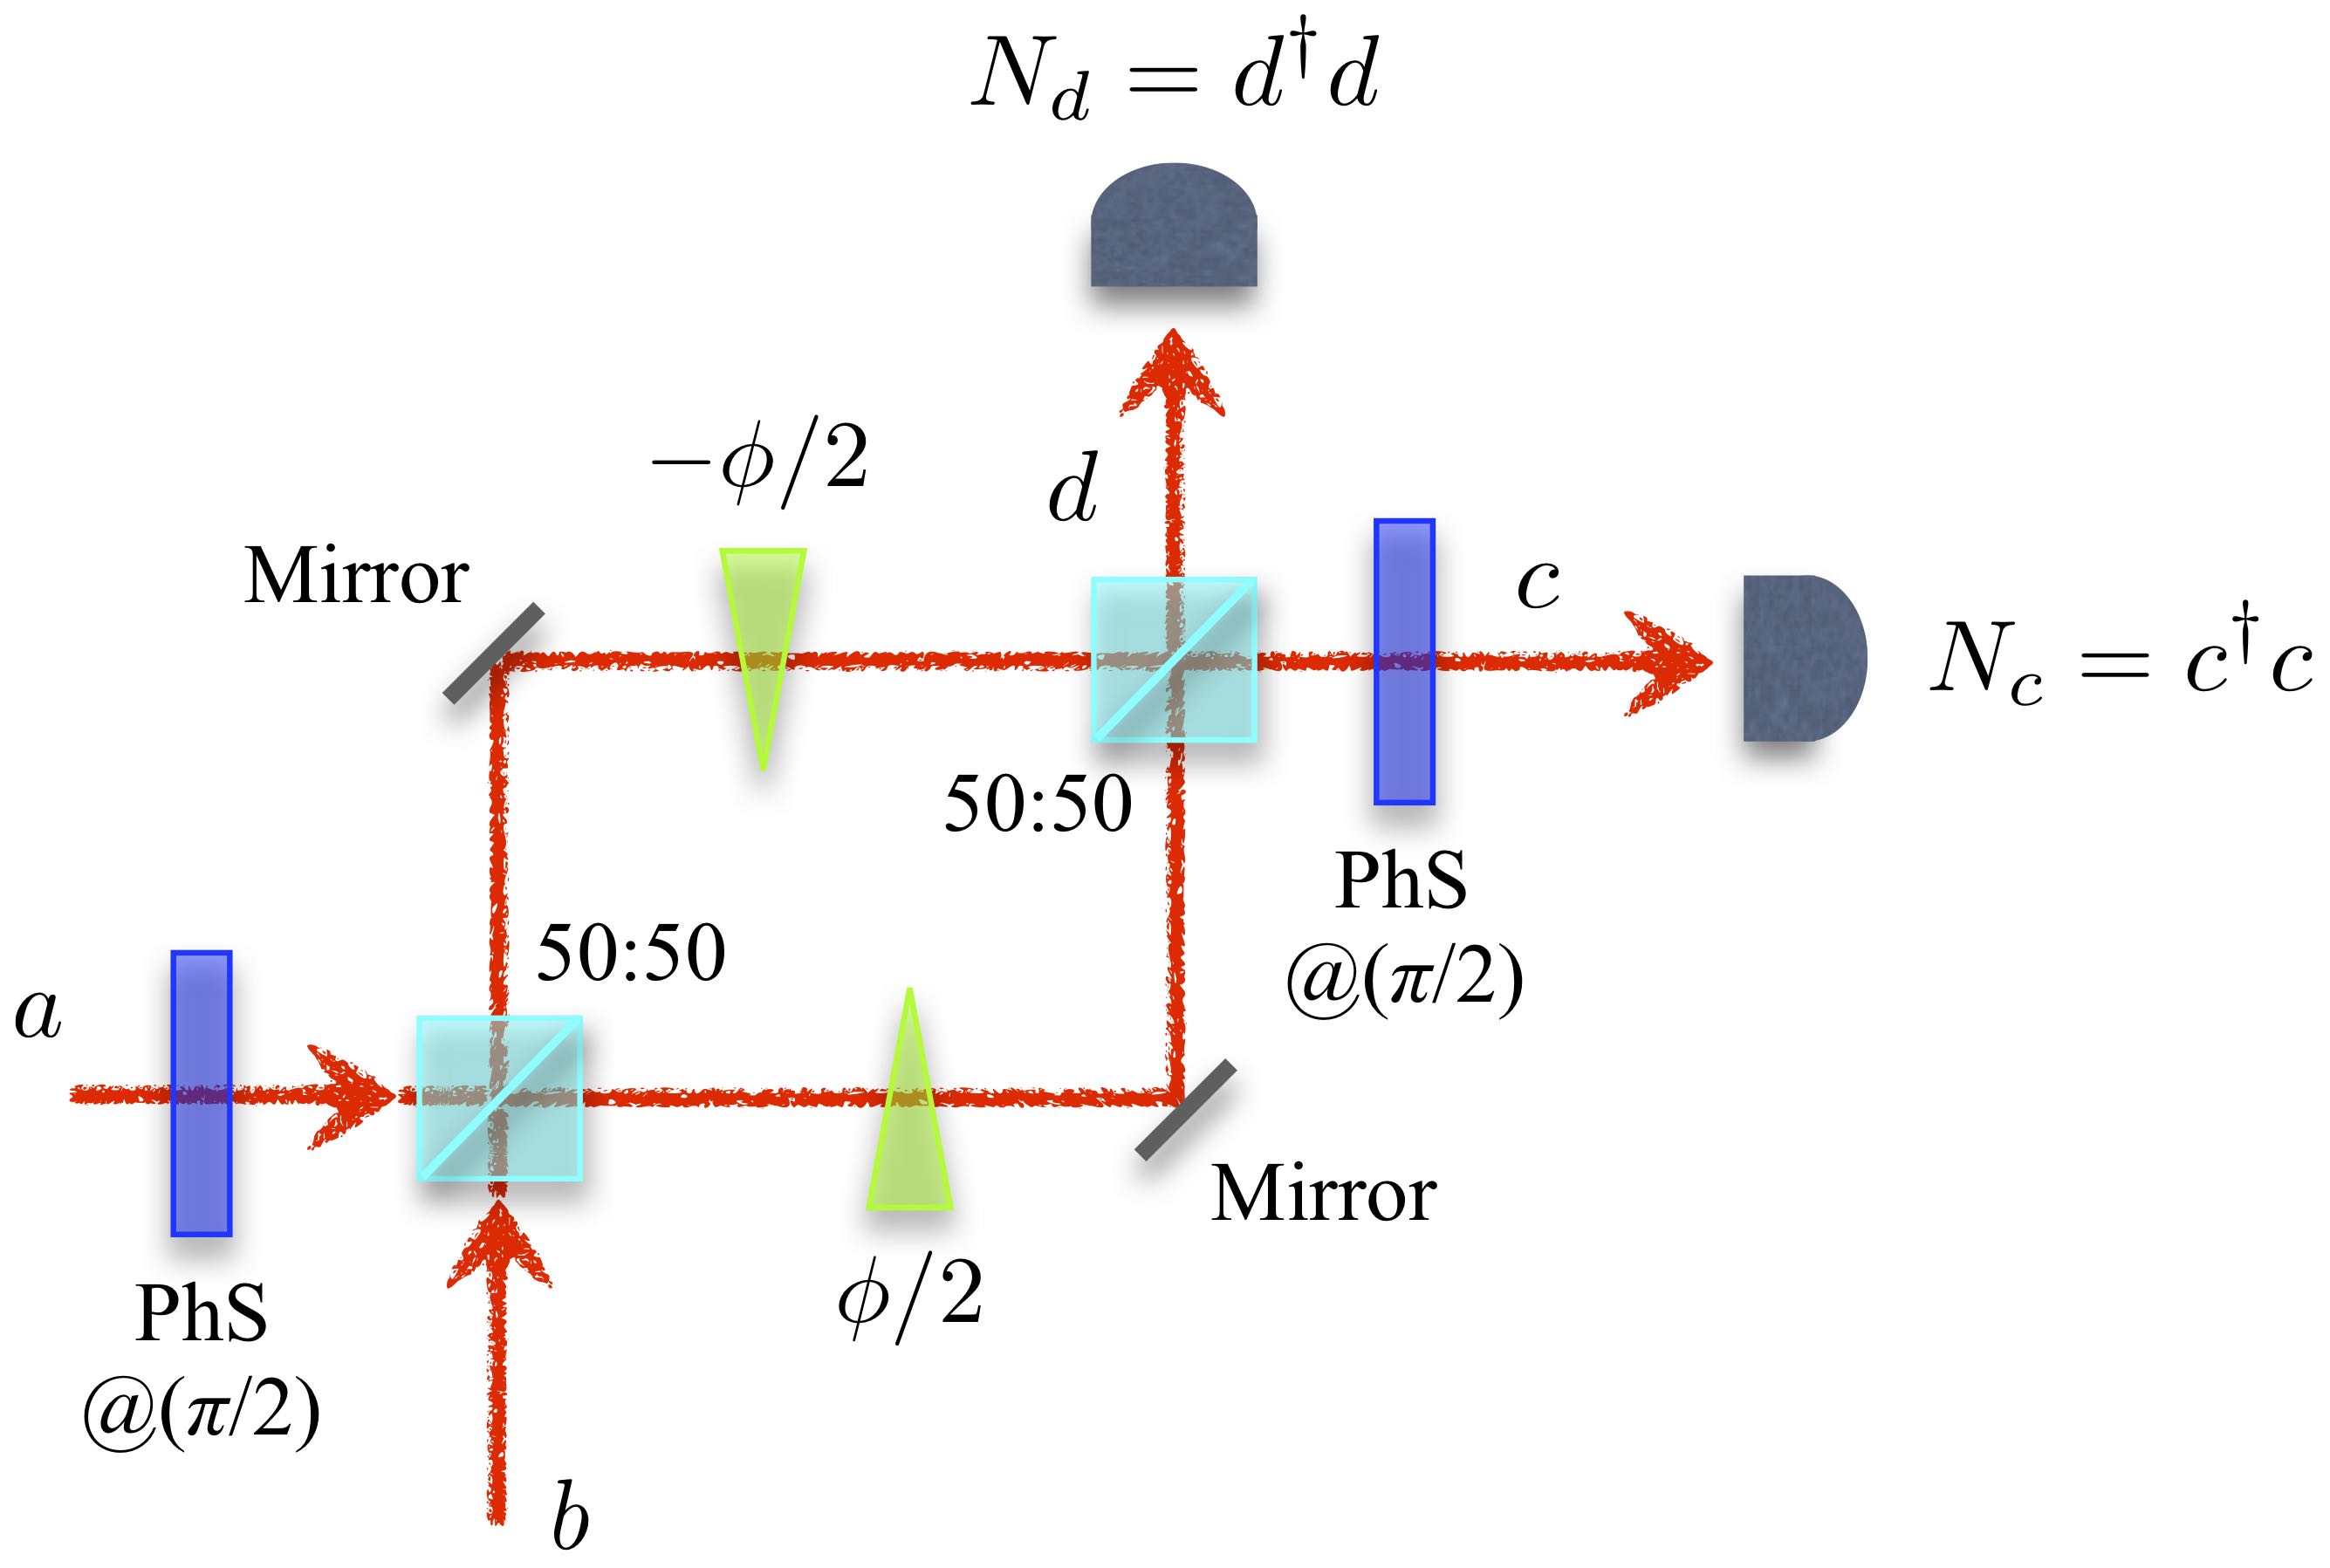
The key ingredient of an optical interferometers is the beam splitter, a linear optical device in which two beams of light interfere (see appendix LABEL:app:BS). In fig. 2 we sketched a Mach-Zehnder interferometer, but analogous results can be obtained in the case of a Michelson interferometer. The two input field modes, described by the annihilation operators and , with and , evolve into the output modes and which depend on the phase . To find the input-output relations, we should transform the input modes through the first 50:50 beam splitter, then apply the phase shift and the reflections at the mirrors and, finally, recombine the resulting modes in a second 50:50 beam splitter.
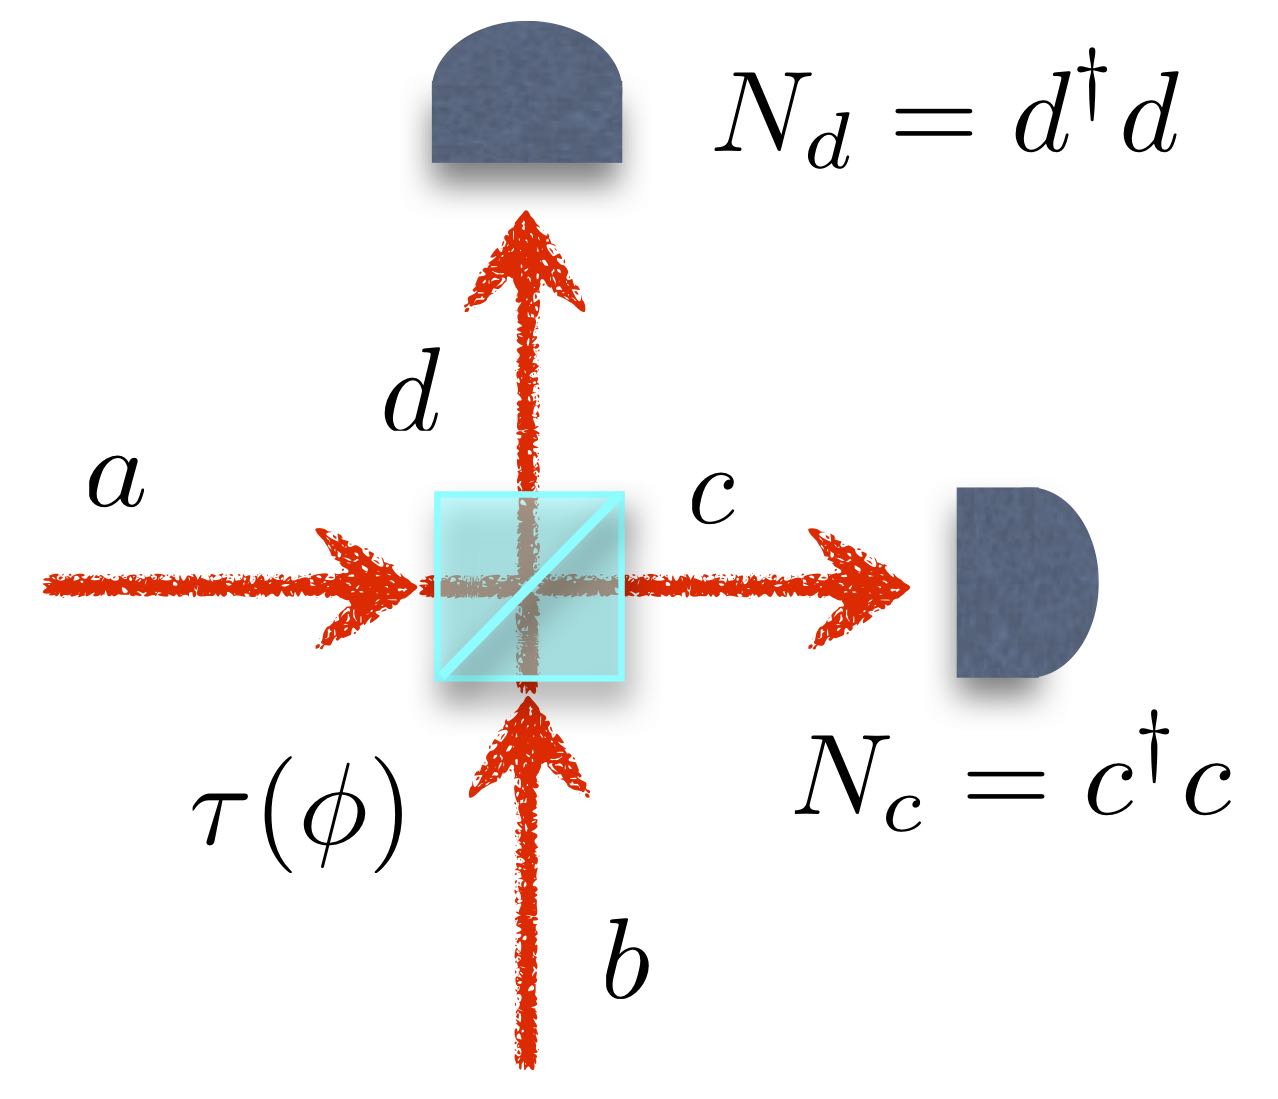
Besides the final measurement, it is interesting to note that,
from the theoretical point of view, any interferometer measuring a phase shift
can be summarised by two input light beams which interfere at a
beam splitter with transmissivity , as sketched in fig. 3.
In the case of the Mach-Zehnder interferometer of fig. 2,
this requires to add two phase shifters at (see PhS in fig. 2).
In this view, as the reader can verify applying the transformations associated with the
beam splitter, with the mirror and with the phase shift described in
appendix LABEL:app:BS, the input field modes evolve into the output modes:
{eqnletter}
c &= cos(ϕ/2) a + sin(ϕ/2) b ,
d = cos(ϕ/2) b - sin(ϕ/2) a .
The final stage of an interferometer is the photodetection of the beams leading to the
measurement of the number of photons and
and, finally, a suitable function is evaluated (usually, as we will see later, the sum
or the difference of the two quantities) obtaining a data sample.
The outcomes are distributed according to the probability distribution which,
of course, depends on the states of the optical input beams.
The information about is retrieved using the estimator
| (8) |
being the data sample space, whereas the sensitivity of the interferometer is given by the relation
| (9) |
Whenever can be approximated by a Gaussian distribution with standard deviation , it easy to show that [spara:PRA]
| (10) |
where
| (11) |
is the Fisher information introduced in section 2.
In order to show how the presence of nonclassical states can improve the sensitivity, we first consider the scheme in fig. 3 when a coherent state and the vacuum state enter the two ports of the interferometer. We recall that the coherent state represents, with good approximation, the output state of a laser with average number of photons given by and standard deviation [glauber] (see appendix LABEL:app:CS for further details about coherent states).

If we assume to measure the photon number difference at the output, namely:
{eqnletter}
O(ϕ) &= D_-(ϕ) ≡Tr[ϱ_in (N_c - N_d)] ,
= N_c(ϕ) - N_d(ϕ) ,
with
| (12) |
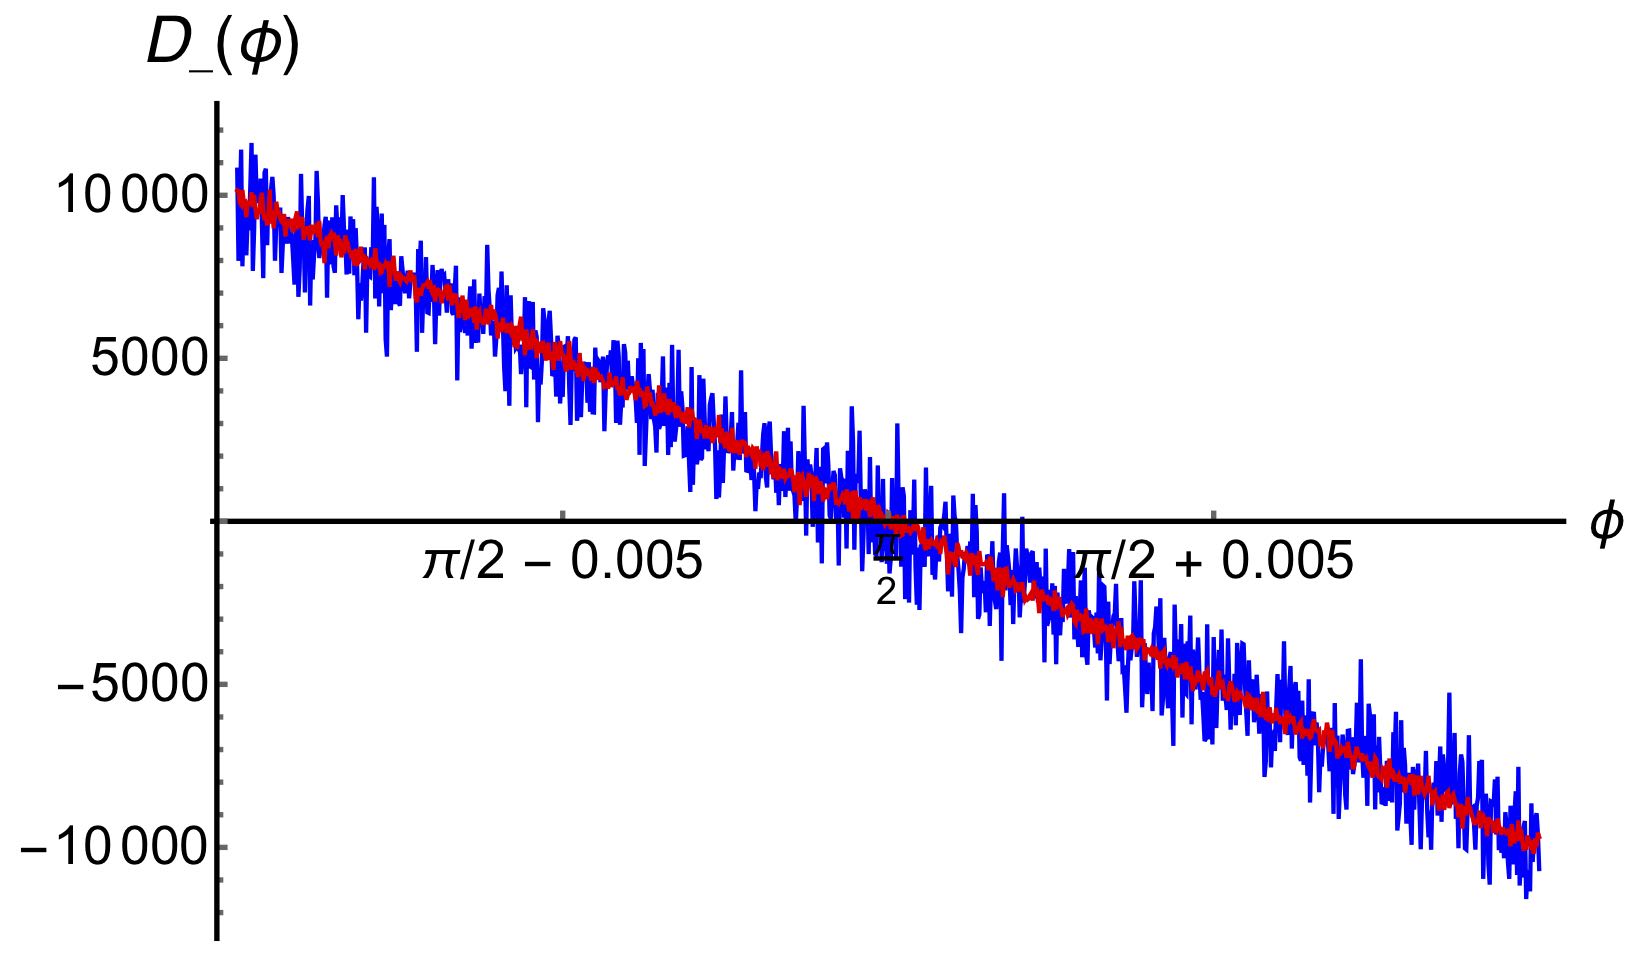
then we obtain the typical interference fringes, as reported in fig. 4 (a). Since and , it is easy to show that the sensitivity of this interferometer is
| (13) |
(the subscript “cl” underlines the use of classical light, such as the coherent state) which reaches the minimum for . The value of the phase leading to the minimum sensitivity is usually called “working regime” of the interferometer: here a small change of the phase produces a large effect on the quantity , as we can see from fig. 4 (b), since the absolute value of derivative at the denominator of eq. (9) reaches its maximum.
If we consider a scheme in which only one port of the interferometer is monitored, say the
port corresponding to mode , one finds analogous results, but now
{eqnletter}
O(ϕ) &= N_d(ϕ)
= —α—^2 sin^2(ϕ/2) ,
and ; therefore, the sensitivity becomes:
| (14) |
Note that in this case the working regime is , corresponding to the so-called “dark port” as expected (we will briefly consider this configuration at the end of this section). This is the typical working regime of gravitational wave antennas [grav:11]. In both the cases, however, the minimum sensitivity scales as , being the average number of photons circulating in the interferometer. This is the well-known shot-noise scaling. We will see that this limit can be beaten exploiting nonclassical optical states up to reaching the Heisenberg scaling [DDR:15, spara:josab, paris:sq, optimized:07, pezze:08, lang:13].
In order to improve the sensitivity we should look for a way to increase the value of the denominator of eq. (9) and/or to reduces the fluctuations of the measured quantity at the numerator. In this last case we can exploit the nonclassical properties of a particular class of states called squeezed states (see appendix LABEL:app:SQ for some details about the definition and the main properties of squeezed states).
If we substitute to the vacuum a squeezed vacuum state, the two-mode input state reads
| (15) |
where is a squeezed state with coherent amplitude and squeezing parameter (see appendix LABEL:app:SQ). The analytical formula of the sensitivity is now quite cumbersome [spara:PRA] and is not reported explicitly. Nevertheless, fig. 5 shows the effects of the presence of squeezing, i.e. a noncalssical resource, on the interference fringes. Though the number of squeezed photon for the chosen parameters is extremely small with respect to number of coherent photons (), we can see a reduction of the photon number fluctuation which improves the sensitivity of the interferometer [paris:sq]. This is clear from fig. 6, where we plot the ratio
| (16) |
between the sensitivity in the presence of squeezing () and without it () as a function of the measured phase . It is worth noting that only for the use of squeezing leads to improved interferometer performances. This can be understood by inspecting the explicit expression of the variance of , which is now phase sensitive because of the presence of squeezing and reads
| (17) |
Therefore, we have:
| (18) |
where the minimum is achieved for and the maximum for . For what concerns the expectation value of the photon number difference, the squeezing just affects the amplitude of the interference fringes, namely:
| (19) |
Note that, in order to have , we should require , otherwise the squeezing resource becomes useless. Moreover, in the regime (see the lower red line in fig. 6) we find:
| (20) |
and we can see that it always beats the performance of an interferometer fed by the a coherent state (and, of course, the vacuum).
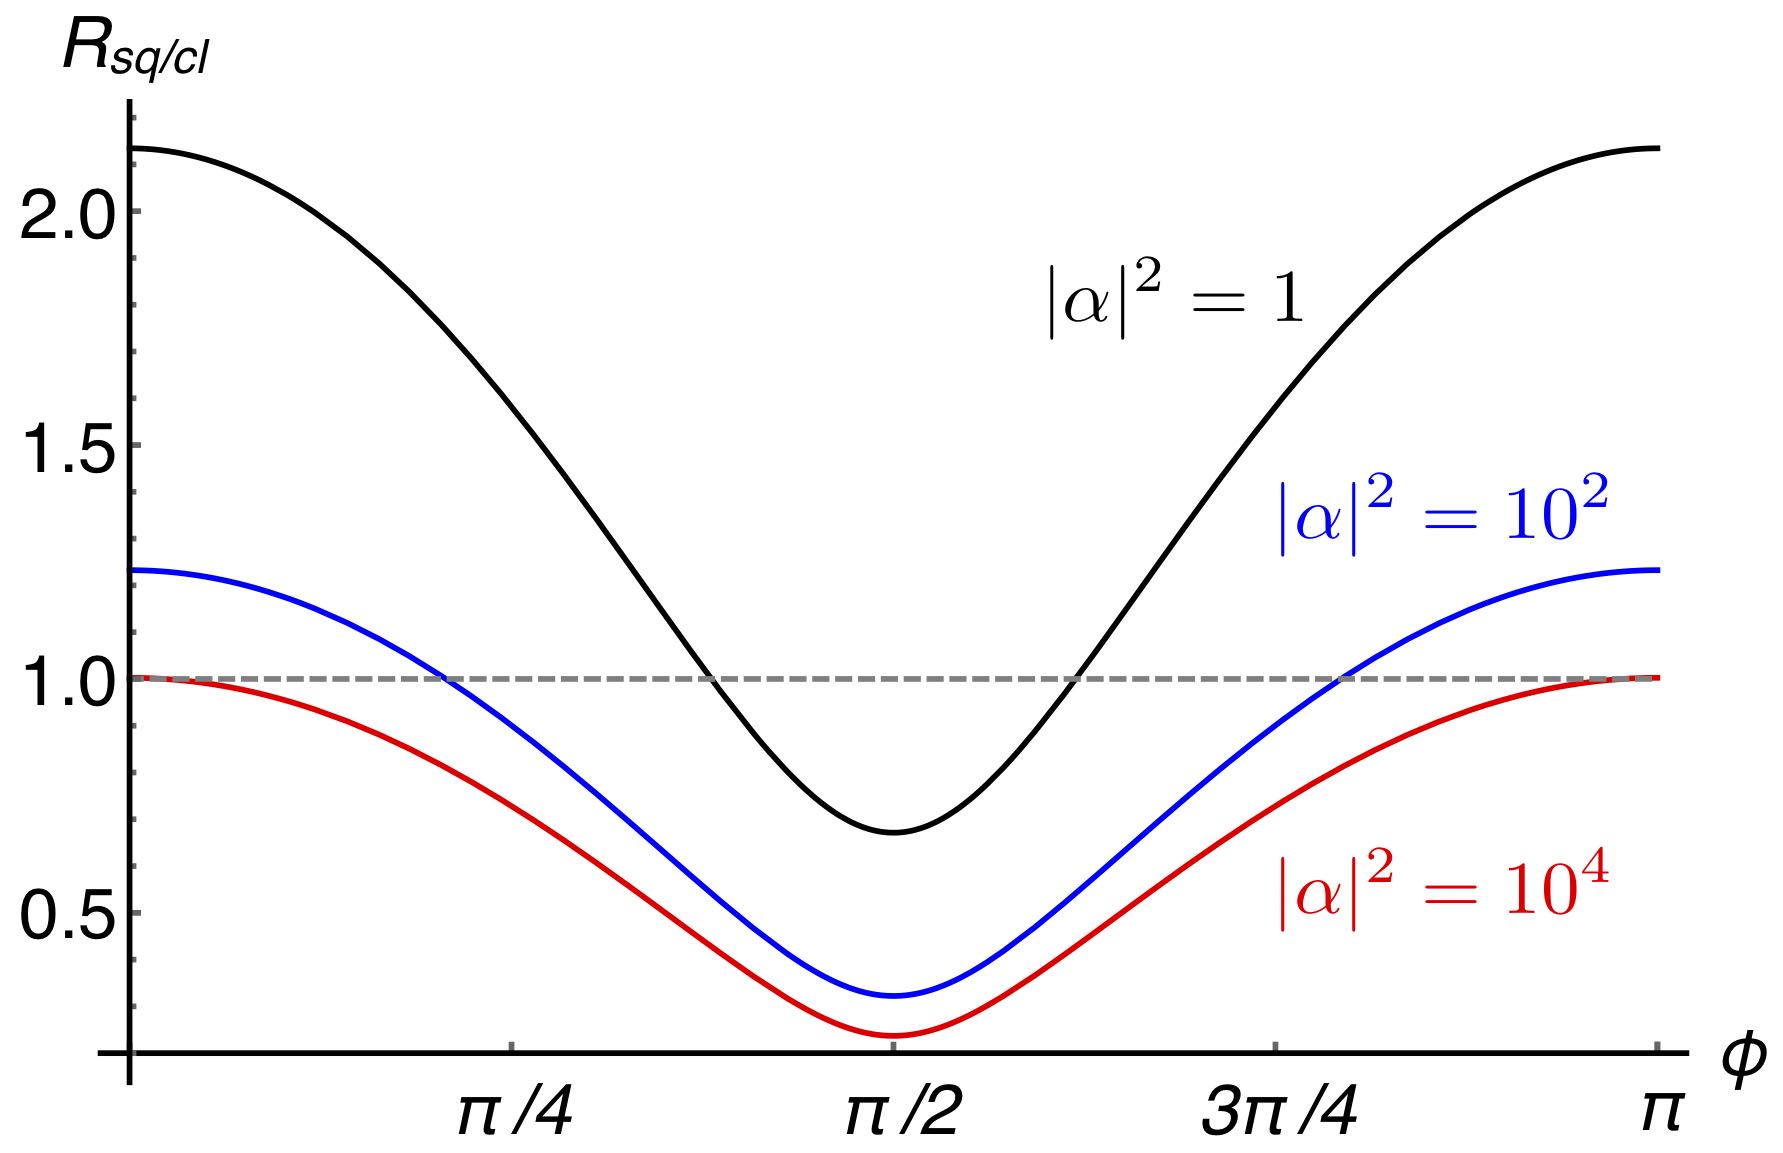

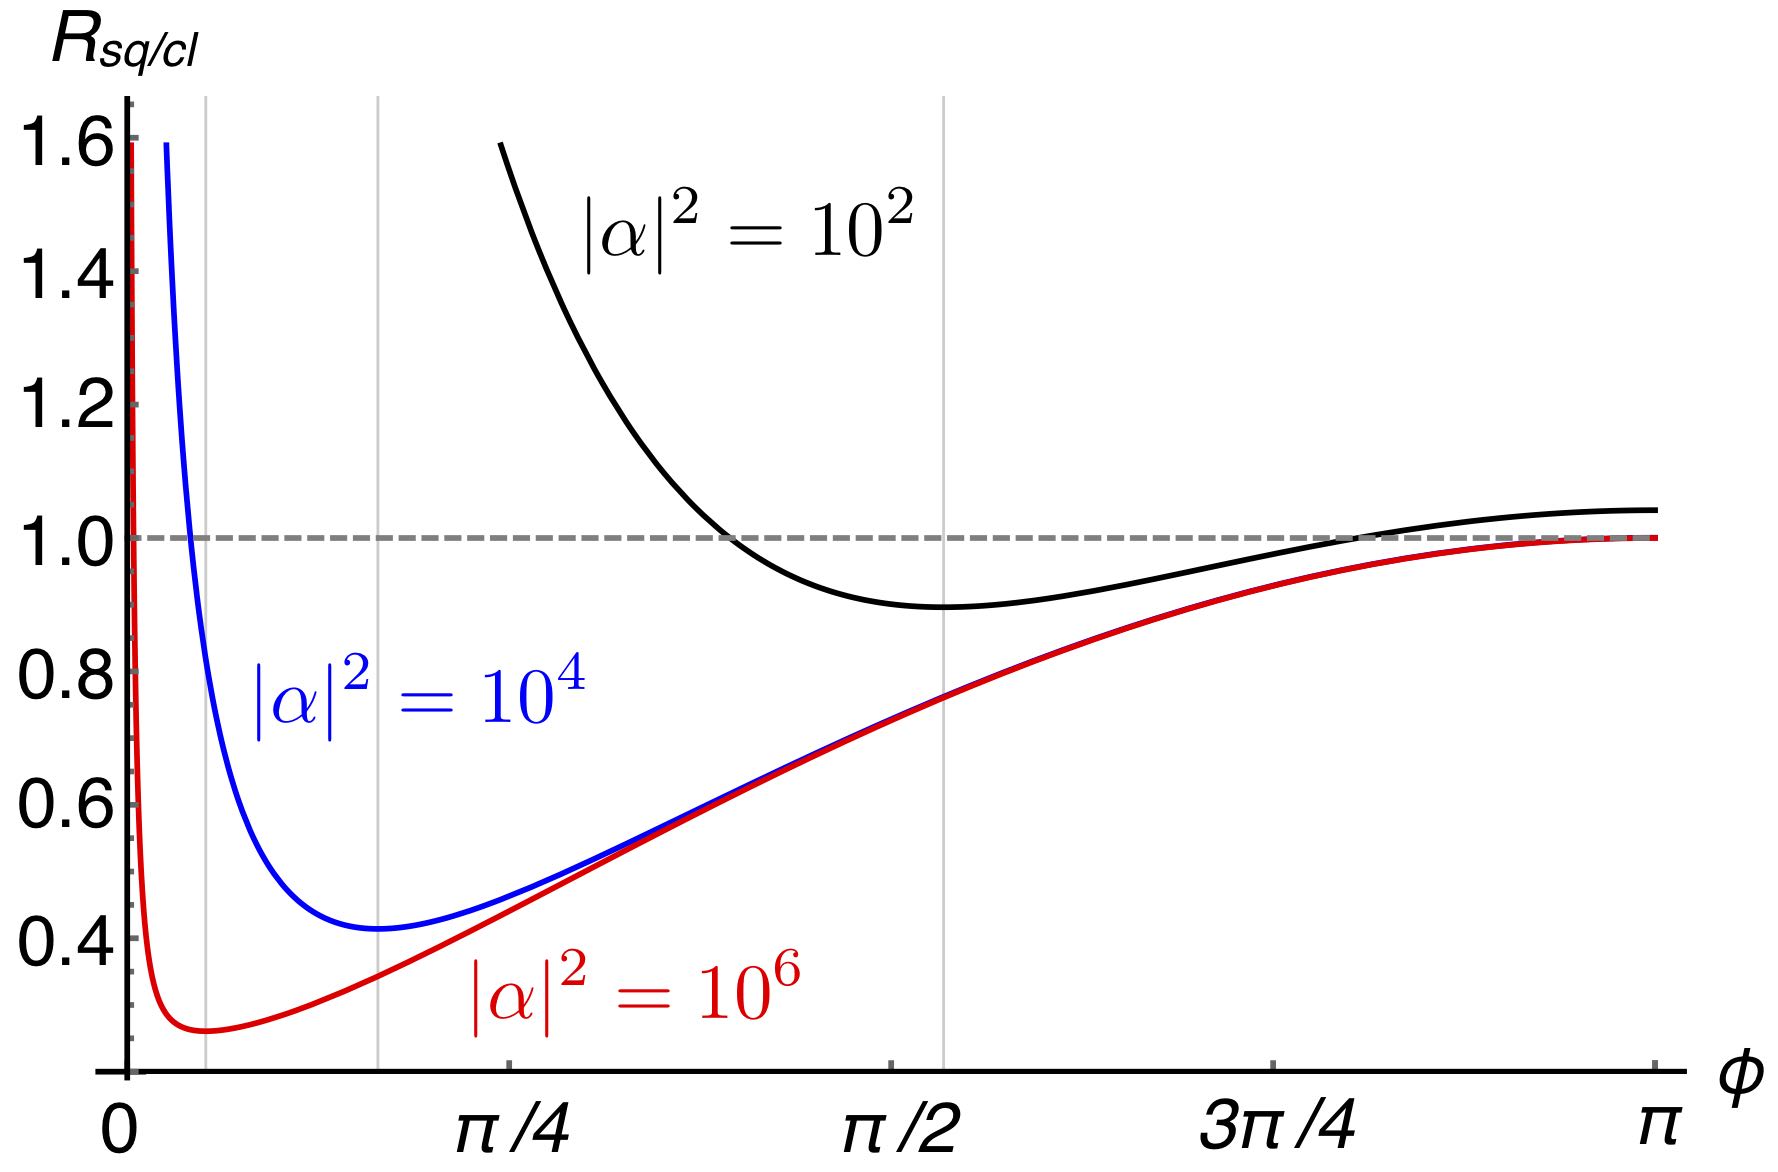
For the sake of completeness in fig. 7 (a) we report the interference fringes when only one port of the interferometer is monitored and the number of photons is recorded. In this case, as we noted above, the working regime is , where the intensity fluctuations, which depends on the coherent state amplitude (see appendix LABEL:app:CS), vanishes, since the detected intensity is null. In fig. 7 (b), blue line, we show the magnification of the region for approaching zero. As in the case of the measurement of , also in this one the presence of squeezing can help: the red line in fig. 7 (b) is obtained by substituting to the vacuum a squeezed state with the same squeezing parameter used in fig. 5.
If we now consider the corresponding ratio between the sensitivity in the presence of squeezing and without it reported in fig. 8, we can see that the minimum is not achieved in the working regime , but for a value that approaches it as the intensity of the coherent state increases. On the contrary, we recall that when the photocurrent difference at the output is used to retrieve the information about the phase, the working regime at coincides with the optimal phase to fully exploit the squeezing resource, as we can see from fig. 5 and fig. 6.
Also in this case there are regions of the phase for which squeezing does not improve the performance of the interferometer. However, the analysis of the effect is more subtile than the previous case. In fact, while the mean value reads
| (21) |
the variance is now given by
which depends on also in the absence of squeezing. If we focus on the working regime , we have , which vanishes only for , i.e. when the squeezed state is replaced by the vacuum. Nevertheless, squeezing can help in realistic scenarios, in which one cannot set precisely the phase because of the unavoidable experimental errors. As shown in fig. 8 (see the red curve for ) it is enough a small deviation from to make the squeezing a useful resource. In fact, when a very large number of photons circulates in the interferometer, a phase shift slightly different from is enough to bring a considerable number of photons to the detector. In this case the presence of squeezing can reduce the intensity fluctuation and, in turn, increase the sensitivity.
In the next section, we will investigate the limits imposed by quantum mechanics to the precision of optical interferometers by using the tools of quantum estimation theory introduced in section 2. Moreover, we will also consider more general setups involving active devices, such as optical parametric amplifiers.
4 Bounds to precision for quantum interferometry
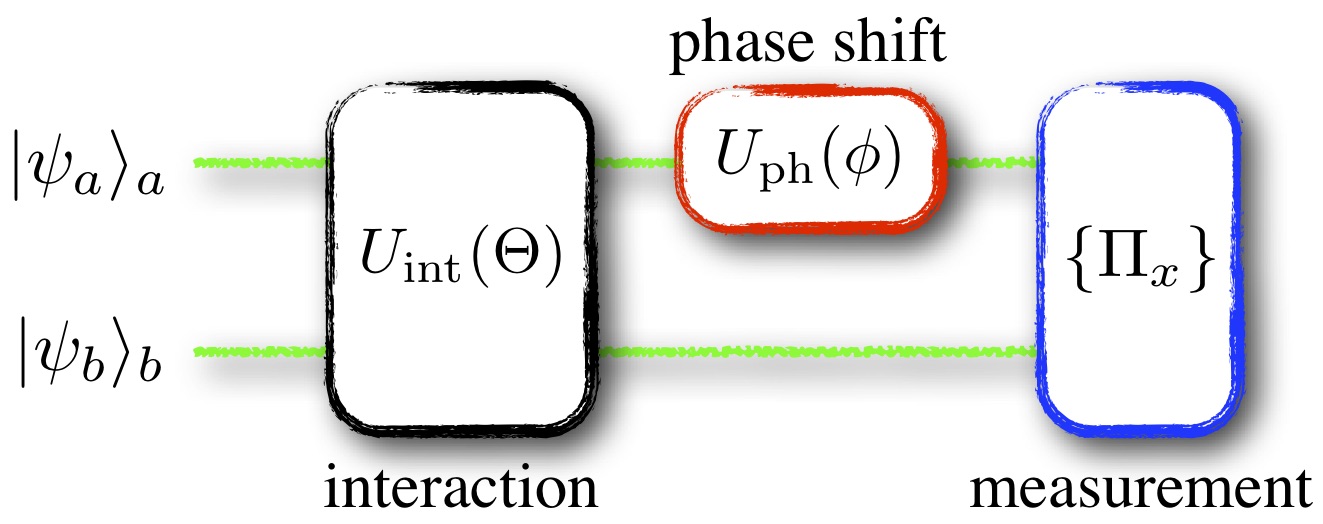
When a particular measurement stage is chosen and the input states are given, in order to find the optimal working regime of an interferometer we should maximise the Fisher information with respect to all the involved parameters (characterising both the input states and the interferometer). Moreover, we should address and optimise the quantum Fisher information [QCR:94, QCR:96] to study the ultimate bounds imposed by quantum mechanics, and find the optimal measurement to perform. To this aim it is useful to describe the interferometers as sketched in fig. 9. Here, the two modes of an input state
| (23) |
interacts through the unitary interaction , representing the parameter of the interaction (such as the beam splitter transmissivity), then one of the modes undergoes a phase shift ; finally, they are measured according to the POVM , being the outcome of the measurement [paris:rev].
In general, different quantum optical states can be used to improve the sensitivity of
an interferometer [QM, kok:int, popo]. In this section we consider the class Gaussian states,
namely, states described by Gaussian Wigner function
which can be generated and manipulated with the current technology [bachor, porzio:09, cialdi:16].
Therefore we can assume that the input states are two displaced squeezed
states, i.e.
(for the sake of simplicity we drop the subscripts), where
we can also assume [spara:PRA]. In order to make the analysis
easier, it is useful to introduce the following relevant quantities:
{eqnletter}
N_tot = α^2 + γ^2 +sinh^2 r + sinh^2 ξ ,&
(total number of photons)
Δ= α2α2+ γ2 ,
(signal fraction)
β_tot = sinh2r + sinh2ξNtot ,
(total squeezing fraction)
β= sinh2ξNtot .
(total squeezing fraction)
As we discussed in section 2,
the inverse of the Fisher information sets a lower bound for the the variance in estimating ,
known as Cramér-Rao bound, that is based on and, thus,
depends on the particular measurement we perform. It is possible, however, to find a measurable
observable (an optimal POVM) that maximises the Fisher information [paris:rev, helstrom, QFI].
This leads to an upper bound for the Fisher information, the quantum Fisher information
(see section 2).
In order to find the optimal POVM one starts from the Born rule,
| (24) |
where
| (25) |
and . To find the optimal we write the Fisher information as in eq. (3) and the corresponding quantum Fisher information is such that . Here we are not interested in the actual form of the POVM, but we will focus on the quantum Fisher information.

First of all we consider a passive interaction, namely, an interaction which does not change the energy of the input states. In particular, we assume that describes the action of a balanced beam splitter (see appendix LABEL:app:BS):
| (26) |
where and are the boson field operators describing the two input modes. The maximisation of the Fisher information over all the involved quantities introduced above shows that the best configuration requires and , corresponding to the following quantum Fisher information (the reader can find the details in ref. [spara:josab]), which depends only on and :
We can perform a further (numerical) maximisation of with respect to the total squeezing fraction . The results are shown in fig. 10 (a), where we plot as a function of , whereas in fig. 10 (b) we plot the corresponding phase sensitivity obtained by using the optimal squeezing fraction : it is clear that in the large energy regime () the Heisenberg scaling is reached.
It is worth noting that the maximisation over all the parameters leads to the optimal symmetric input state . If we assume, however, that the input state has the form (coherent state squeezed vacuum [grav:11]), the optimisation still gives the Heisenberg scaling for but now , that is a slightly worse result than the one we obtained by considering displaced squeezed states.
Let’s suppose, now, that the initial interaction is an active one, namely it increases the energy of the input states. A typical interaction of this kind is implemented by an optical parametric amplifier (OPA) [oli:rev] and it is the so-called two-mode squeezing interaction (see appendix LABEL:app:TWB), described by the unitary operator:
| (28) |
This operator, when applied to the vacuum state, generates the two-mode squeezed vacuum or twin-beam state, as explicitly shown in appendix LABEL:app:TWB, namely:
| (29) |
with , that is a continuous-variable entangled state whose nonclassical features are exploited in many continuous-variable quantum information processing protocols [rev:gauss].

This kind of interferometer is also referred to as coherent light boosted
interferometer (CLBI) [yurke:86, plick:10]. Since the interaction imposes
phase-sensitive amplification (i.e. two-mode squeezing) introducing
quantum correlations between the two modes, we can choose as inputs two classical signals,
namely, a couple of coherent states
, .
Now the relevant quantities are:
{eqnletter}
N_tot = (α^2 + γ^2 +1) cosh(2r) +2αγcos(θ)sinh(2 r)-1 ,&
(total number of photons)
Δ= α2α2+ γ2 ,
(signal fraction)
β= sinh2ξNtot .
(total squeezing fraction)
Proceeding as in the case of the passive interferometer, we can maximise the
quantum Fisher information with respect to and for fixed energy
. In fig. 11 (a) we plot
the signal fraction and the squeezing fraction
giving the maximal quantum Fisher information
plotted in fig. 11 (b). By comparison between fig. 10 (b)
and fig. 11 (b) in the large energy regime we can see that
the passive interferometer outperforms the active one. Nevertheless,
in the presence of losses and realistic measurement the latter turns out to be useful,
as we are going to show in the following.
A thorough analysis of passive and active interferometers using passive and active detection stage can be found in ref. [spara:PRA], while here we summarise the main results we obtained also in the presence of non-unit quantum detection efficiency (in appendix LABEL:app:eta we describe the model used to include the quantum efficiency in our analysis). As a matter of fact, one can choose any possible combination of active/passive interaction and active/passive detection.
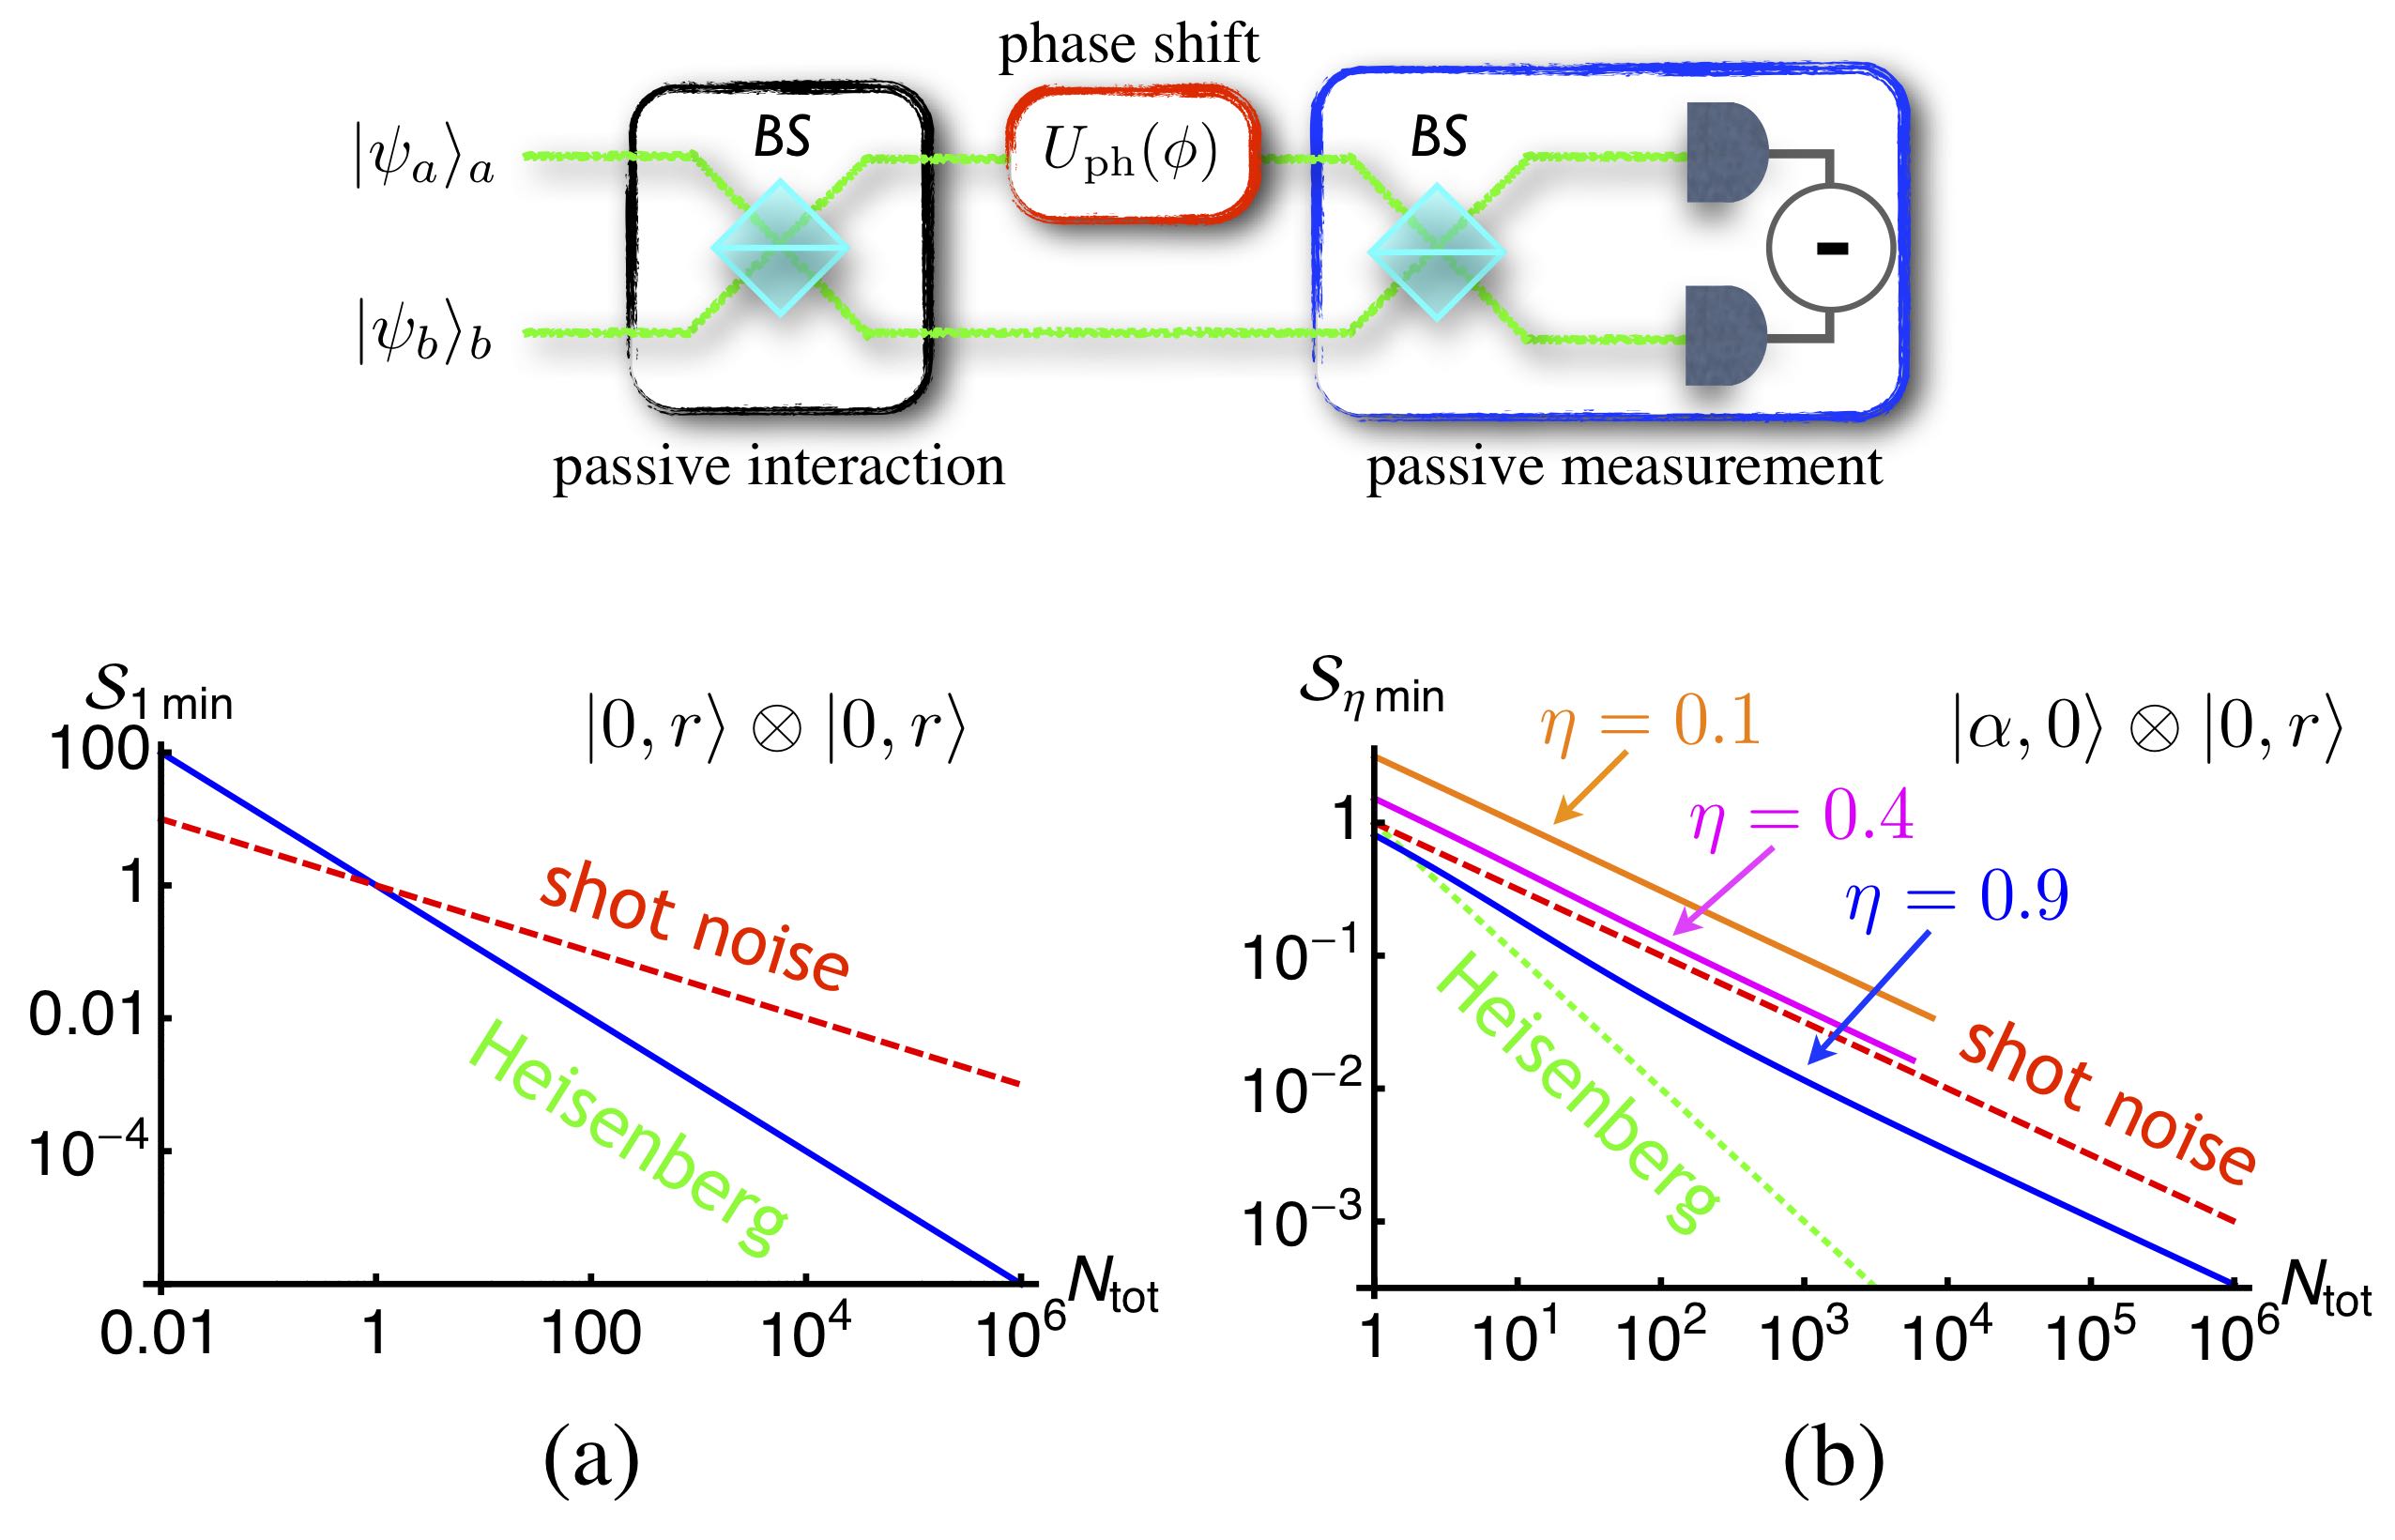
We first consider the most common configuration, in which a balanced, 50:50, beam splitter is used in the initial interaction and before photodetection, as shown in the scheme in fig. 12: the measured quantity is the difference and the sensitivity is given by
| (30) |
In fig. 12 (a) we plot the sensitivity of the interferometer as a function of after the optimisation (i.e. the minimisation of the sensitivity) with respect to the input states. In the presence of unit quantum efficiency, we find that the optimal input states are a couple of squeezed vacuum states: this choice allows us to obtain the Heisenberg scaling. However, as one may expect, when we can only achieve the shot-noise limit [DDR:13] and, in this case, the optimal input states are a coherent state and the squeezed vacuum (see ref. [spara:PRA] for further details) as reported in fig. 12 (b).
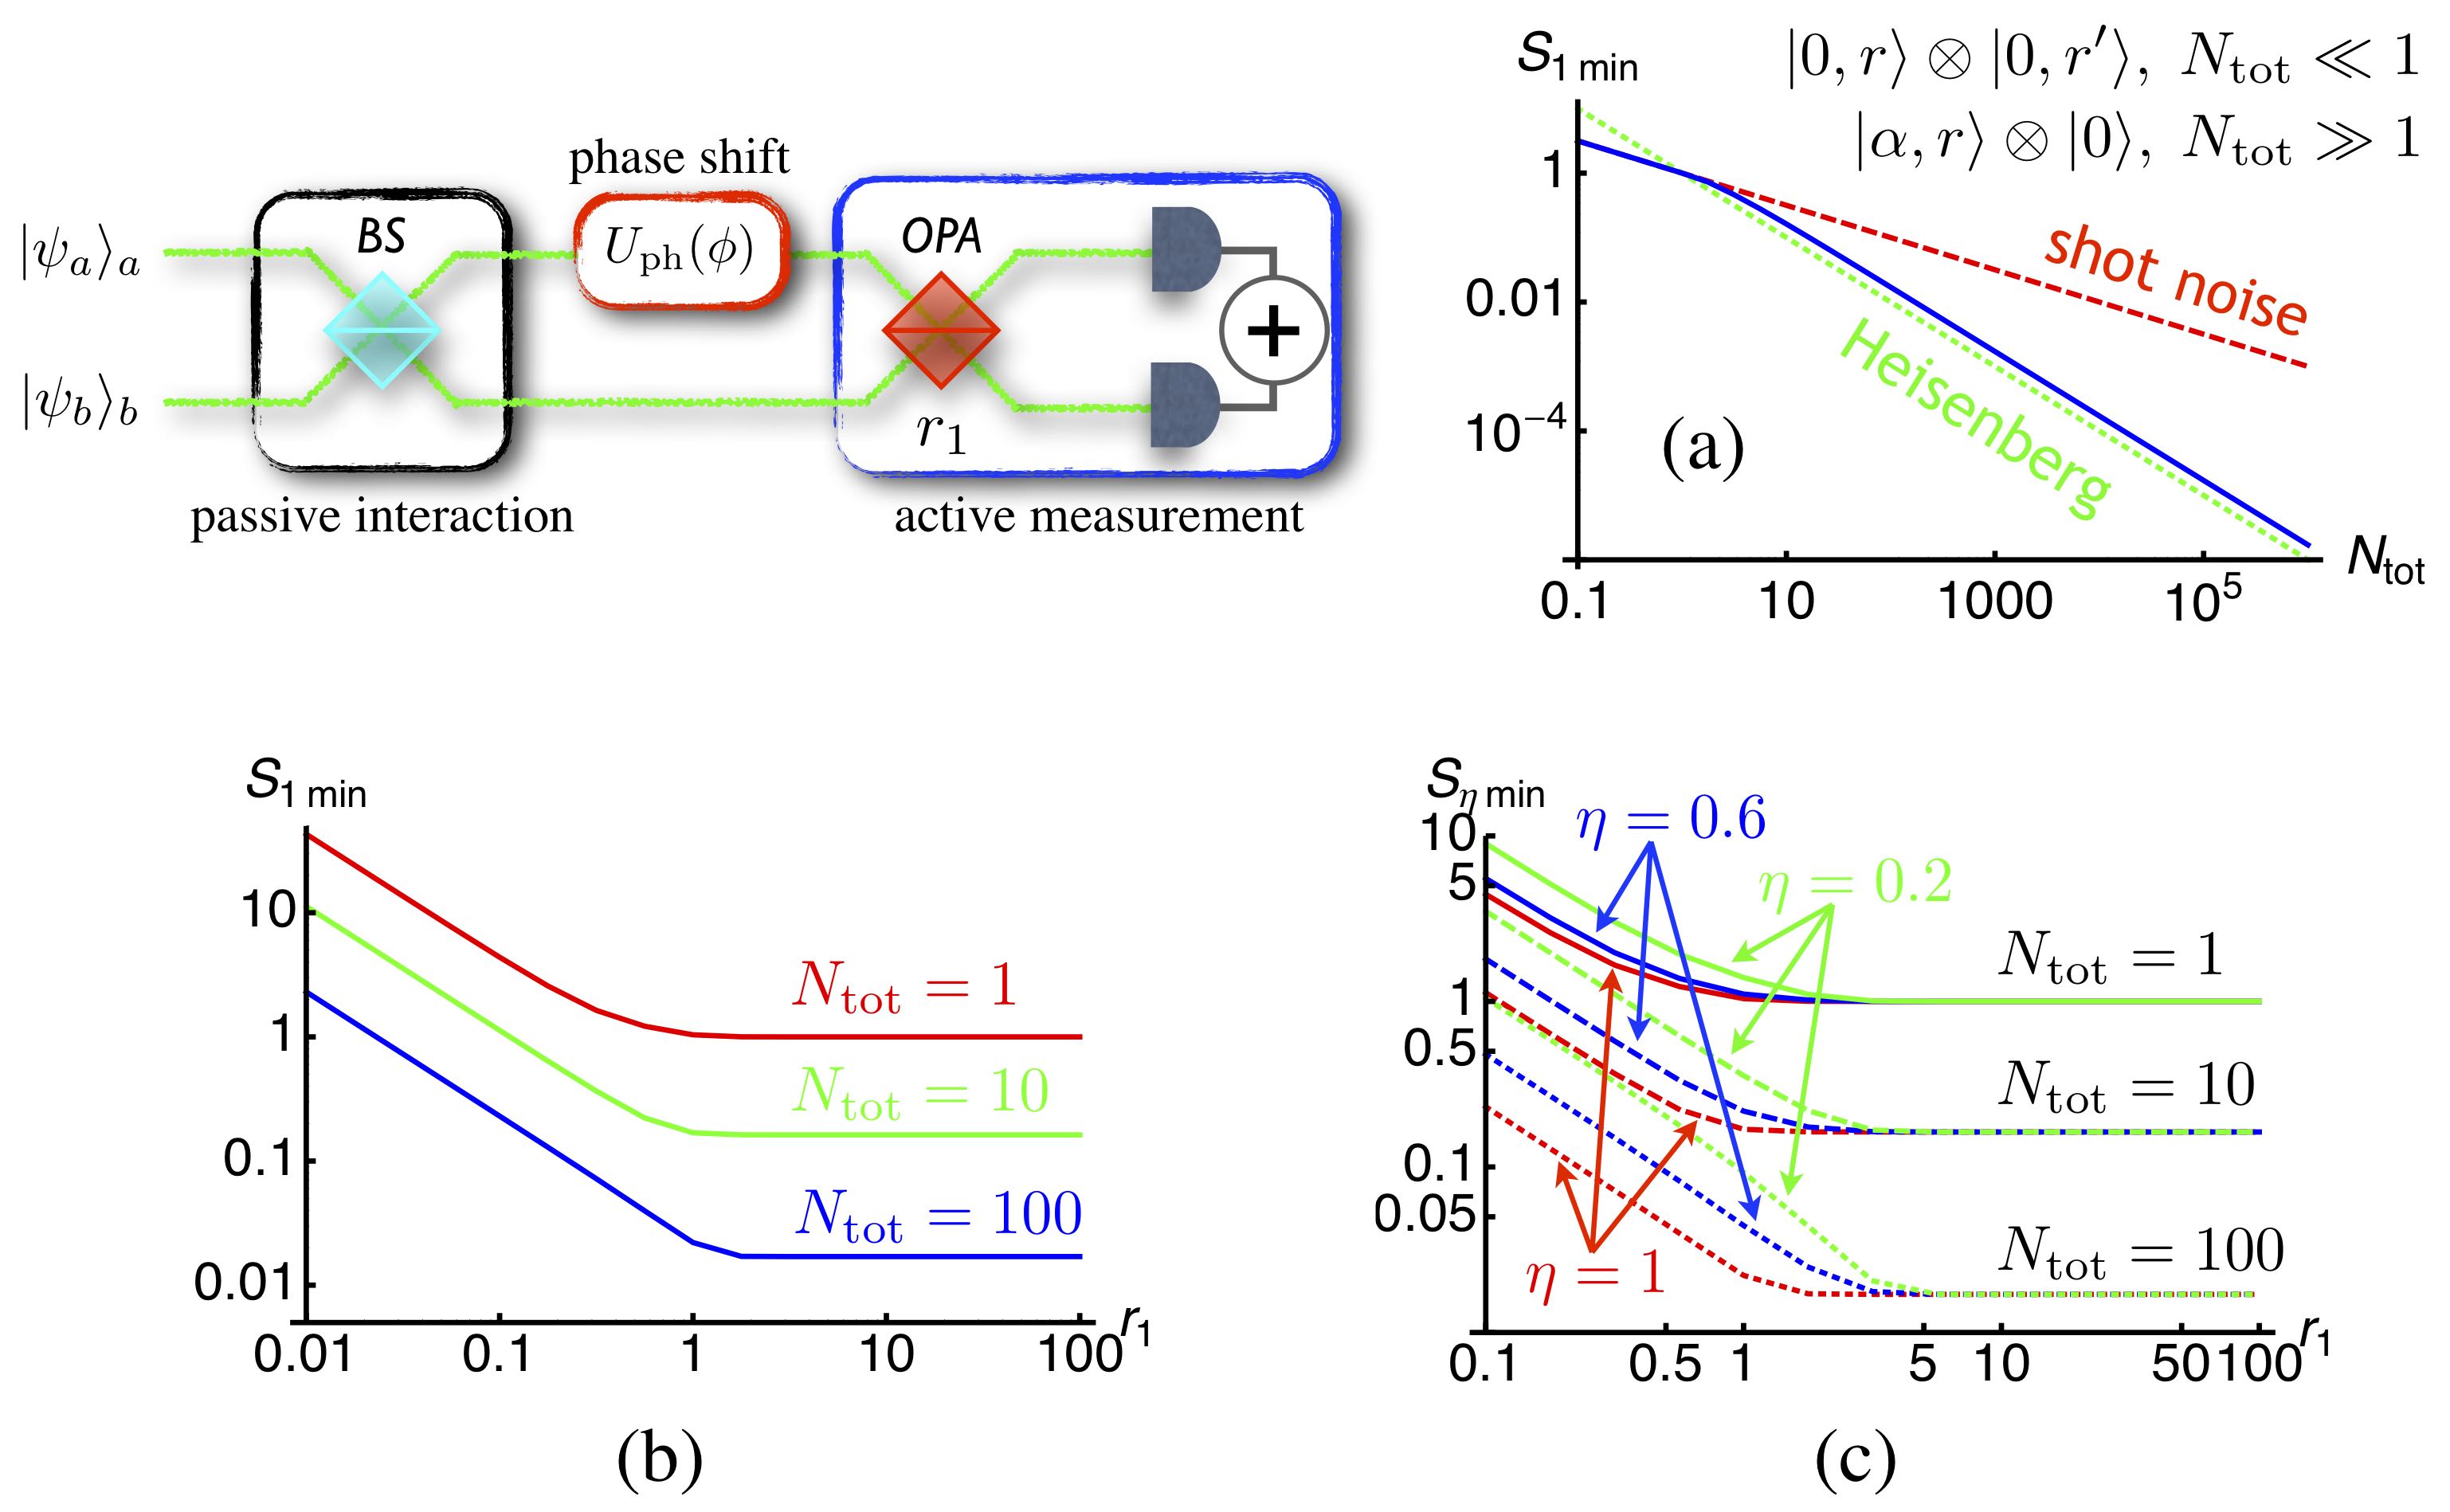
As we have seen, in the presence of losses (i.e. ) the Heisenberg scaling is no longer
achievable by the passive-passive configuration. Nevertheless, if we substitute to the second
beam splitter an OPA (characterised by the squeezing parameter ),
thus we are using an active detection stage, we can face the losses. Moreover, upon a
suitable optimisation with respect to the squeezing parameter
we can still obtain the Heisenberg scaling. This scenario is shown in fig. 13.
We note that the use of an active detection stage based on an OPA requires
to measure the sum
{eqnletter}
D_+(ϕ) &≡ Tr[ϱ_in (N_c + N_d)] ,
= N_1(ϕ) + N_2(ϕ) ,
since the difference is now independent of , as the reader can easily verify.
Therefore, the sensitivity is defined as:
| (31) |
Assuming , the optimisation shows that we identify two regimes: for low energy () the optimal input state is a couple of squeezed states with different energy, but here we can reach only the shot-noise scaling; for , however, the use of a squeezed coherent state together with the vacuum allows to reach the Heisenberg scaling, namely (details can be found in ref. [spara:PRA]):
| (32) |
The result is shown in fig. 13 (a). In fig. 13 (b) we plot as a function of . As we have mentioned above, the use of an active detection can fight the detrimental effects of losses (i.e. non-unit quantum efficiency) on the sensitivity. This can be seen analysing fig. 13 (c): here we plot as a function of for different values of the quantum efficiency and . It is clear that, after the optimisation, as increases we have
| (33) |
that is the Heisenberg scaling is restored.
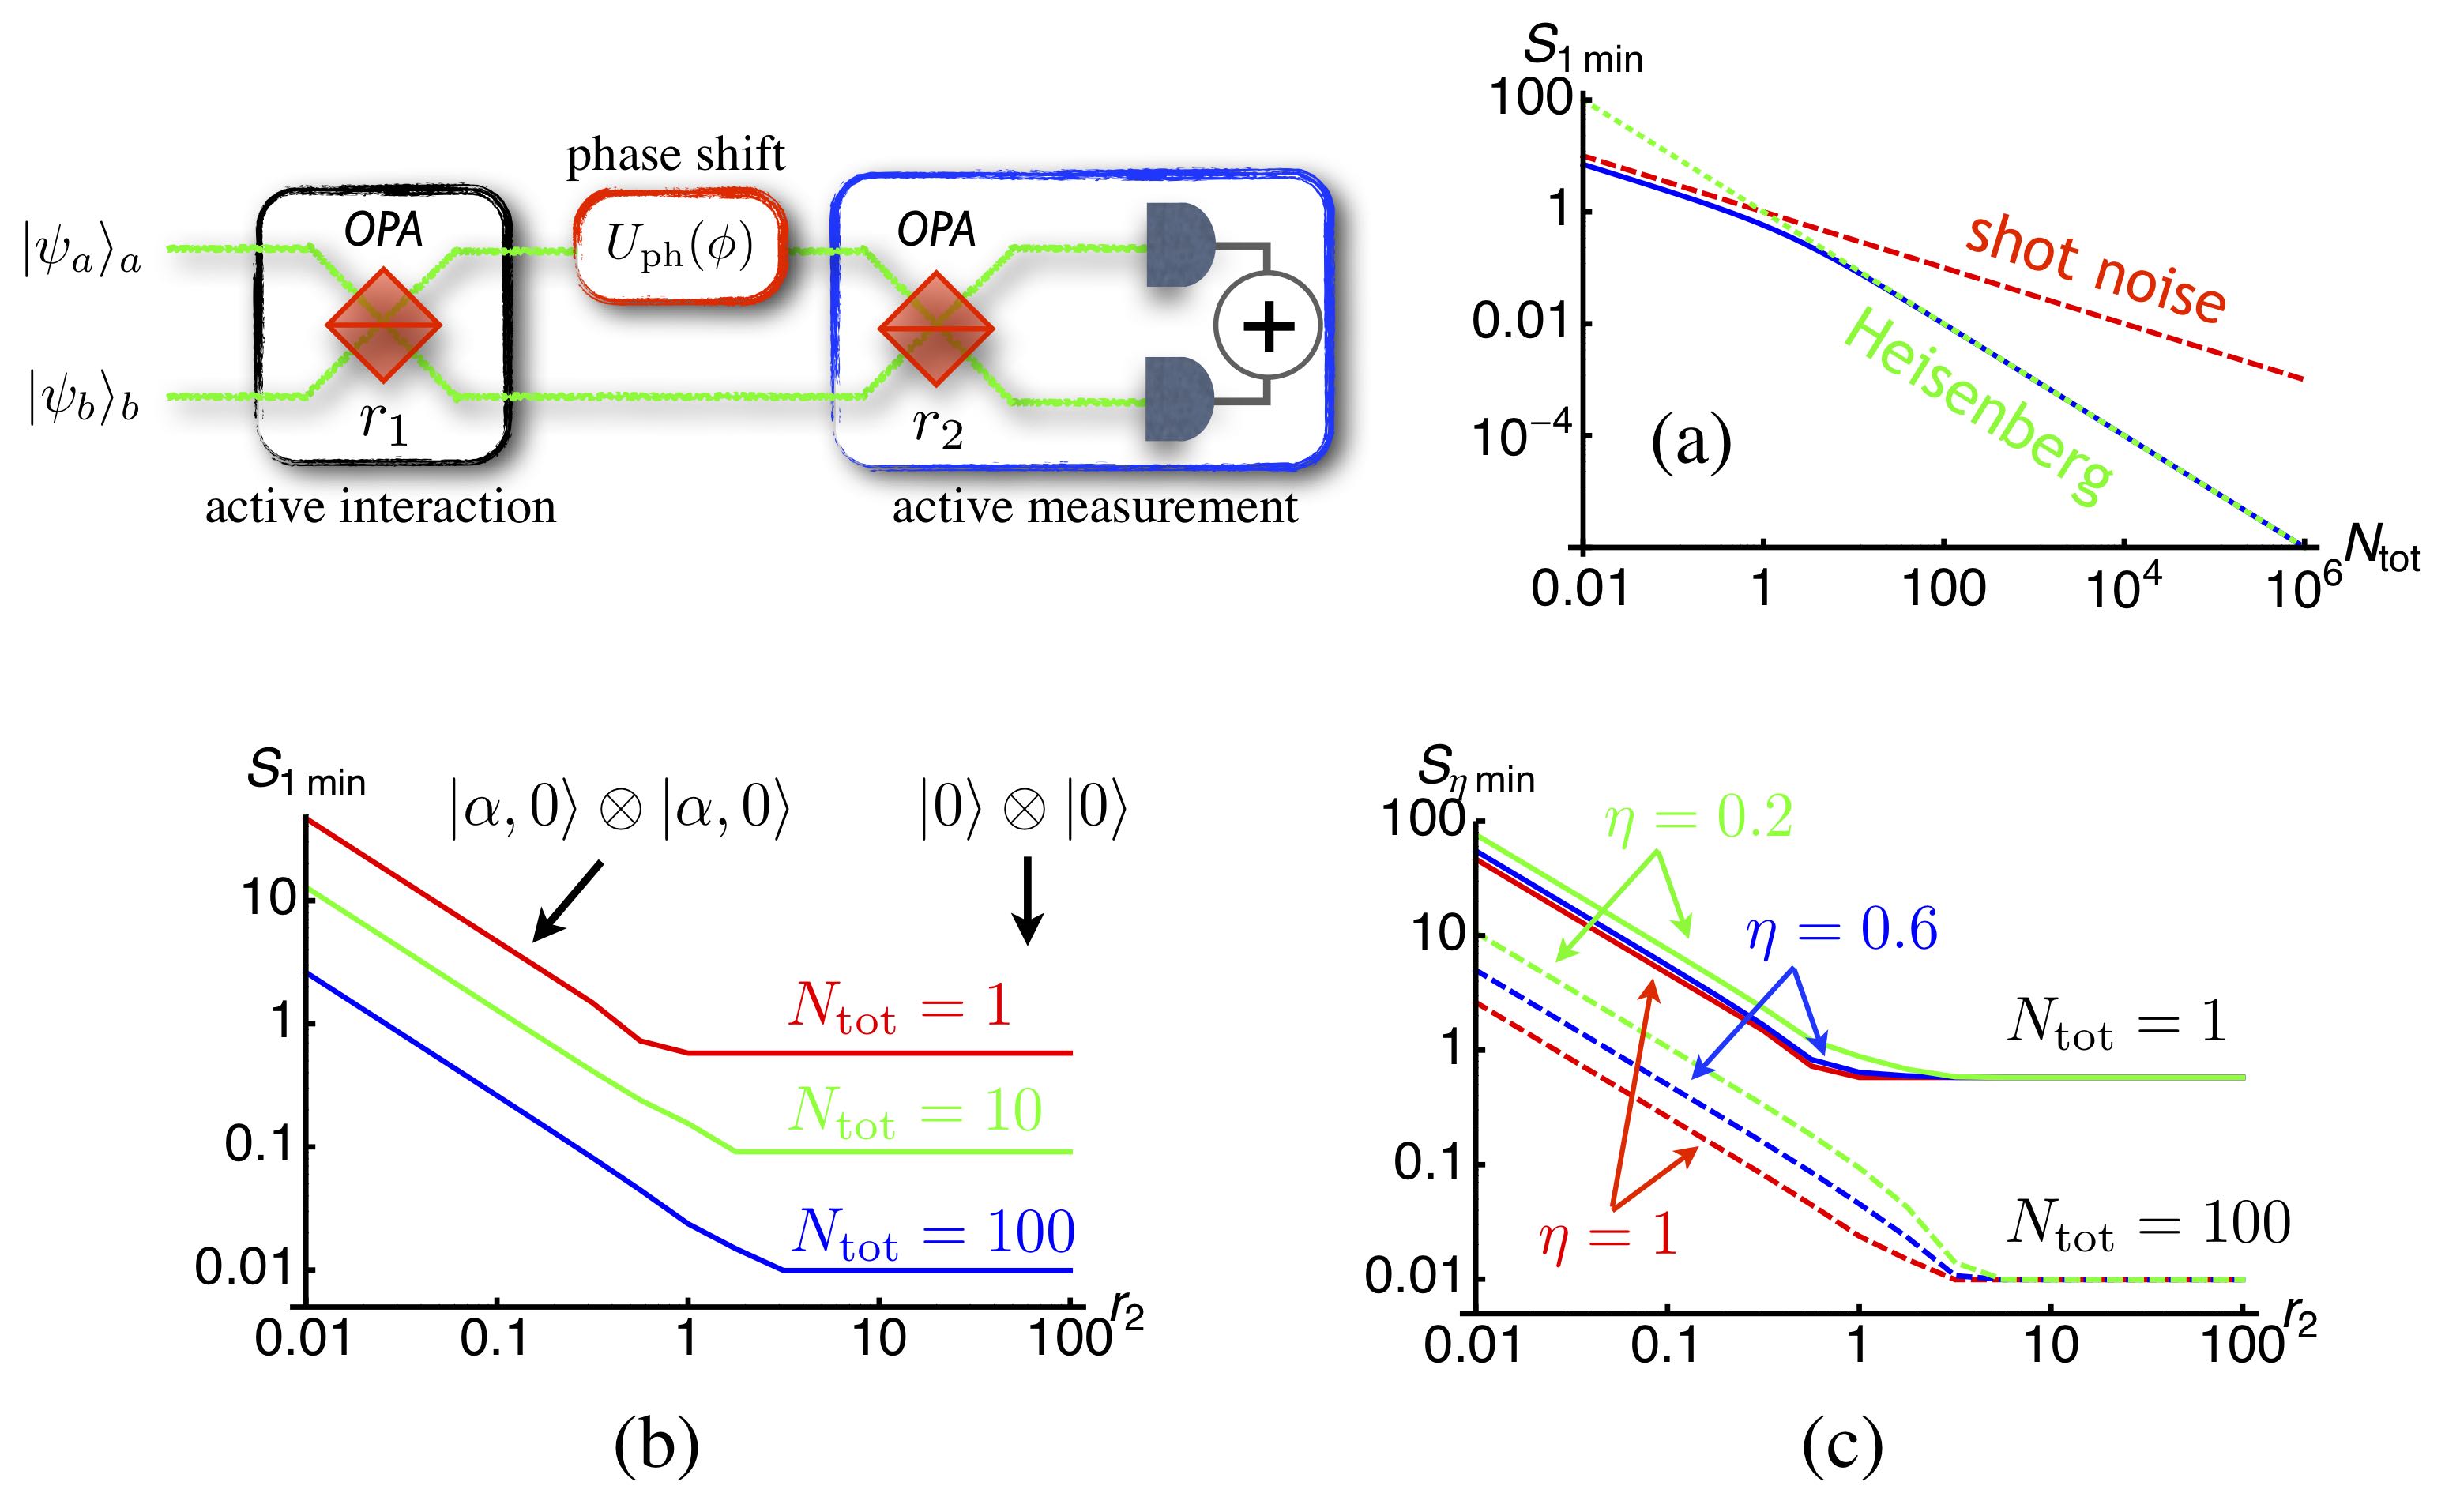
We now turn our attention to active interferometers, in which the first beam splitter of the passive ones is substituted with an OPA with squeezing parameter . The study of this kind of interferometers shows that the use of a passive detection stage does not allow to go beyond the shot-noise limit, also in the lossless case [spara:PRA]. Therefore, here we consider only the configuration with an active detection stage characterised by an OPA with squeezing parameter (see the scheme in fig. 14). Moreover, the numerical analysis proves that the sensitivity is minimised for [spara:PRA], thus we consider this regime. The result for is reported in fig. 14 (a), where we report as a function of : also in this case the Heisenberg scaling is achieved as the energy increases. Figure 14 (b) shows as a function of : it is clear that the minimum of the sensitivity is obtained when the OPA employed at the detection introduce a large number of photons (), as mentioned above. It is interesting to note that the optimal input states depend on the energy added by the active detection stage: if then we should use two coherent states with the same energy, whereas for the best choice is the vacuum state.
Finally, as in the passive/active interferometer, in fig. 14 (c) we plot as a function of and different values of and : the use of an active detection stage allows to reach the Heisenberg scaling of the lossless case also in the presence of non-unit quantum efficiency, namely (see ref. [spara:PRA]):
| (34) |
for the large energy regime .
5 Practical quantum illumination
In sections 3 and 4 we have seen that the quantum properties of light, such as the “squeezing”, can be a useful resource to enhance the sensitivity of interferometers going beyond the quantum shot-noise limit and finding applications in gravitational wave antennas [grav:11, DDR:15].
Here we focus on the use of quantum correlation and, in particular, the entanglement existing between two beams of light generated by an OPA, the so-called twin beams (see appendix LABEL:app:TWB), in order to detect the presence of an opaque object in a very noisy background.
We will describe the object as a beam splitter embedded in a background of “thermal” radiation: the problem is then to distinguish the photons scattered by the object from those belonging to the background, when the latter is predominant. This scheme is known as quantum illumination [lloyd:08, tan:08]. From the theoretical point of view, one can find an optimal strategy based on twin beams which outperforms any classical one [tan:08, sha:NJP:09]. However, this kind of receivers turns out to be very challenging from the experimental point of view [sha:NJP:09, sha:PRA:09].
In the following we show the main results one can obtain using a quantum illumination protocol based on current technology [ivano:rev, INRIM:10] which performs astonishingly better than a classical one based on classically correlated light [INRIM:13]. As a matter of fact, this protocol cannot aim to achieve the optimal target-detection bounds of ref. [tan:08], but it exhibits very large quantum enhancement and robustness against noise as in the case of the the original idea.
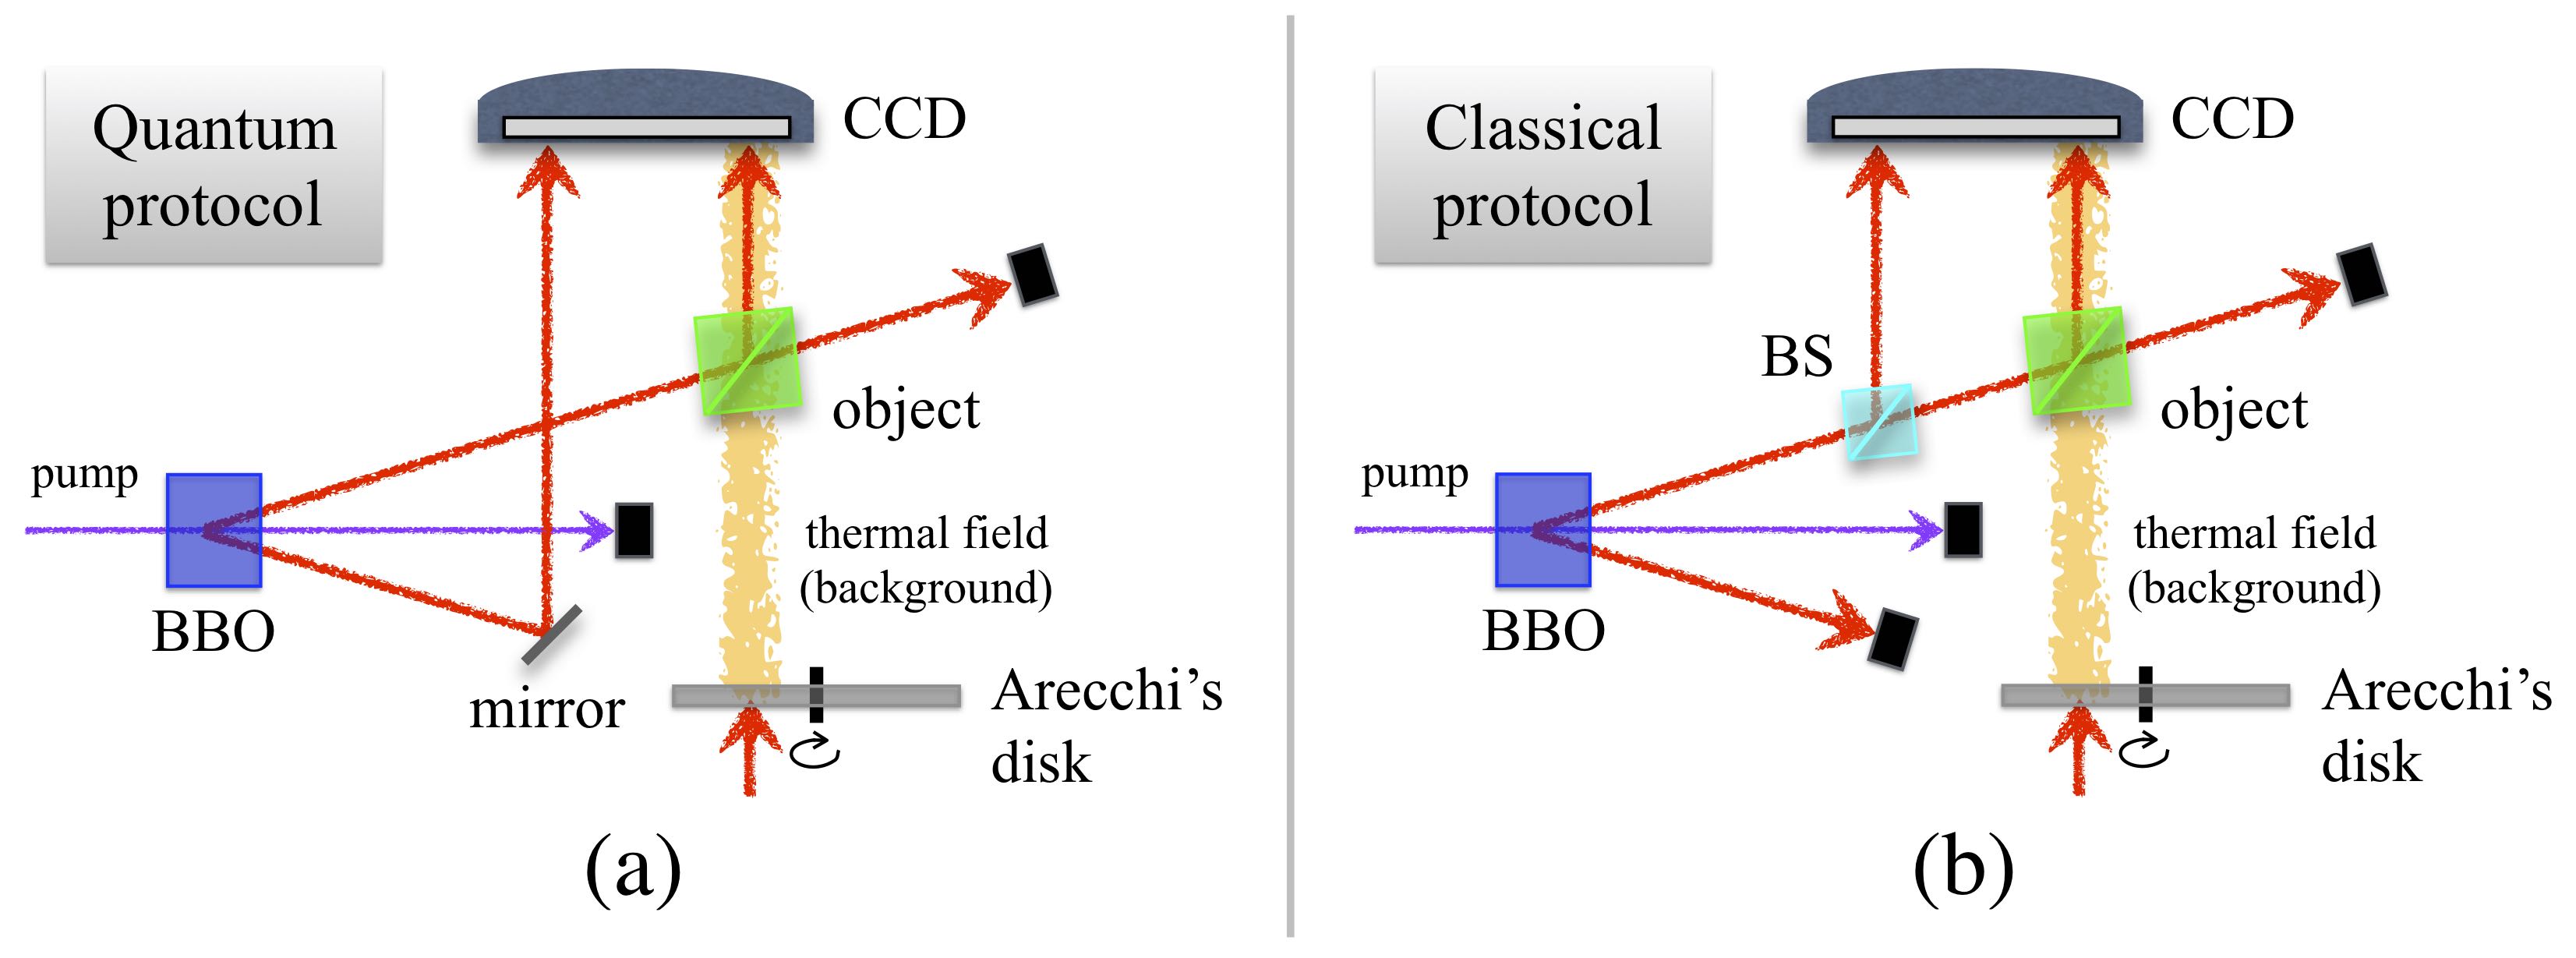
In fig. 15 we report a pictorial view of the experimental schemes used to implement the quantum illumination protocol and the classical counterpart. The twin beams are generated by a beta-barium borate crystal (BBO) with an average number of photons per spatio-temporal mode . They are then addressed to a high quantum efficiency CCD camera, able to measure the correlations between the two beams. In the quantum illumination protocol, see fig. 15 (a), an object, a 50:50 beam splitter, intercepts one of the two correlated beams and superimposes to it a thermal background produced by scattering a laser beam on an Arecchi’s rotating ground glass. We assume that the background is caracterised by an average number of photons distributed among modes. The other beam is instead directly detected.
When the beam splitter is removed, only the background reaches the detector. In the classical illumination protocol, reported in fig. 15 (b), we should substitute to the twin beams two classical correlated beams. These latter are obtained by splitting a single beam from the BBO but adjusting the pump power in order to have the same intensity, time and spatial coherence properties as in the quantum case [INRIM:13]. As shown in appendix LABEL:app:TWB, the single beam of a twin beam corresponds to a thermal state: when the thermal state is split at a beam splitter the two emerging beams are classically correlated.
Whereas the reader can find a thorough and detailed analysis of the source of the quantum enhancement in refs. [INRIM:13], [INRIM:14] and [ragy:14], here we only report the results about the error probability in the discrimination of the presence from the absence of the object. The figure of merit we used in our experiment is the correlation in the photon numbers and detected by pairs of pixels of the CCD intercepting correlated modes of beams and , respectively. In particular we focus on the covariance:
| (35) |
where is the average over the set of a given number of realisations (since the experiment uses a CCD camera, the number of realisations is the number of correlated pixels pairs) [INRIM:13] and , .
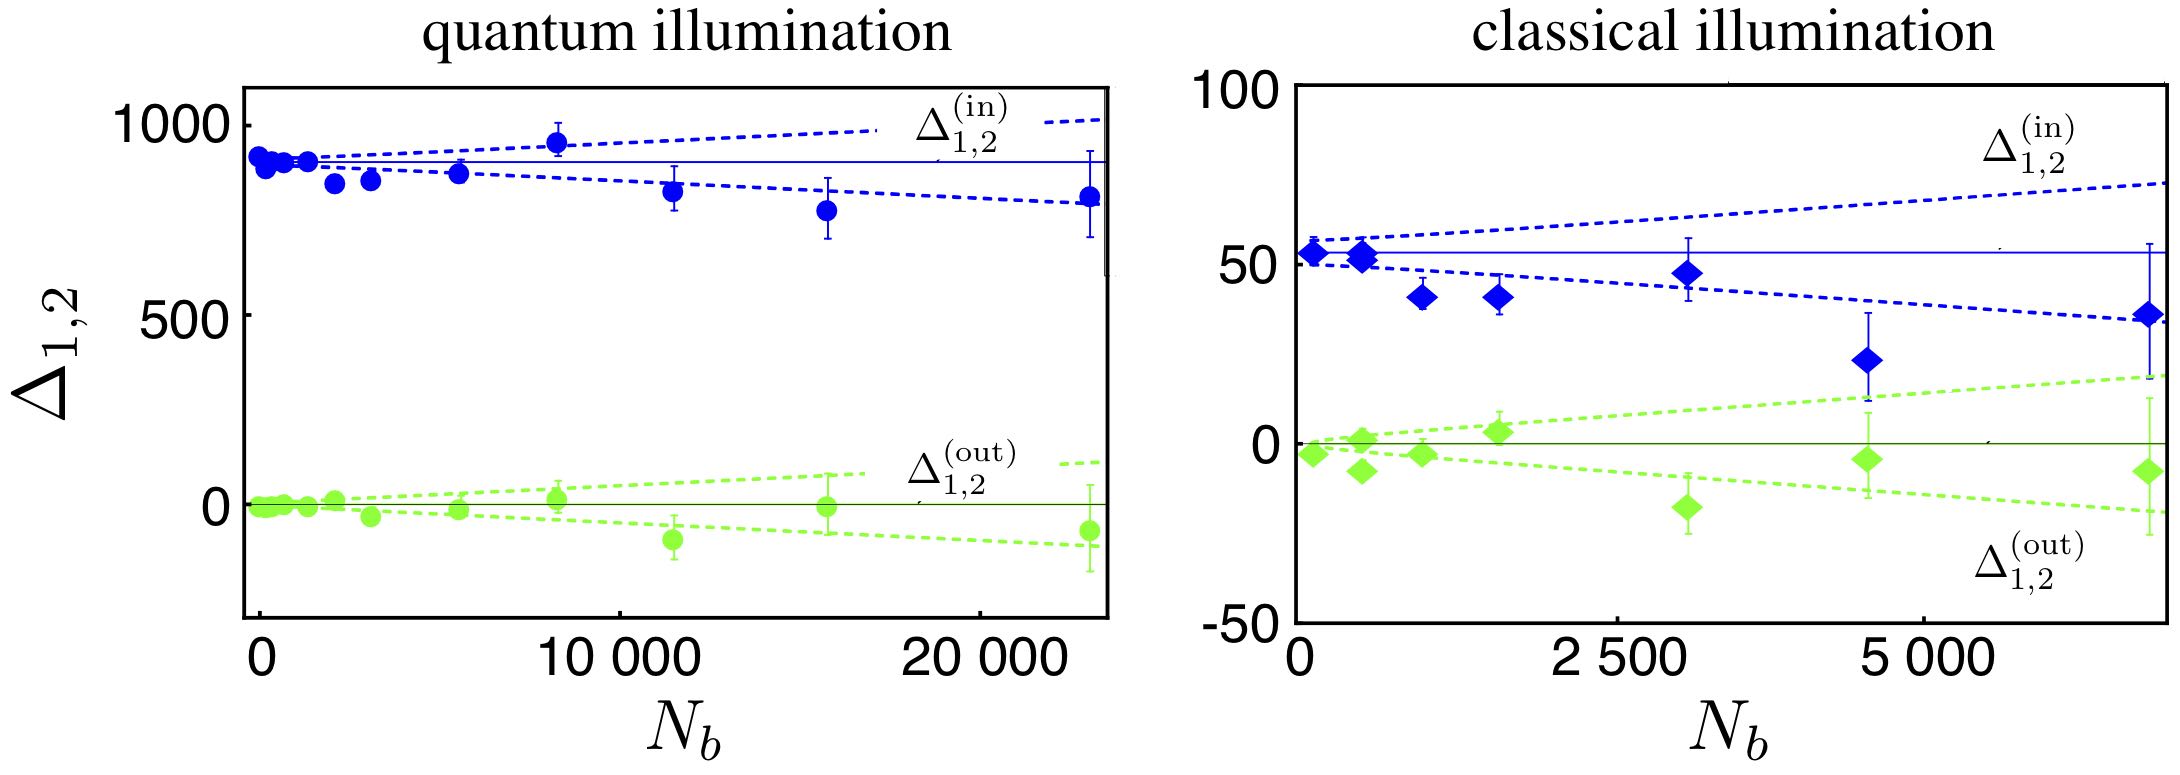
The problem of discriminating the presence from the absence of the object is then equivalent to that of distinguishing between two corresponding values of . More precisely, we can choose a threshold value of , above which we can infer that the object is present otherwise it is not. Typical results are shown in fig. 16, where the measured values of the covariance and their error bars are plotted as a function of the background photons for the quantum illumination (left panel) and classical illumination (right panel): note how the quantum protocol outperforms the classical one.
Since the experimental values unavoidably fluctuates, we have to evaluate the error probability of the discrimination, that is the probability to infer the wrong answer given a value of the covariance. If we know only the mean value and the variance of a certain quantity, we should assign a Gaussian probability distribution to that quantity according to the maximum entropy principle (see, for instance, ref. [oli:metro]). Therefore it is possible to associate a probability distribution with each point of fig. 16 and we can evaluate the error probability by fixing a threshold value of the covariance chosen in order to minimise . In fig. 17 we show as a function of for two values of the number of background modes , in the case of both the quantum illumination protocol and the classical one. We can also see that the quantum improvement becomes larger as increases. In particular, the points corresponding to have been obtained by processing the data in fig. 16 as described above.
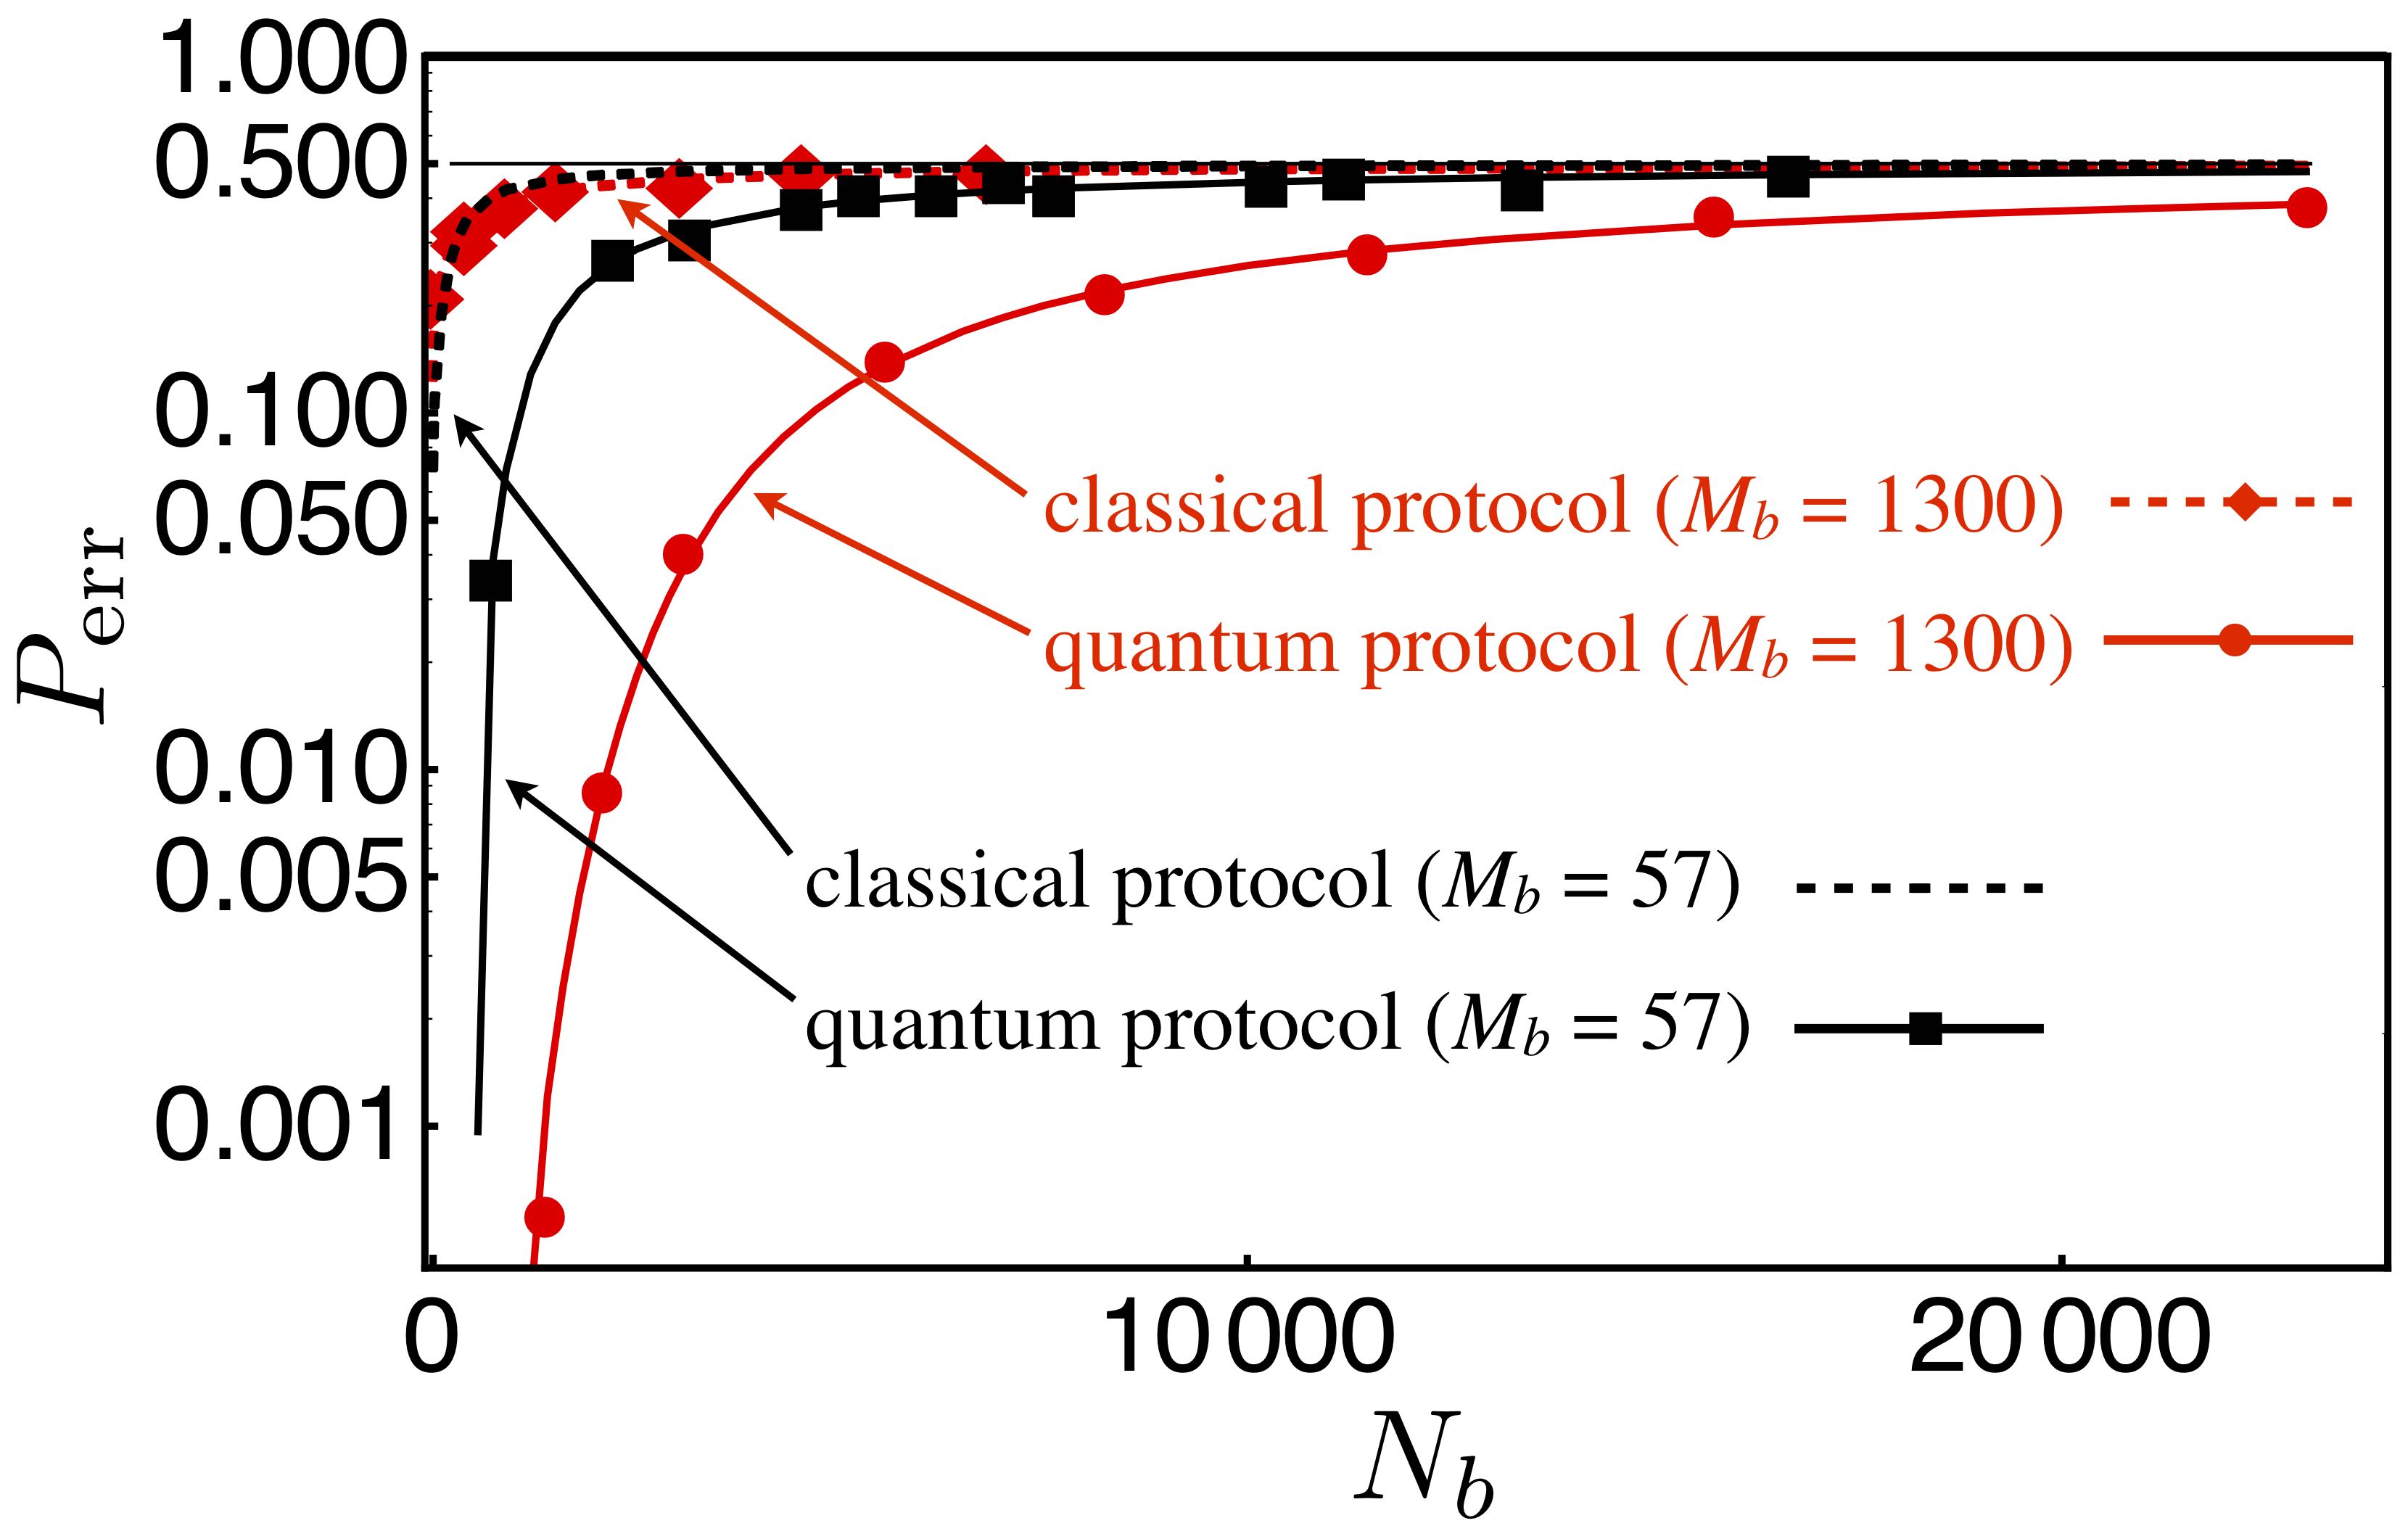
Entanglement is usually a fragile resource which should be carefully protected by the environment and, thus, the advantages of entangled and quantum states can be exploited only in advanced quantum laboratories or for academic discussions. Nevertheless, the results we presented in this section show that it is possible to obtain orders of magnitude improvements compared to the classical protocol, independent of the amount of noise and losses, by using devices available nowadays. Therefore, this kind of “practical” quantum illumination protocol based on photon counting can have interesting potentialities to promote the usage of quantum correlated light in real and more complex scenarios [microw:QI, ray:QI].
6 Beyond single-interferometer setups
In section 4 we have seen how quantum light can be exploited in interferometers to improve the estimation of an unknown phase shift also beating the shot-noise limit and, thus, opening the way to a new generation of quantum-enhanced interfereometers [grav:11]. However, as illustrated in section 5, quantum correlations between light beams can be used to successfully outperform the performance of standard imaging protocols. The question that now arises is whether it is possible to exploit quantum correlations to further improve interferometers. In fact, recently quantum correlations have received a lot of attention as a key ingredient in advanced quantum metrology protocols [adv:QM, microscopy].
In the following section we will review the main theoretical results we obtained coupling two interferometers via quantum-correlated beams. In particular, we show how protocols based on quantum-correlated interferometers lead to substantial advantages with respect to the use of classical light, up to a noise-free scenario for the ideal lossless case [coupled:13, coupled:15] also in the presence of some additional noise [benatti:17].
7 Probing the noncommutativity of position and momentum
One of the most interesting applications of interference devices concerns the quantum gravity tests. The non-commutativity at the Planck scale () of position variables in different directions gives rise to quantum fluctuations of the space geometry [aschieri:09, aschieri:10] which, under particular conditions, could lead to detectable effects in cavities with microresonators [aspel:12] or in two coupled interferometers, the so-called holometer [hogan:12, holo:16]. In the latter case, the predicted non commutativity leads to an additional phase noise, the “holographic noise”.
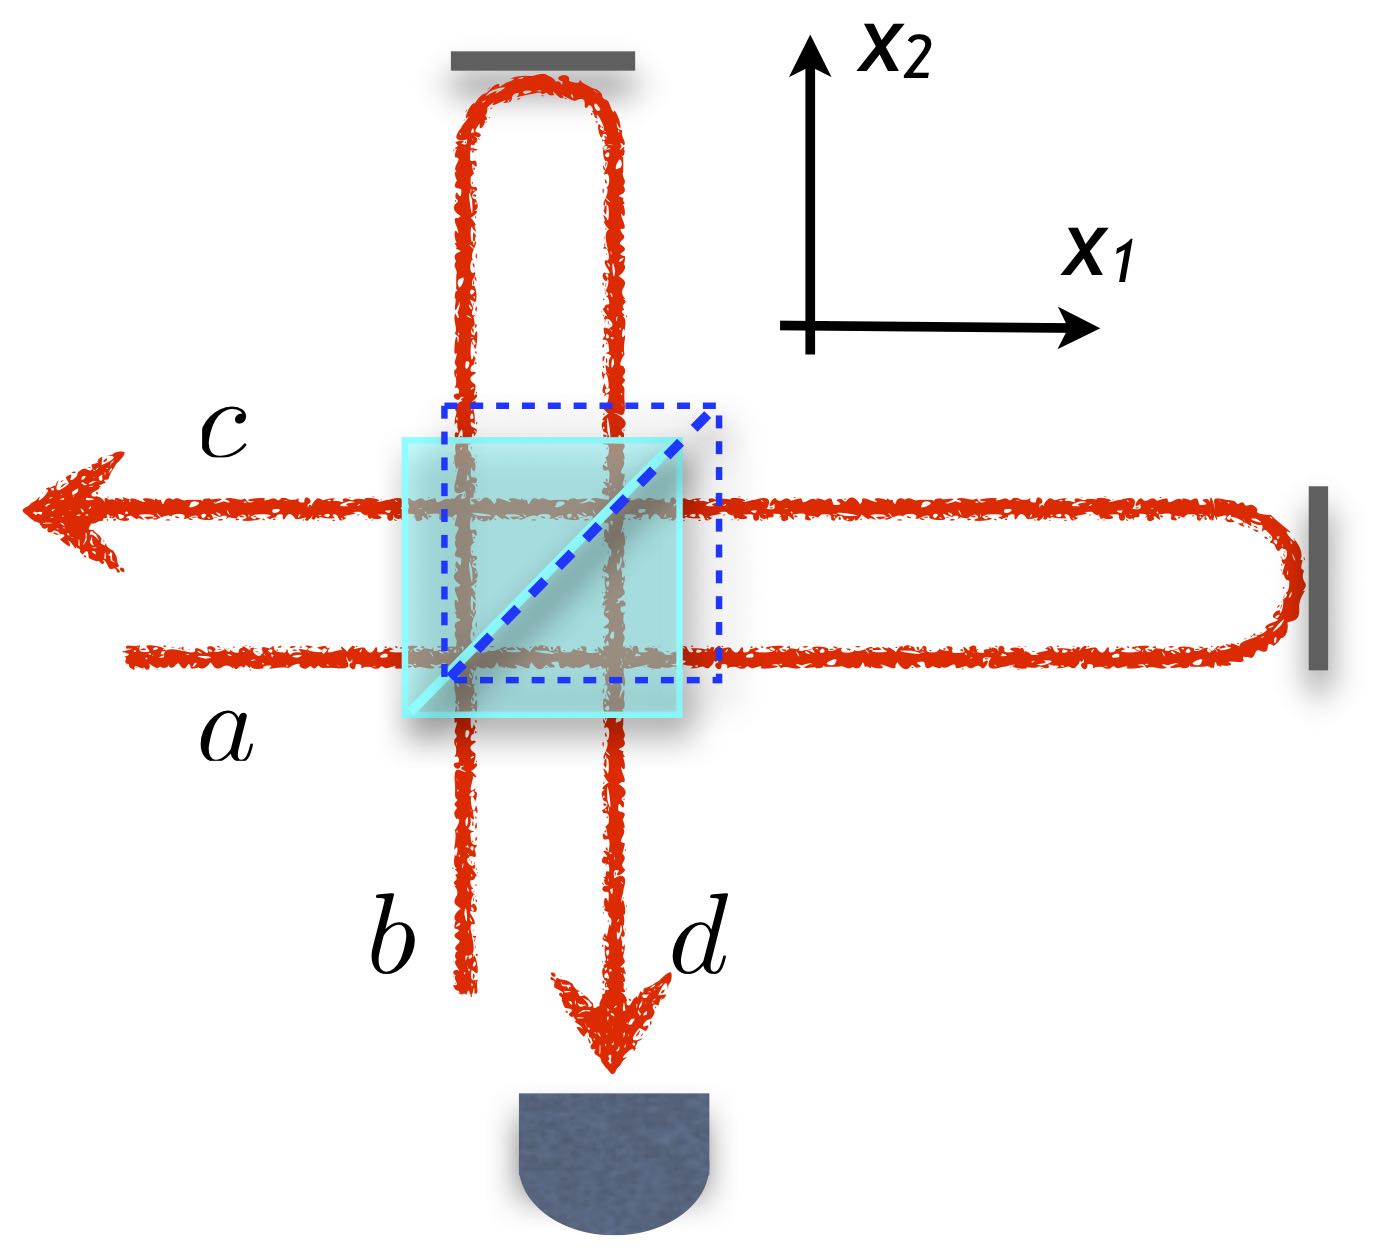
If we consider a single interferometer based on a single beam splitter, such as the Michelson interferometer sketched in fig. 18, in the presence of the holographic noise the jitter in the beam splitter position leads to fluctuations of the measured phase. Since, the phase shift can be seen as a measurement of the beam splitter position, the phase fluctuations are directly related to the fluctuations of the coordinate , , being the length of the interferometer’s arm (for the sake of clarity we recall that m for GEO600 and km for LIGO) [hogan:12]. Therefore, the holographic noise accumulates as a random walk and becomes detectable.
Unfortunately, the most precise interferometers able to detect gravitational waves have a resolution at low frequencies not enough to detect the holographic noise (the interested reader can find plenty of details about the holographic noise and its origin in ref. [hogan:12]). Nevertheless, it could be possible to identify this noise by evaluating the cross-correlation between the two equal interferometers of the holometer when placed in the same space-time volume: while the shot noises of the interferometers are uncorrelated and do vanish over a long integration time, the holographic noises are not. Moreover, one can also “turning off” the holographic fluctuations by separating the space-time volumes, thus obtaining a background estimation. As a matter of fact, the ultimate limit for the holometer sensibility is related to the shot noise. In the following we will discuss how it could be possible to go beyond this limit by using the quantum optical states we introduced in section 4 in the case of a single interferometer.
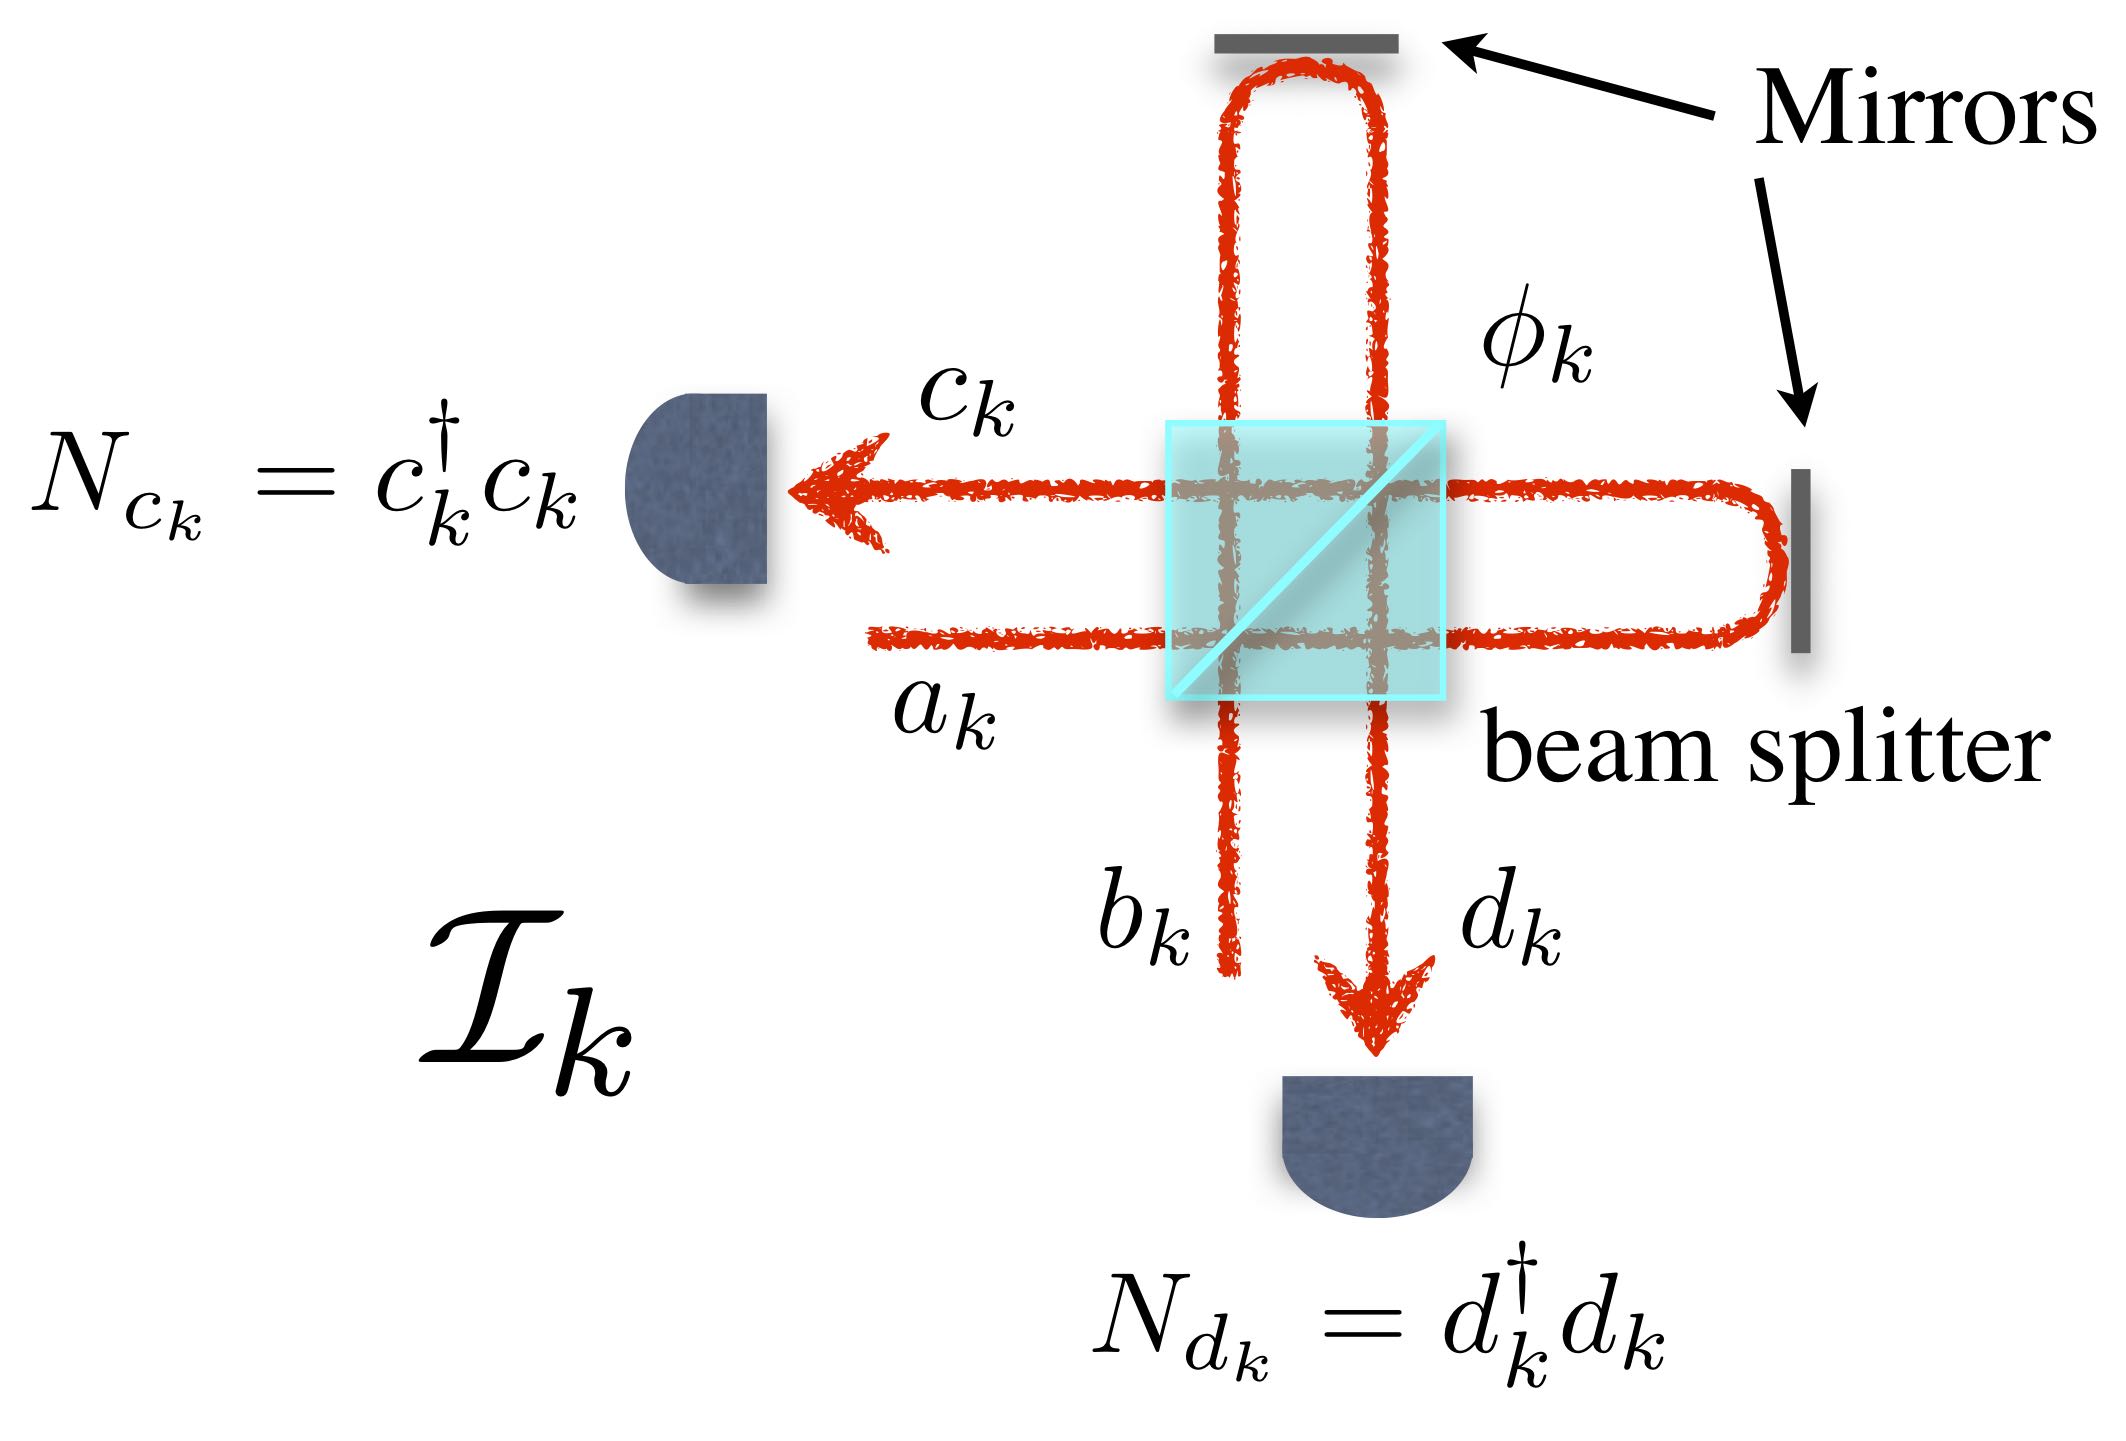
We consider two Michelson interferometers , , as shown in fig. 19, where we reported the involved modes and the measured number operators at the outputs. The -th interferometer detects the phase shift . We are interested in a joint measurement, thus we should consider a suitable operator with expectation
| (36) |
where is the overall density matrix associated with the four-mode state of the light beams injected into the two interferometers and .
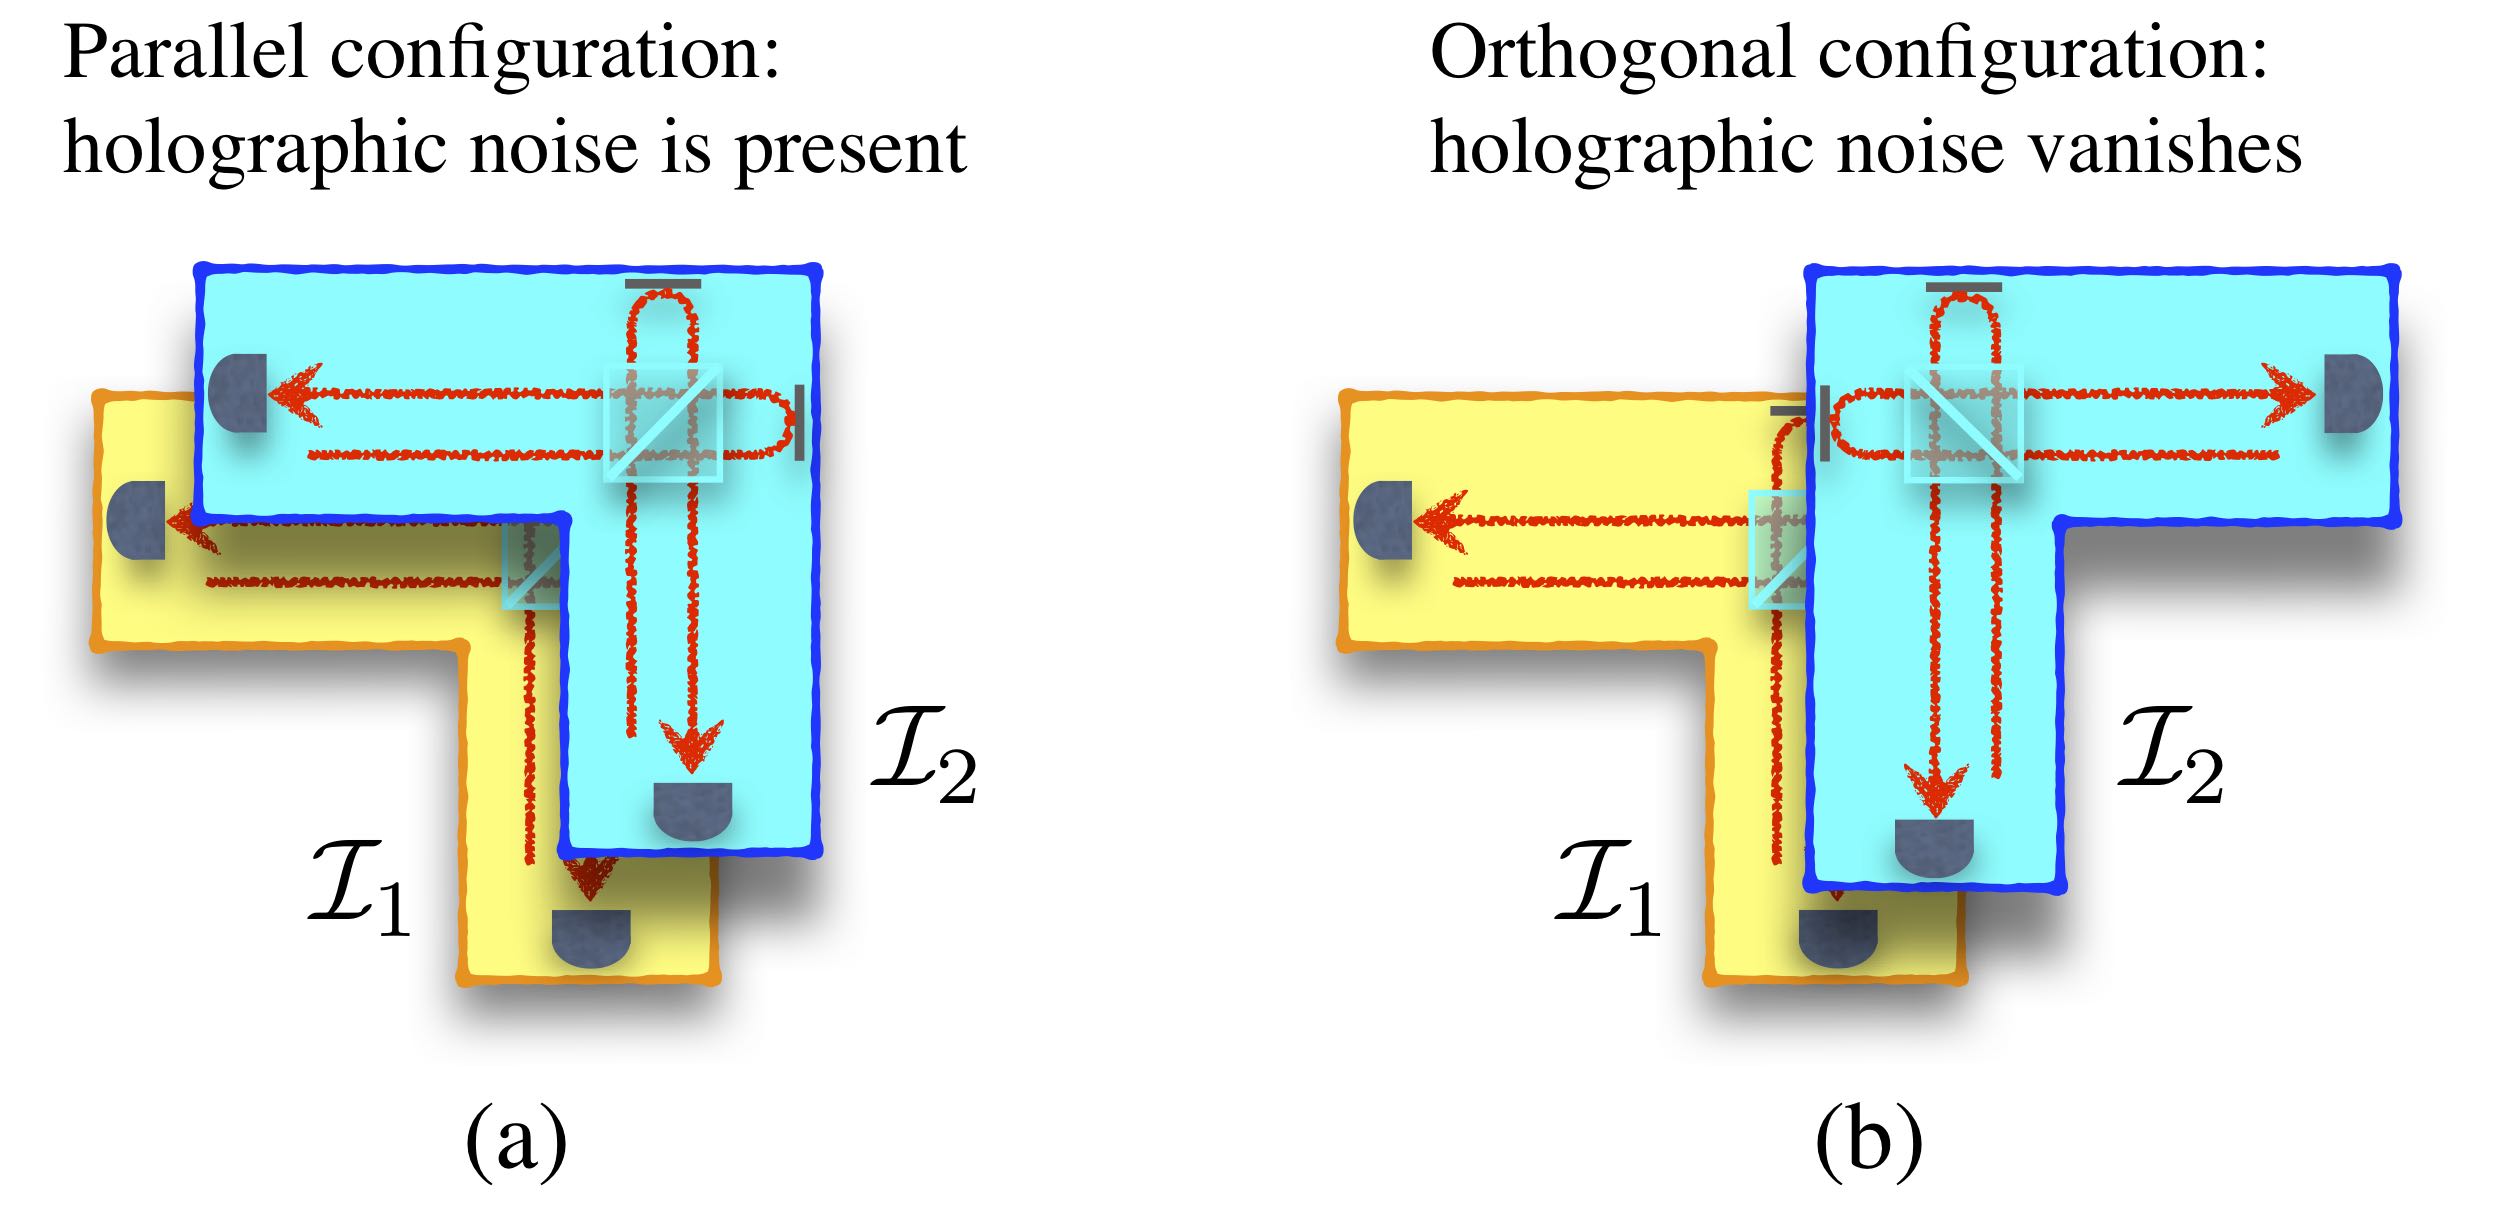
The two configurations used to observe the holographic noise are depicted in fig. 20. Figure 20 (a) shows the parallel configuration, in which the two interferometers occupy the same space-time volume: in this case the holographic noise induces the same fluctuation on the phase shift, thus leading to a correlation of the intensity fringes. When the interferometers are in the orthogonal configuration, fig. 20 (b), their space-time volumes are no longer overlapping and the correlation induced by the holographic noise vanishes: this can be used as a reference, that is a measurement of the “background”.
Following ref. [coupled:13], we can describe the statistical properties of the phase shift fluctuations induced by the holographic noise by means of a suitable probability density function , . Of course, since if we address the single interferometer we cannot distinguish between the two configurations, given the marginals:
| (37) |
with and , we should have:
| (38) |
on the other hand, since in the orthogonal configuration there are not correlations between the two interferometers, we should also require:
| (39) |
Therefore, the actual expectations of an operator , which depends on the phase shifts, should be averaged over , namely:
| (40) |
The information about the correlation between the two phases, can be obtained by estimating the covariance in the parallel configuration, i.e. , where
| (41) |
and we introduced the central phase measured by the -th interferometer. In the limit we can write [coupled:13]:
| (42) |
and we clearly see that the covariance can be estimated by measuring the difference between the expectation values of the operator in the two configurations.
In order to observe the holographic noise, we should minimize the uncertainty associated with the measurement of the covariance, which reads (still in the limit ):
| (43) |
with . Since
| (44) |
the zero-order contribution to the uncertainty reduces to:
| (45) |
It is worth noting that , that is the main contribution to the uncertainty, does not depend on the fluctuations induced by the holographic noise, but only on the intrinsic fluctuations due to the chosen measurement and to the state sent through the interferometers. As we have also seen in sections 3 and 4, the choice of the measurement is strictly related to the input state and, in the following, we will show that squeezing and entanglement can provide huge advantages in terms of the achieved accuracy with respect to classical light [coupled:13].
We start considering that the two-mode input state of the -th interferometer is exited in a coherent and a squeezed vacuum state with mean number of photons and , respectively (see appendices LABEL:app:CS and LABEL:app:SQ). As discussed in section 4, in this case the value of can be retrieved assessing the difference of the number of photons in the two output ports of the interferometer . Therefore, we can now define:
| (46) |
where
| (47) |
If we assume and , and consider the optimal working regime , we obtain [coupled:13]:
| (48) |
which, in the limit , becomes:
| (49) |
It is thus clear the advantage with respect to the classical case in which only coherent states are used. Nevertheless, in this latter case it is worth noting that the measurement on the covariance, involving second-order momenta, leads to a scaling instead of as in the case of the single interferometer.
Though the use of squeezing leads to an advantage with respect to the classical scenario, the improvement is due to the independent improvement of the two single interferometers. Here, however, we are interested in minimising the noise of the correlation between the interferometers. It is thus natural to investigate whether the use of quantum correlated states coupling the two interferometers can produce further improvement.
Let’s now suppose to couple and by exciting their input modes and (see fig. 19) in the twin-beam state introduced in section 4 (see also appendix LABEL:app:TWB) which we rewrite as::
| (50) |
where is still the average number of photons of each mode and
| (51) |
Due the symmetry between the two modes we have the peculiar property:
| (52) |
As in the previous case, we assume to send in the other input ports of the interferometers two equal coherent states with average number of photons . Overall, we have the four-mode input state:
| (53) |
If we choose the working regime and, of course, in the absence of the holographic noise, the two interferometers of the holometer behave like two completely transparent media, as one can easily check from the input-output relations (3): the output modes and , coming from and , respectively, exhibit perfect correlation between the number of photons.
If we now define the observable
| (54) |
where , we have in eq. (45), whereas the denominator reads:
| (55) |
Therefore, if we find the striking result:
| (56) |
Remarkably, the perfect correlation existing between the two beams leads to a vanishing zero-order contribution to the uncertainty of the covariance. In this scenario any very faint perturbation which correlates the interferometers can be detected, since it cannot be masked by a residual noise. We note that in the presence of fluctuations due to the holographic noise, a little portion of the coherent states is reflected to the monitored ports, thus guaranteeing the sensitivity to the covariance of the holographic noise phase shift.
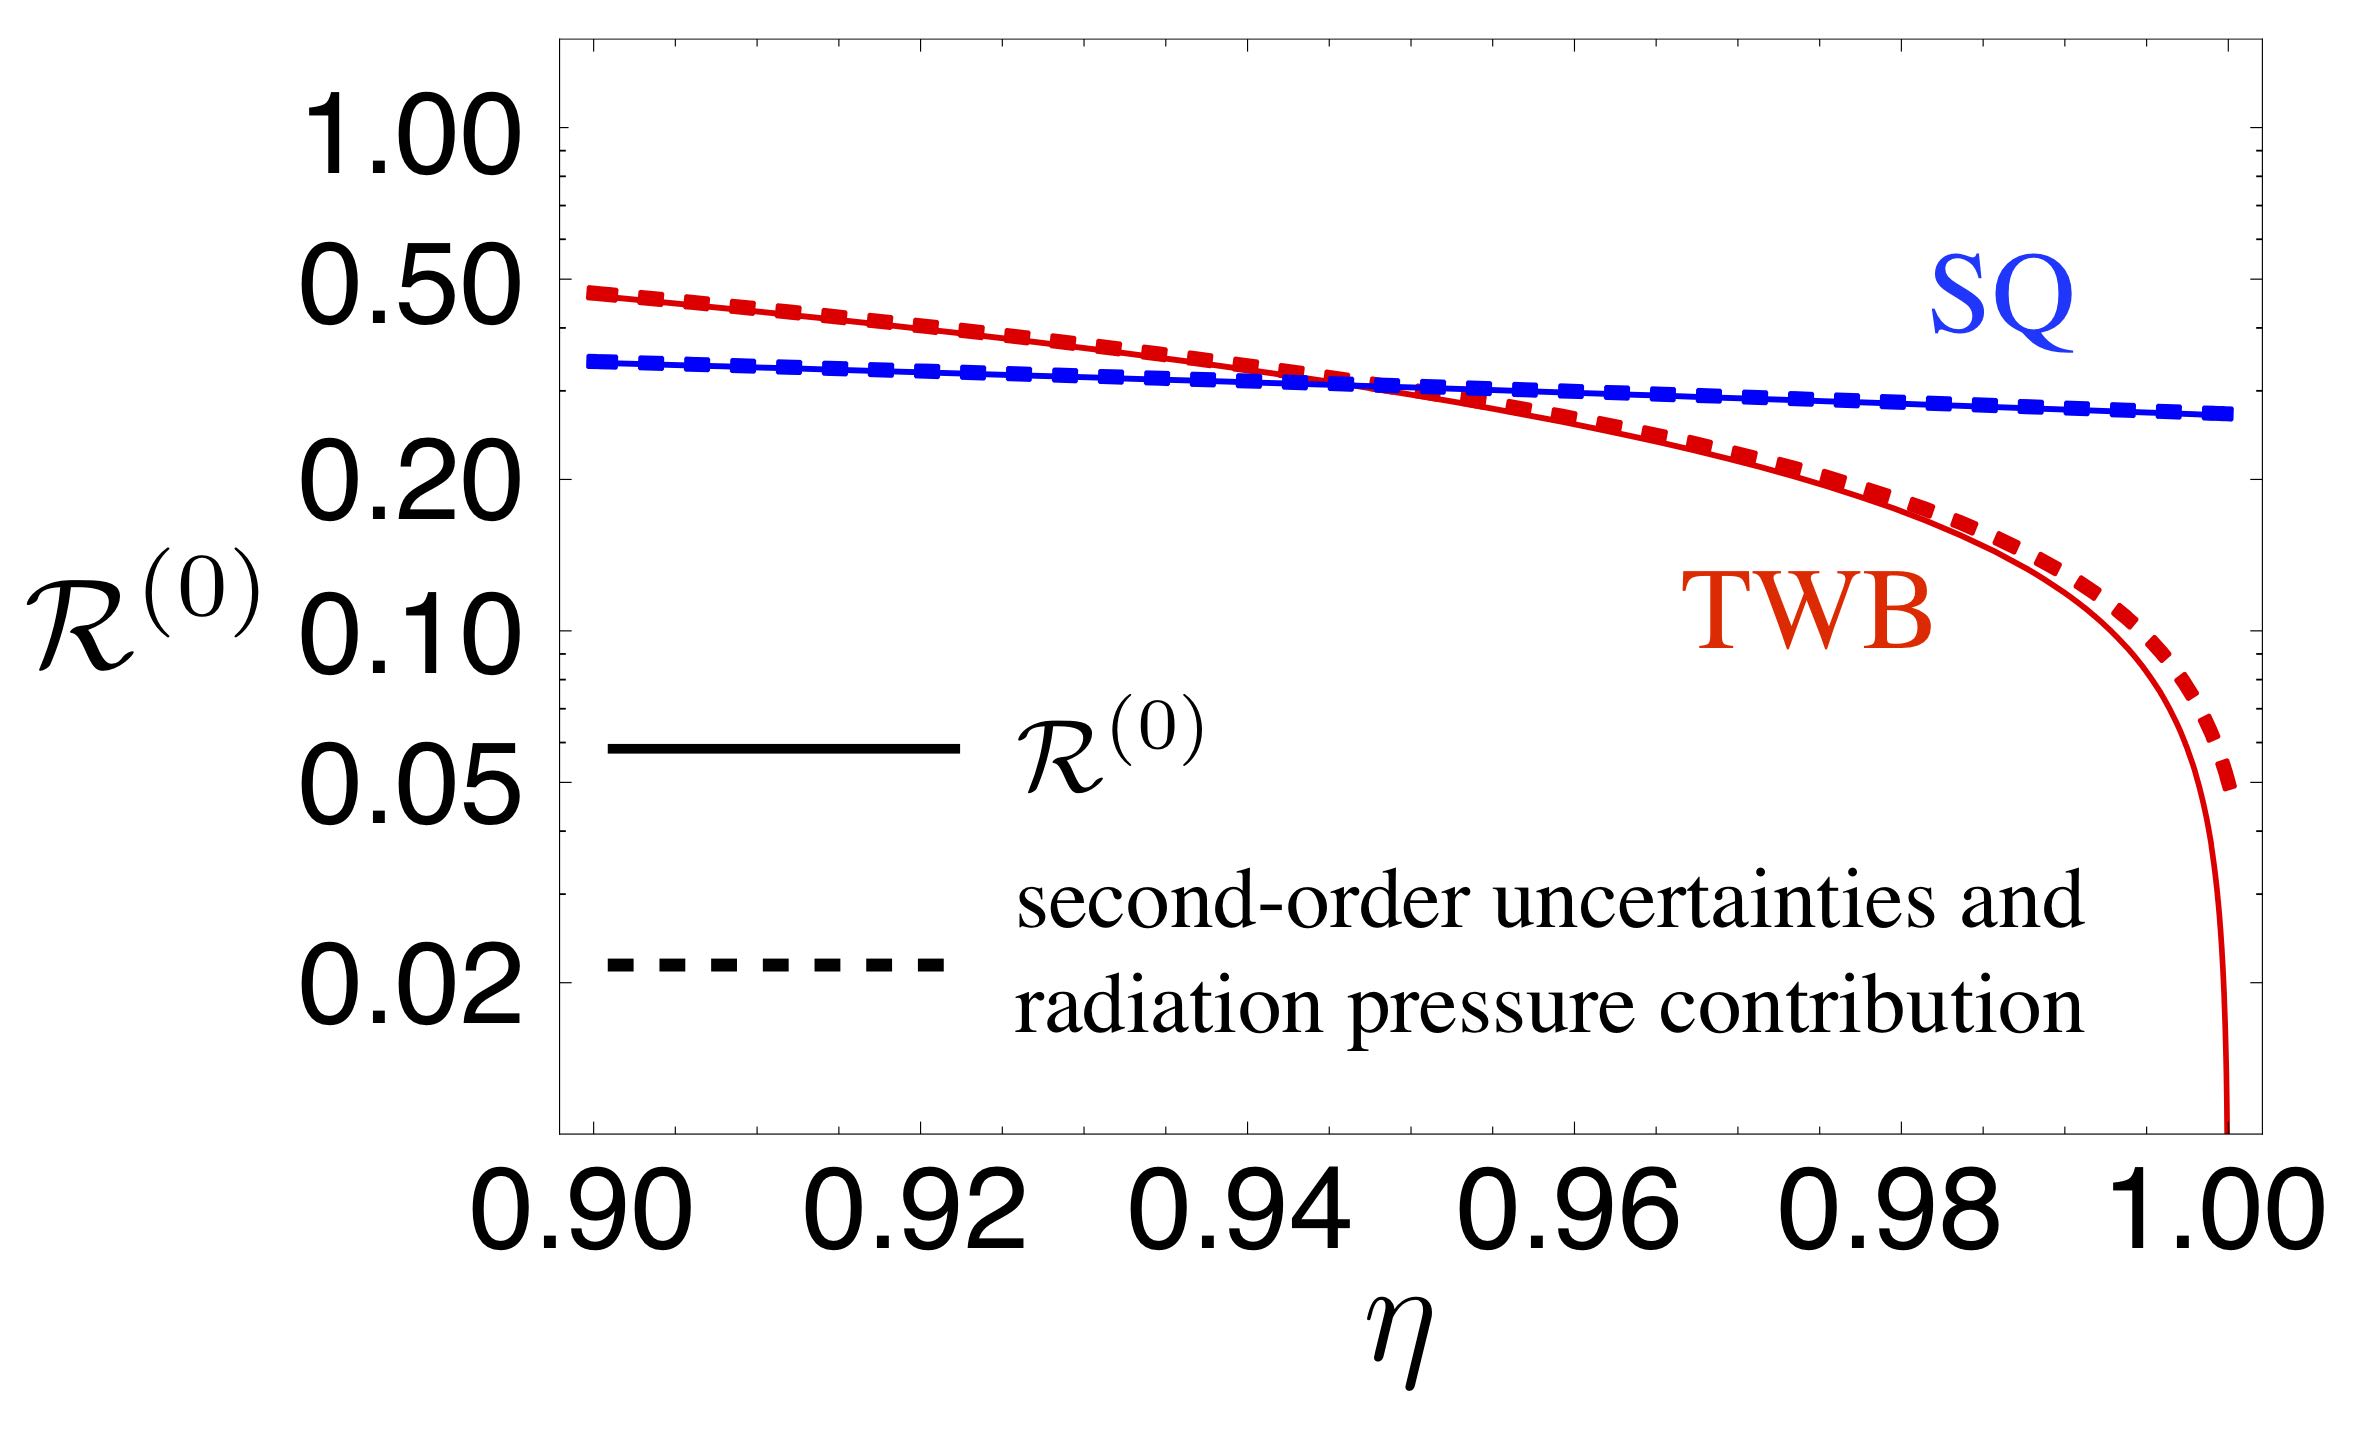
As a matter of fact, in real experiments we should also consider other effects which may affect the ideal results obtained above. One of the main contribution which can increases the uncertainty of the covariance measurement is a non-unit overall transmission-detection efficiency (see appendix LABEL:app:eta). In fig. 21 shows the ratio
| (57) |
as a function of for the squeezed vacua and the twin beams (solid lines). We can see that there exists a threshold on (that depends on the other involved parameters) above which the measurement involving the twin beams outperforms both the classical strategy and the one based on uncorrelated squeezed vacua. In this region of high efficiency we have a significant reduction of the uncertainty. Moreover, our analysis proves that also below that threshold nonlcassical squeezed light beats the performance of classical coherent light. In the limit and (as considered in fig. 21), we find:
| (58) |
whereas
| (59) |
and an improvement with respect the classical case can be obtained for . On the other hand, if we obtain
| (60) |
and
| (61) |
Therefore, also in this case we the approach based on twin beams outperforms the classical one (for ) and the uncertainty drop to zero as .
For the sake of completeness, in fig. 21 we also plot the uncertainty reduction normalised to as a function of (dashed lines) considering the second-order uncertainties and the radiation pressure contribution [caves:81]. We recall that in the case of a single interferometer fed by squeezed light, the amplitude of the noise due to the radiation pressure decreases as the squeezing parameter increases. In the present case we have an analogue behaviour. If we consider reasonable values of the involved parameters, the radiation pressure noise is completely negligible. We can see in fig. 21 that for the realistic parameters we have chosen we have just a very small correction. The reader can find further details about this last point in ref. [coupled:13].
Remarkably, our results not only demonstrate that the use of quantum and entangled states of light allows reaching much higher sensibility for the realisation of experiments to test quantum gravity, but also put forward new opportunities for the design of innovative interferometric schemes, as we will discuss in the next section.
8 Squeezed and entangled light in correlated interferometry
The experimental requirements to implement the double-interferometer setup introduced in the previous section are extremely challenging. In particular, one should control the working regimes of the interferometers with a very high accuracy in order to obtain the huge advantages given by twin beams. Moreover, the quantum efficiency must be greater than (see fig. 21).
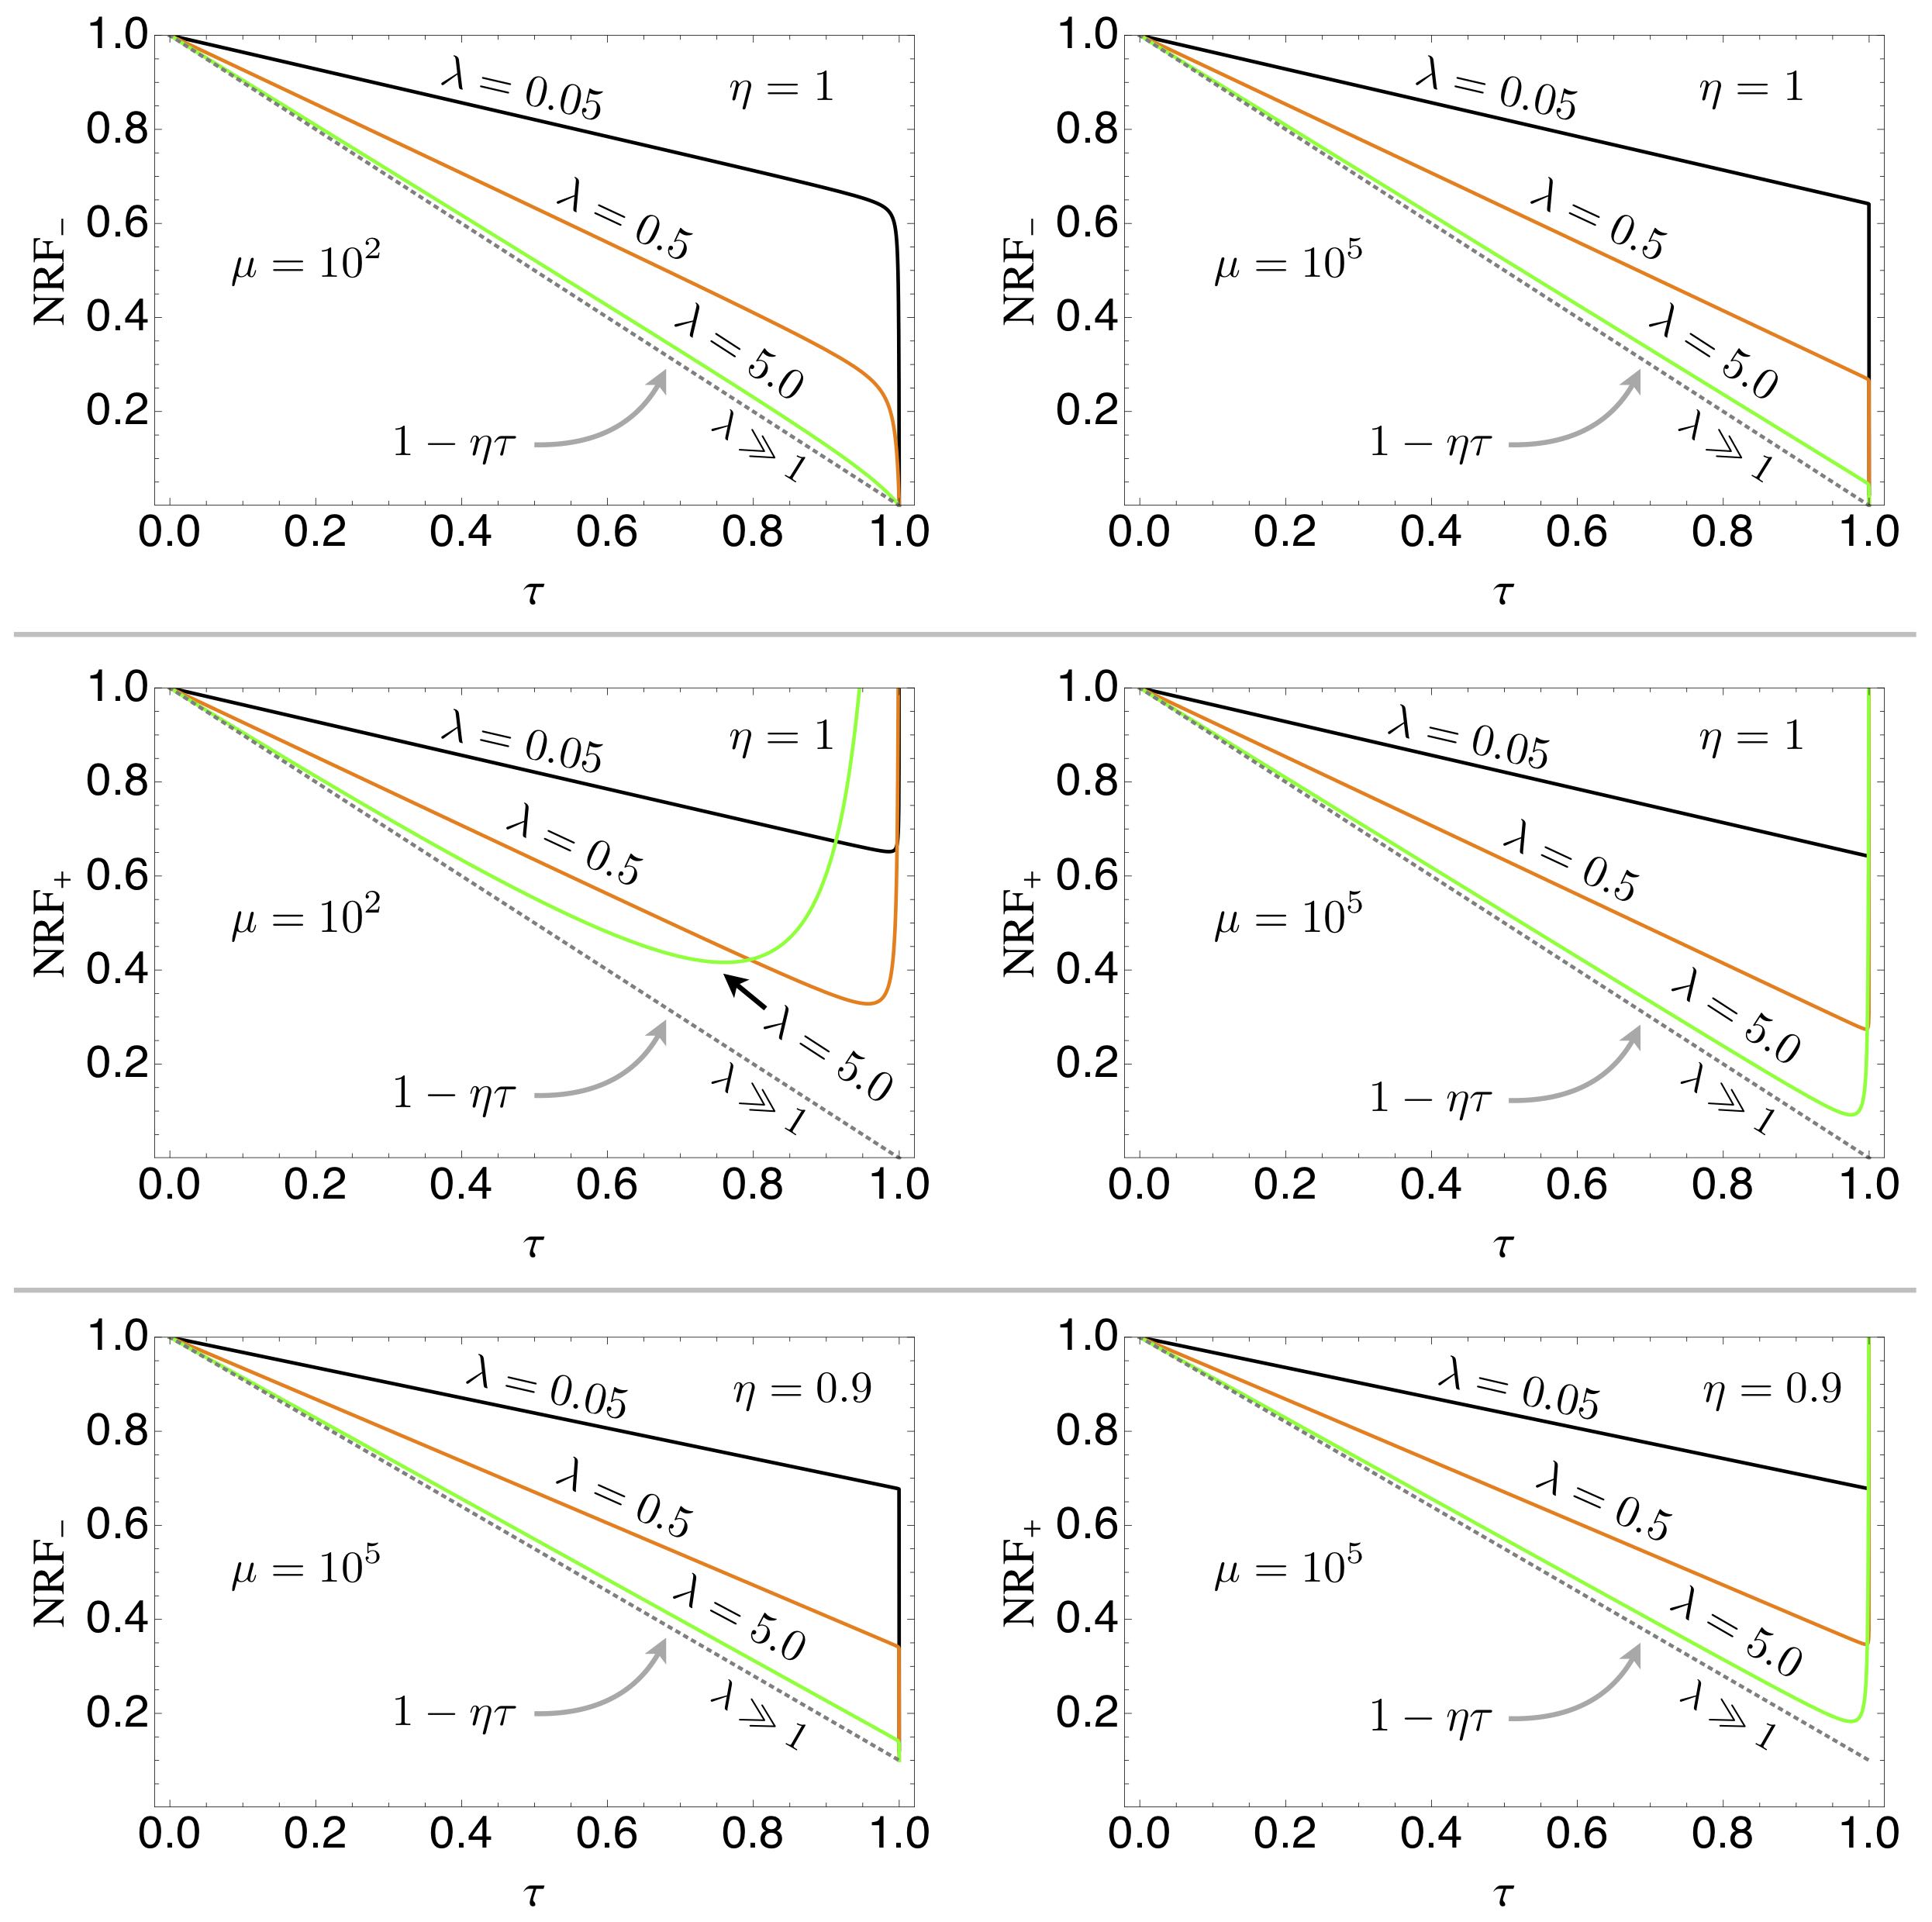
We have seen that to exploit the twin-beam properties to reduce the uncertainty in the covariance measurement, we should choose a regime in which the interferometers act like transparent media. We recall that if is the measured phase, the interferometer is equivalent to a beam splitter with transmissivity (the interferometer transmission). The coherent amplitude which usually circulates in the interferometers is so high that also a small reflection probability can send to the measured ports a really high number of photons. For instance, if only coherent states with energy are considered and, therefore, the input state is
| (62) |
we have
{eqnletter}
⟨N_k⟩^coh_ητ_k
&= ⟨δN_k ^2⟩^coh_ητ_k
= ημ(1-τ_k),
⟨δN_1 δN_2⟩^coh_ητ_1τ_2 ≡ 0,
where , , ,
and is the quantum efficiency of the detectors (see appendix LABEL:app:eta).
We assume, for the sake of simplicity, that they have the same quantum efficiency.
On the other hand, when we send only the twin beams to correlate the
interferometer the four-mode input state is
| (63) |
and we find
{eqnletter}
⟨N_k ⟩^TWB_ητ_k &= ητ_kλ ,
⟨δN_k ^2⟩^TWB_ητ_k =
ητ_k λ(1+ητ_k λ) ,
⟨δN_1 δN_2⟩^TWB_ητ_1τ_2 =
η^2τ_1τ_2λ(1+λ) ,
where we used the same parametrization as in section 6.
Following Ref. [coupled:15], we introduce the noise reduction parameter
| (64) |
that is the ratio between the variance of the sum or difference between the detected photon numbers and the corresponding shot-noise limit. Since a value is a signature of nonclassical correlations while denotes anticorrelations of the photon number beyond the classical limits, we can use as a figure of merit for the correlations at the output ports.
