On the magnetic field of the first Galactic ultraluminous X-ray pulsar Swift J0243.6+6124
Abstract
We report on the monitoring of the final stage of the outburst from the first Galactic ultraluminous X-ray pulsar Swift J0243.6+6124, which reached 40 Eddington luminosities. The main aim of the monitoring program with the Swift/XRT telescope was to measure the magnetic field of the neutron star using the luminosity of transition to the “propeller” state. The visibility constraints, unfortunately, did not permit us to observe the source down to the fluxes low enough to detect such a transition. The tight upper limit on the propeller luminosity erg s-1 implies the dipole component of the magnetic field G. On the other hand, the observed evolution of the pulse profile and of the pulsed fraction with flux points to a change of the emission region geometry at the critical luminosity erg s-1 both in the rising and declining parts of the outburst. We associate the observed change with the onset of the accretion column, which allows us to get an independent estimate of the magnetic field strength close to the neutron stars surface of G. Given the existing uncertainty in the effective magnetosphere size, we conclude that both estimates are marginally compatible with each other.
keywords:
accretion, accretion discs – pulsars: general – stars: magnetic field – stars: neutron – X-rays: binaries – pulsars: individual: Swift J0243.6+61241 Introduction
The transient X-ray pulsar Swift J0243.6+6124 was discovered by the Swift/XRT telescope (Kennea et al., 2017) after an alert generated by the MAXI monitor on 2017 September 29 (Sugita et al., 2017). Spin period of the neutron star (NS) was measured at 9.68 s (Kennea et al., 2017; Jenke & Wilson-Hodge, 2017). Analysis of the observed spin frequency changes allowed also to determine orbital parameters of the system using the Fermi/GBM data, which revealed a low-eccentric orbit () with period 28 d (Doroshenko et al., 2018; Jenke et al., 2018).
Based on the optical spectroscopic observations, Kouroubatzakis et al. (2017) suggested that optical counterpart in the system is late Oe- or early Be-type star. The Be/X-ray binary (BeXRB) nature of the source was later confirmed by Bikmaev et al. (2017). With peak flux reaching erg s-1 cm-2 in the outburst maximum, the source represents one of the brightest X-ray sources and the brightest BeXRB ever observed. The distance to the source was independently estimated using the X-ray and optical observations. Optical photometry and spectroscopy obtained from the RTT-150 and BTA telescopes allowed to estimate the mass M⊙ and radius R⊙ of the Be counterpart, which implies the distance to the source of about 2.5 kpc (Bikmaev et al., 2017). On the other hand, analysis of the pulsars spin-up rate as a function of luminosity performed by Doroshenko et al. (2018) implies a lower limit on distance of kpc. This disagreement was finally resolved by the Gaia observatory measured distance to the system of kpc111obtained as a median value, assuming the priors recommended by the Gaia team, with the errors given at 16th and 84th percentile (van den Eijnden et al., in prep.). Such a distance implies peak luminosity of up to erg s-1, exceeding the Eddington limit for a NS by a factor of 40. Thus, Swift J0243.6+6124 can be considered as the first Galactic X-ray pulsar, belonging to the recently discovered family of ultraluminous X-ray pulsars (see e.g., Bachetti et al., 2014; Fürst et al., 2016; Israel et al., 2017b, a; Tsygankov et al., 2017a). It is worth mentioning that here and below we refer to isotropic luminosity. Although some beaming of emission can be expected in the case of XRPs, we argue that for Swift J0243.6+6124 it is negligible. It follows from the smoothness of the source lightcurve, which does not show any features even when the pulse profile changes significantly, i.e. when the critical and the Eddington luminosities are passed and the beaming pattern is changed (see below).
Swift J0243.6+6124 was observed with the NuSTAR observatory several times throughout the outburst. Preliminary results of the X-ray broadband spectroscopy demonstrate the presence of a high-temperature black body component ( keV) in addition to the typical for X-ray pulsars cut-off power-law with photon index of 1 and keV (Bahramian et al., 2017; Jaisawal et al., 2018). The X-ray spectrum of the source revealed no evidence for additional absorption features which could be associated with the cyclotron resonant scattering and provide an estimate of the magnetic field of the NS (for a review see e.g., Walter et al., 2015).
Knowledge of the magnetic field is essential for understanding physical processes responsible for the observed behaviour of X-ray pulsars, such as their extreme luminosities, significantly exceeding Eddington limit (Mushtukov et al., 2015b). The magnetic field strength in Swift J0243.6+6124 was estimated based on the observed spin-up rate of the pulsar and points to above-average value of G (Doroshenko et al., 2018) under assumption that the source is located at distance 6.6 kpc. While this estimate is in line with non-detection of the cyclotron absorption line in the wide energy range 0.3–80 keV, it is not model independent and thus requires verification.
Here we attempt to independently estimate the magnetic field of the NS based on observation of the transition of the source to the so called “propeller regime” when the accretion is centrifugally inhibited by the rotating magnetic field lines (Illarionov & Sunyaev, 1975). This method was already verified in a very broad range of magnetic field strengths using a sample of magnetized NSs, consisting of accreting millisecond pulsar, classical X-ray pulsars and even pulsating ultra-luminous X-ray source (Tsygankov et al., 2016a; Tsygankov et al., 2016b; Lutovinov et al., 2017). In the case of Swift J0243.6+6124 its relative proximity and very good coverage of the tail of the outburst with the Swift/XRT telescope allowed us to monitor the source down to very low luminosities and to put an upper limit on the dipole component of the NS magnetic field in the system. Unfortunately, continuation of the monitoring until an actual transition to the propeller regime was impossible due to the Sun constraints of the visibility.
2 Data analysis
We mostly rely on the data obtained with the XRT telescope (Burrows et al., 2005) onboard the Neil Gehrels Swift Observatory (Gehrels et al., 2004) during the fading phase of the outburst. Depending on the source brightness the observations were performed both in Windowed Timing (WT) and Photon Counting (PC) modes. The data reduction, i.e. spectrum extraction, was done using the online tools (Evans et al., 2009)222http://www.swift.ac.uk/user_objects/ provided by the UK Swift Science Data Centre. Only zero grade (single pixel) events were included into the product.
The source flux in each observation was determined based on the results of spectral fitting in the XSPEC package assuming the absorbed power-law model. Taking into the account the low counting statistics in the very end of the outburst, we binned the spectra to have at least 1 count per energy bin and fitted them using W-statistic (Wachter et al., 1979).333see xspec manual; https://heasarc.gsfc.nasa.gov/xanadu/ xspec/manual/XSappendixStatistics.html Given the known calibration uncertainties at low energies,444http://www.swift.ac.uk/analysis/xrt/digest_cal.php we restricted our spectral analysis of the WT data to the 0.8–10 keV band and 0.3–10 keV in the PC data. In our spectral analysis we avoided usage of the Swift/XRT data for fluxes above erg s-1 cm-2 strongly affected by the pile-up. Therefore our dataset starts from MJD 58110. This restriction does not affect any of our conclusions as only the final phase of the outburst is relevant for detection of the transition to the propeller regime.
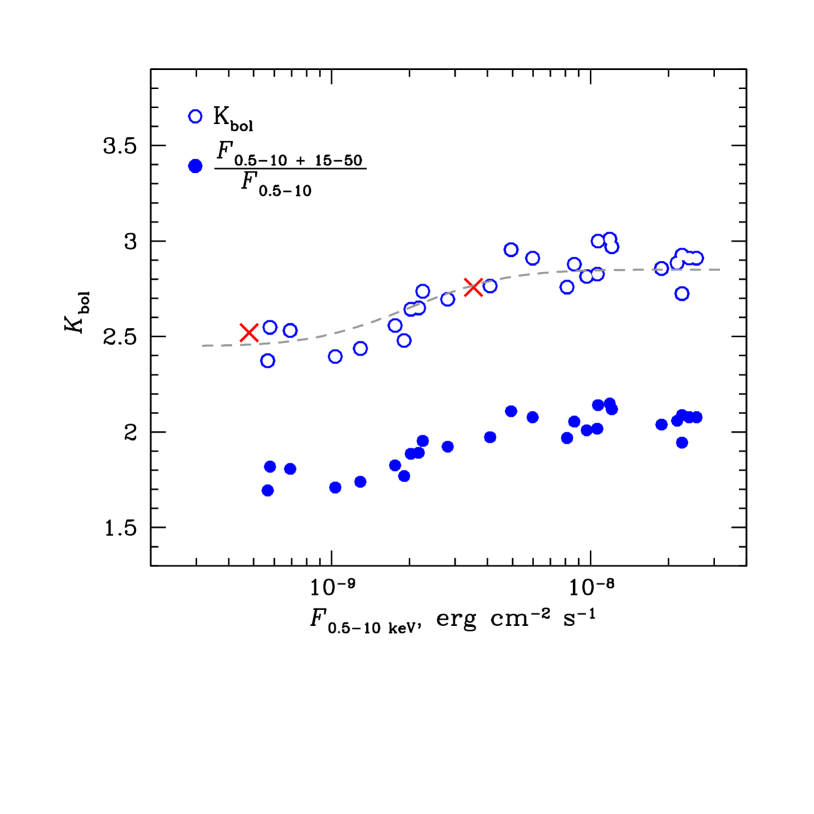
To estimate the source luminosity and the mass accretion rate, and thus the magnetospheric radius of Swift J0243.6+6124 (see below), a reliable estimate of the bolometric flux is required. We estimate it based on the observed Swift/XRT fluxes following the procedure described in Tsygankov et al. (2017a). The observed spectra of X-ray pulsars are known to change with luminosity, so the bolometric correction is also luminosity dependent. To account for that we used the ratio of the total source flux in the 0.5–10 keV (from Swift/XRT data) plus 15–50 keV (from Swift/BAT) energy bands to the source flux in the 0.5–10 keV energy band to estimate the bolometric correction factor throughout the decay phase of the outburst.
The observed dependence of this ratio on flux in the 0.5–10 keV band is shown with filled blue points in Fig. 1. To relate the observed flux ratio and the actual bolometric correction factor we used the broadband observations performed with the NuSTAR observatory (marked by red crosses). The final bolometric correction factor values are shown with the open circles in the same figure, and are consistent with bolometric flux estimate by Doroshenko et al. (2018) using the NuSTAR, Swift/BAT and MAXI data at the higher end of fluxes considered here. In order to get a simple recipe for conversion of the observed Swift/XRT flux to the bolometric one we approximated the observed dependence of the correction factor on the observed flux in the 0.5–10 keV band with the Gauss error function, shown with the grey line. In the following analysis we apply this correction to all observational data and refer to the bolometrically corrected fluxes and luminosities unless stated otherwise. As can be seen from Fig. 1, the bolometric correction remains almost constant for low luminosities, so our results are essentially unaffected by the uncertainties in its reconstruction.
3 Results
The bolometric and absorption corrected light curve of Swift J0243.6+6124 during the fading tail of the outburst is shown in the top panel of Fig. 2. A more or less gradual decrease of the flux is observed until around MJD 58207 when it reached the minimal value of erg s-1 cm-2. After this point the source started to rebrighten (Ruoco Escorial et al., 2018), which was followed again by a gradual decay. Another minimum with the same flux level has been reached around MJD 58235, again followed by the rebrightening. This temporary flux increases did not allow us to detect deeper minimum before the visibility was constrained by Sun. Such rebrightenings during the fading phase of giant outbursts in Be/X-ray pulsars systems were already reported by Tsygankov et al. (2017a) for SMC X-3.
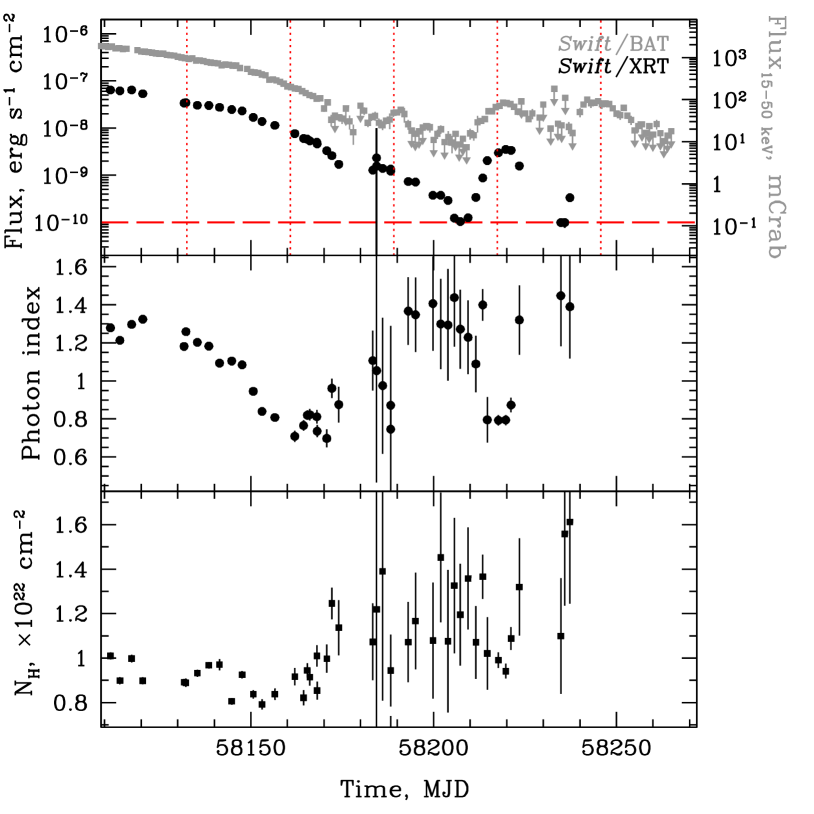
The spectra of the source in the energy range covered by the XRT telescope were fitted using the absorbed power law model (phabs*powerlaw in the XSPEC package). The best-fit parameters demonstrate some moderate variability with the photon index being in the range of 0.8–1.3. The evolution of the photon index with time is shown in the middle panel of Fig. 2. Independently of the flux level the spectra demonstrated moderate hydrogen column density cm-2 (see bottom panel of Fig. 2) comparable to the interstellar absorption in the direction to the source, cm-2 (Willingale et al., 2013).
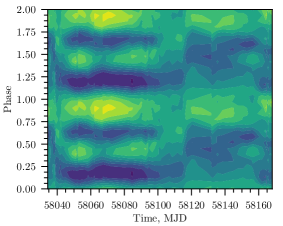
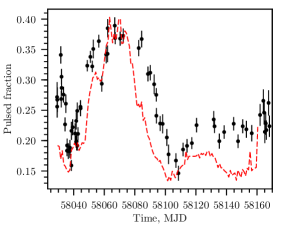
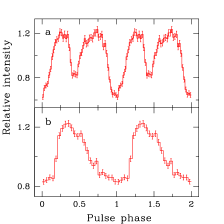
In order to probe changes in the geometrical and physical conditions in the emitting regions in the vicinity of the NS, we studied also the pulse profile evolution with the source intensity. As a result, a drastic change of the pulse profile shape in the 0.5–10 keV energy band was discovered around MJD 58100–58120 (see Fig. 3). In particular, the pulse profile at high fluxes is double-peaked with nearly equal intensity of both peaks, whereas at lower fluxes the profile has a single peak structure. Similar changes occurred also during the rising part of the outburst (around MJD 58040). Significant modifications of the pulse profile shape is accompanied also by the variations of the pulsed fraction. The pulsed fraction555It was calculated as , where and are the maximum and minimum flux in the pulse profile, respectively. as a function of time is shown in Fig. 3. Note the strong changes on MJD 58040–58055 and MJD 58090–58120. At higher energies the observational coverage is limited, however, the source seems to exhibit similar behaviour of the pulse profile and pulsed fraction also in the hard band. Pulsed fraction variations along the outburst can be traced in this case based on the comparison of the pulsed flux measured by Fermi/GBM in the 15–50 keV energy band and the total Swift/BAT flux measured in the same energy band. As illustrated in Fig. 3, the pulsed flux fraction indeed increases at high fluxes similarly to the pulsed fraction measured directly by XRT. For the distance to the source of 7.3 kpc the transition luminosity can be estimated to be about erg s-1. It is important to emphasize that this change is not associated with the transition to the propeller regime and occurs at much higher luminosities. However, as we discuss below, it might also be relevant for the magnetic field strength estimation.
We were unable to obtain a robust phase coherent timing solution covering the entire outburst due to rapid change of the short spin period and pulse profile shape, comparatively large gaps between XRT pointings, and remaining uncertainties in the orbital parameters. Therefore, we refrain from any conclusions regarding the specific phase shifts between different observations, however, strong changes of the observed pulse profile shape are apparent. To illustrate the pulse profile evolution we show also two profiles well before (MJD 58090) and after (MJD 58138) the transition in Fig. 3. This transition is discussed in more detail in Section 4.
4 Discussion
Main goal of the work is to independently constrain the magnetic field of the NS in Swift J0243.6+6124 using the propeller effect. The propeller luminosity is defined by the equality of the magnetospheric radius () to the co-rotation radius (). Under the assumption of the Keplerian motion in the accretion disc, matter can penetrate the magnetosphere and be accreted to the NS only if (Illarionov & Sunyaev, 1975). In the opposite case centrifugal barrier stops the accretion and abrupt drop of the source luminosity should be observed.
The magnetospheric radius depends on the mass accretion rate and magnetic field strength, so a simple equation linking the limiting luminosity to the fundamental parameters of the NS can be derived by equating the co-rotation and magnetospheric radii (see, e.g. Campana et al., 2002)
| (1) |
where and are the NS radius and mass in units of cm and 1.4M⊙, respectively, is the magnetic field strength at the surface of the NS in units of G, is the pulsar rotational period in seconds. Factor is required to take into account difference of the magnetospheric radius in the case of disc accretion and classical Alfvén radius () and is usually assumed to be (Ghosh & Lamb, 1978). It was recently shown by Tsygankov et al. (2017b) that transition to the propeller regime is possible only for pulsars with relatively short pulse periods. From this point of view Swift J0243.6+6124, possessing the period of s, is a very good case study to make another step towards the verification of theory of accretion from the “cold disc” (Tsygankov et al., 2017b).
As can be seen from Fig. 2 no evidence of transition of the source to the propeller regime was observed. The lowest flux level detected by the XRT telescope before Swift J0243.6+6124 entered the rebrightening phase is erg s-1 cm-2.
Using this value as an upper limit for the threshold flux it is possible to derive an upper limit for the magnetic field strength. For the distance of kpc and the coefficient , the propeller luminosity is erg s-1 and corresponding magnetic field G. This value is factor of two lower than the value derived from the analysis of spin period derivative (Doroshenko et al., 2018). However, given the strong dependence of the result on the assumed torque model and accretion disc effective radius, we consider agreement satisfactory. In particular, it is sufficient to assume (see e.g., Chashkina et al., 2017) to increase the upper limit obtained from non-detection of the transition to the propeller at G, making it consistent with the accretion torque estimate. Note, however, that improvement on the upper limit on the propeller luminosity would deteriorate this agreement and thus imply presence of an appreciable non-dipole component of the field.
Additional information about the magnetic field strength can be obtained from the analysis of the pulse profile variations with luminosity. The sharp variations of a beam pattern with accretion luminosity can be caused by the transition from the sub-critical regime of accretion to the super-critical regime, when the radiation pressure becomes high enough to stop matter above the NS surface (Basko & Sunyaev, 1976; Becker et al., 2012; Mushtukov et al., 2015a). In this case, rather small variations of the mass accretion rate can result in appreciable changes of the geometry of the emitting region and modification of the observed pulse profile and pulsed fraction (Gnedin & Sunyaev, 1973).
The critical luminosity value depends on the magnetic field strength at the NS surface (Becker et al., 2012; Mushtukov et al., 2015a). For a “standard” magnetic field G it is estimated at erg s-1, and increases for stronger magnetic fields. If the observed variations of the pulse profile and pulsed fraction in Swift J0243.6+6124 are caused by the transition through the critical luminosity, it points to the magnetic field of the order of G at the surface. This value is, again, marginally compatible with the other estimates. We emphasize, however, that the transition to the propeller was actually not observed, so the transition flux can be, in principle, significantly lower, which would make the two estimates inconsistent with each other. As discussed in Tsygankov et al. (2017a), this discrepancy can, however, still be resolved assuming that the magnetic field of the NS has non-negligible multipole component. It also indicates that local X-ray radiation is dominated by extraordinary mode of polarization characterized by a lower cross-section of interaction with the accreting material (Harding & Lai, 2006; Mushtukov et al., 2016). We emphasize that to explore this possibility it is important to continue monitoring of the source shall it enter another outburst.
5 Conclusions
Here we presented the results of the monitoring of the newly discovered unique X-ray pulsar Swift J0243.6+6124 with the Swift/XRT telescope in the tail of its giant outburst. The source in fact is the brightest BeXRP in the Milky Way and belongs to the recently discovered family of ultraluminous X-ray pulsars. The main goal of the observational campaign was to detect the transition of the pulsar to the “propeller” state and, hence, to estimate the dipole component of the magnetic field of the NS powering this source. Unfortunately, the visibility constraints did not permit us to observe the source down to the fluxes low enough to detect such a transition. However, we were able to put a tight upper limit on the propeller luminosity erg s-1, and, correspondingly, an upper limit on the dipole component of the NS magnetic field strength G. This value is in line with estimates obtained based on the observed spin-up rate of the pulsar, and possible transition of the pulsar through the critical luminosity at erg s-1 suggested by the observed drastic change of the pulse profile shape around MJD 58110. Swift J0243.6+6124 can serve as a unique Galactic laboratory for studying physics of ultraluminous X-ray pulsars over the large dynamic range of luminosities.
Acknowledgements
This work was supported by the Russian Science Foundation grant 14-12-01287 (SST, AAL, AAM). VD thank the Deutsches Zentrum for Luft- und Raumfahrt (DLR) and Deutsche Forschungsgemeinschaft (DFG) for financial support. We also express our thanks to the Swift ToO team for prompt scheduling and executing of our observations.
References
- Bachetti et al. (2014) Bachetti M., et al., 2014, Nature, 514, 202
- Bahramian et al. (2017) Bahramian A., Kennea J. A., Shaw A. W., 2017, The Astronomer’s Telegram, 10866
- Basko & Sunyaev (1976) Basko M. M., Sunyaev R. A., 1976, MNRAS, 175, 395
- Becker et al. (2012) Becker P. A., et al., 2012, A&A, 544, A123
- Bikmaev et al. (2017) Bikmaev I., et al., 2017, The Astronomer’s Telegram, 10968
- Burrows et al. (2005) Burrows D. N., et al., 2005, Space Sci. Rev., 120, 165
- Campana et al. (2002) Campana S., Stella L., Israel G. L., Moretti A., Parmar A. N., Orlandini M., 2002, ApJ, 580, 389
- Chashkina et al. (2017) Chashkina A., Abolmasov P., Poutanen J., 2017, MNRAS, 470, 2799
- Doroshenko et al. (2018) Doroshenko V., Tsygankov S., Santangelo A., 2018, A&A, 613, A19
- Evans et al. (2009) Evans P. A., et al., 2009, MNRAS, 397, 1177
- Fürst et al. (2016) Fürst F., et al., 2016, ApJ, 831, L14
- Gehrels et al. (2004) Gehrels N., et al., 2004, ApJ, 611, 1005
- Ghosh & Lamb (1978) Ghosh P., Lamb F. K., 1978, ApJ, 223, L83
- Gnedin & Sunyaev (1973) Gnedin Y. N., Sunyaev R. A., 1973, A&A, 25, 233
- Harding & Lai (2006) Harding A. K., Lai D., 2006, Reports on Progress in Physics, 69, 2631
- Illarionov & Sunyaev (1975) Illarionov A. F., Sunyaev R. A., 1975, A&A, 39, 185
- Israel et al. (2017a) Israel G. L., et al., 2017a, Science, 355, 817
- Israel et al. (2017b) Israel G. L., et al., 2017b, MNRAS, 466, L48
- Jaisawal et al. (2018) Jaisawal G. K., Naik S., Chenevez J., 2018, MNRAS, 474, 4432
- Jenke & Wilson-Hodge (2017) Jenke P., Wilson-Hodge C. A., 2017, The Astronomer’s Telegram, 10812
- Jenke et al. (2018) Jenke P., Wilson-Hodge C. A., Malacaria C., 2018, The Astronomer’s Telegram, 11280
- Kennea et al. (2017) Kennea J. A., Lien A. Y., Krimm H. A., Cenko S. B., Siegel M. H., 2017, The Astronomer’s Telegram, 10809
- Kouroubatzakis et al. (2017) Kouroubatzakis K., Reig P., Andrews J., ) A. Z., 2017, The Astronomer’s Telegram, 10822
- Lutovinov et al. (2017) Lutovinov A. A., Tsygankov S. S., Krivonos R. A., Molkov S. V., Poutanen J., 2017, ApJ, 834, 209
- Mushtukov et al. (2015a) Mushtukov A. A., Suleimanov V. F., Tsygankov S. S., Poutanen J., 2015a, MNRAS, 447, 1847
- Mushtukov et al. (2015b) Mushtukov A. A., Suleimanov V. F., Tsygankov S. S., Poutanen J., 2015b, MNRAS, 454, 2539
- Mushtukov et al. (2016) Mushtukov A. A., Nagirner D. I., Poutanen J., 2016, Phys. Rev. D, 93, 105003
- Ruoco Escorial et al. (2018) Ruoco Escorial A., Degenaar N., van den Eijnden J., Wijnands R., 2018, The Astronomer’s Telegram, 11517
- Sugita et al. (2017) Sugita S., et al., 2017, The Astronomer’s Telegram, 10803
- Tsygankov et al. (2016a) Tsygankov S. S., Mushtukov A. A., Suleimanov V. F., Poutanen J., 2016a, MNRAS, 457, 1101
- Tsygankov et al. (2016b) Tsygankov S. S., Lutovinov A. A., Doroshenko V., Mushtukov A. A., Suleimanov V., Poutanen J., 2016b, A&A, 593, A16
- Tsygankov et al. (2017a) Tsygankov S. S., Doroshenko V., Lutovinov A. A., Mushtukov A. A., Poutanen J., 2017a, A&A, 605, A39
- Tsygankov et al. (2017b) Tsygankov S. S., Mushtukov A. A., Suleimanov V. F., Doroshenko V., Abolmasov P. K., Lutovinov A. A., Poutanen J., 2017b, A&A, 608, A17
- Wachter et al. (1979) Wachter K., Leach R., Kellogg E., 1979, ApJ, 230, 274
- Walter et al. (2015) Walter R., Lutovinov A. A., Bozzo E., Tsygankov S. S., 2015, A&ARv, 23, 2
- Willingale et al. (2013) Willingale R., Starling R. L. C., Beardmore A. P., Tanvir N. R., O’Brien P. T., 2013, MNRAS, 431, 394