NLTE analysis of copper lines in different stellar populations$\ast$$\ast$affiliation: Based on data obtained from ESO Science Archive and the Subaru telescope.
Abstract
The copper abundances of 29 metal-poor stars are determined based on the high resolution, high signal-to-noise ratio spectra from the UVES spectragraph at the ESO VLT telescope. Our sample consists of the stars of the Galactic halo, thick- and thin-disk with [Fe/H] ranging from 3.2 to dex. The non-local thermodynamic equilibrium (NLTE) effects of Cu I lines are investigated, and line formation calculations are presented for an atomic model of copper including 97 terms and 1089 line transitions. We adopted the recently calculated photo-ionization cross-sections of Cu I, and investigated the hydrogen collision by comparing the theoretical and observed line profiles of our sample stars. The copper abundances are derived for both local thermodynamic equilibrium (LTE) and NLTE based on the spectrum synthesis methods. Our results show that the NLTE effects for Cu I lines are important for metal-poor stars, in particular for very metal-poor stars, and these effects depend on the metallicity. For very metal-poor stars, the NLTE abundance correction reaches as large as dex compared to standard LTE calculations. Our results indicate that [Cu/Fe] is under-abundant for metal-poor stars ( dex) when the NLTE effects are included.
Subject headings:
Line: formation - Line: profiles - Stars: abundances -Stars: late-type – Galaxy: evolution1. Introduction
The history of the chemical composition of our Galaxy is dominated by the nucleosynthesis occurring in many generations of stars. Metal-poor stars represent one of the main diagnostic tools to probe the early phases of the chemical evolution of our Galaxy. The variation in the elemental abundance ratios derived at different metallicites can be compared with the yields from supernovae (SNe) of different masses to check which ones have contributed to the Galactic chemical enrichment and when. Here, the preliminary result on the iron-group element copper is presented, the main goal is to better constrain its nucleosynthetic origin.
Several sources of Cu have been discussed: (i) in massive stars the weak s-process operates during core-helium and carbon-shell hydrostatic burning phases, as well as in explosive complete Ne burning phase (Woosley & Weaver, 1995; Pignatari et al., 2010; Limongi & Chieffi, 2003); (ii) in low mass stars the main s-process occurs during the asymptotic giant branch (AGB) (Arlandini et al., 1999), and (iii) in long-lived type Ia supernovae explosive nucleosynthesis happens (Iwamoto et al., 1999; Travaglio et al., 2004; Fink et al., 2014).
From the observational point of view, Cu abundances have been discussed by Gratton & Sneden (1988) and Sneden & Crocker (1988), a secondary-like process for Cu (one requiring iron seeds from previous stellar generations, giving rise to an enrichment proportional to the iron content) was found by them (also see Sneden et al., 1991). Further abundance determinations for this elements in halo and disk stars were provided by Primas et al. (2000), and their results can be represented by a flat distribution [Cu/Fe] dex for low metallicity stars up to [Fe/H] , followed by a linear increase with a slope close to 1 in the metallicity range [Fe/H] (Reddy & Lambert, 2008; Ishigaki, Aoki & Chiba, 2013). While for the Galactic disk stars, there is a bending of the [Cu/Fe] distribution, and a distinct and separated trends are seen between thick- and thin-disk stars (see also Mishenina et al., 2002; Reddy et al., 2003; Yan, Shi & Zhao, 2015; Zhao et al., 2016; Mikolaitis et al., 2017; Delgado Mena et al., 2017). For very low-metallicity stars, Cu abundances have been derived by Bihain et al. (2004) and Lai et al. (2008) under the assumption of LTE from the near-UV lines of Cu I at 3247.53 and 3273.95 Å taking the effects of hyperfine structure(HFS) and isotopic splitting into account, and they found a plateau ([Cu/Fe] dex) at [Fe/H] . The copper abundances for the bulge stars have been derived by Johnson et al. (2014), and it is found that the trend of [Cu/Fe] ratios with [Fe/H] in the bulge is very different from the Galactic thin- and thick-disk stars. In the bulge the Cu abundance increases monotonically from [Cu/Fe] dex in the most metal-poor star to [Cu/Fe] 0.40 dex in the most metal-rich stars. The copper abundance in globular clusters have been discussed in detail by Simmerer et al. (2003), they derived the copper abundances of 117 giants in 10 globular clusters (M 3, M 4, M 5, M 10, M 13, M 17, NGC 7006, NGC 288 and NGC 362), and noted that the copper abundances in globular clusters appear to follow the trends found in the field. Similar conclusion have been reported for M 28 (Villanova et al., 2017), M 80 (Carretta et al., 2015), NGC 4833 (Carretta et al., 2014), and NGC5897 (Koch & McWilliam, 2014). While it is reported that the copper abundances in the massive Galactic globular cluster Centauri fall below the corresponding mean ratio in the field stars by roughly 0.5 dex (Cunha et al., 2002; Pancino et al., 2002; Smith et al., 2000), maybe also in the globular cluster Ruprecht 106 (Villanova et al., 2013).
Shetrone et al. (2003) measured Cu abundances in a total of 12 stars across four dwarf spheroidal galaxies, e.g. Sculptor, Fornax, Carina, and Leo I, all but one of the stars were below [Fe/H]. Their results indicate that the [Cu/Fe] ratio is constant ([Cu/Fe]) for [Fe/H], while the metal-rich Fornax star has a Cu enhancement. McWilliam & Smecker-Hane (2005) derived Cu abundances for 14 red giants in Sagittarius dwarf spheroidal galaxy (Sgr), and noted that compared to Milky Way stars the [Cu/Fe] ratio of Sgr stars is deficiency by 0.5 dex (also see Carretta et al., 2010; McWilliam et al., 2013). On the other hand, Sbordone et al. (2007) found that the [Cu/Fe] deficiencies increase with increasing [Fe/H], such that the [Cu/Fe] ratio of Sgr stars is near -1 dex around solar iron abundance. Johnson, Ivans, & Stetson (2006) derived Cu abundances of 10 red giant stars in four old globular clusters in the Large Magellanic Cloud (LMC), and found that their behavior follows the stars in Cen with similar [Fe/H]. Pompéia et al. (2008) found that in the inner disk LMC stars, the copper distribution is flat with a mean value of [Cu/Fe] dex, while, around the higher metallicity range the LMC stars present a clear under-abundance with respect to the Galactic disk. Colucci et al. (2012) determined the detail abundances of 22 elements including copper for eight clusters in LMC, they also noted the depleted [Cu/Fe] at high metallicity. Very recently, Sakari, McWilliam & Wallerstein (2017) investigated two stars in the LMC globular cluster NGC 1718, and ascertained these two stars strongly deficient in copper.
It is noted by Bonifacio, Caffau & Ludwig (2010) that the Cu I resonance lines are not reliable abundance indicators, and departures from LTE should be taken into account to properly describe these lines for both dwarfs and giants. Recently, Roederer et al. (2014) found a large difference of copper abundance ( dex) derived from Cu I resonance and Cu II lines (also see Roederer & Lawler, 2012), thus, they suggested that Cu I lines may not be formed in LTE, and clearly more work is needed to better understand the formation of Cu I lines in cool stars.
The present work is based on a sample of metal-poor stars and aims at exploring their [Cu/Fe] abundance ratios applying full spectrum synthesis based on level populations calculated from the statistical equilibrium equations. In Sect. 2 we provided the observational techniques, while the atmospheric models, stellar parameters and atomic data are described in Sect. 3. The copper atomic model and the NLTE effects are discussed in Sect. 4. The results and the comparisons with other works are illustrated in Sec. 5. The discussion is given in Sect. 6, and the conclusions are presented in the last section.
2. Observations
Our aim is to derive the copper abundances for a sample of metal-poor stars using high resolution and high signal-to-noise ratio spectra with the two Cu I near-UV resonance lines included. The spectra of 26 metal-poor stars were observed with the UVES échelle spectrograph mounted at the ESO VLT during two observation runs: April 8-12 (2000) and April 10-12 (2001, programme IDS 65.L-0507 and 67.D-0439). The wavelength ranges of the spectra are from 3050 to 3850 Å with a resolution power (R) of 48 000 for the blue arm, while from 4800 to 6800 Å with R 55 000 for the red arm. We use also high-quality observed spectra from the ESO UVESPOP survey (Bagbulo et al., 2005) for Procyon, HD 84937 and HD 122563. Finally, for G 64-12 we use the spectrum from the High Dispersion Spectrograph at the Nasmyth focus of the Subaru 8.2 m telescope (Noguchi, Aoki & Kawanomoto, 2002).
The spectra were reduced with the standard ESO MIDAS package including location of échelle orders, wavelength calibration, background subtraction, flat-field correction, and order extraction.
3. Method of calculation
3.1. Model atmospheres
In this analysis the line-blanketed 1D LTE MAFAGS opacity sampling model atmospheres are adopted (Grupp, 2004; Grupp, Kurucz & Tan, 2009), and the convection according to Canuto & Mazzitelli (1992) is used. For stars with [Fe/H] the enhanced -element (O, Mg, Si and Ca) by 0.4 dex were used for individual models. As usual, the mixing length parameter l/Hp = 0.5 is adopted.
3.2. Stellar parameters
We employed the stellar parameters determined by Tan, Shi & Zhao (2009) for most of our program stars except G 20-24 and G 183-11, the surface gravities of these two stars have been revised using the parallaxes from Gaia DR1 (Gaia Collaboration et al., 2016). For HD 61421, HD 84937 and HD 122563 the parameters were taken from Mashonkina et al. (2011) while for G 64-12 from Shi et al. (2009). We also adopted the parameters from Mashonkina et al. (2017) for HD 122563. In these works the wings of the Balmer lines have been used to derive the effective temperatures, and the HIPPARCOS parallaxes are adopted to determine the surface gravities. The iron abundances have been determined with the Fe II lines, and the microturbulence velocities are estimated by requesting that the iron abundance derived from Fe II lines should not depend on equivalent widths. The uncertainties for the temperature, surface gravity, metal abundance and microturbulence velocity are generally considered to be 80 K, 0.1 dex, 0.1 dex and 0.2 km s-1 respectively.
3.3. Atomic line data
The relevant line data with their final solar fit (Shi et al., 2014) values are presented in Table 1. The collisional broadening through van der Waals interaction with hydrogen atoms are calculated according to Anstee & O’Mara (1991, 1995) tables, and the HFS was included in our analysis with the data taken from Biehl (1976). Following Asplund et al. (2009) the isotopic ratio of 63Cu:65Cu is adopted as 69%:31%.
| [Å] | Transition | |||
|---|---|---|---|---|
| 3247.54 | -0.21 | -31.73 | ||
| 3273.96 | -0.50 | -31.74 | ||
| 5105.54 | -1.64 | -31.67 | ||
| 5218.20 | +0.28 | -30.57 | ||
| 5220.07 | -0.63 | -30.57 | ||
| 5700.24 | -2.60 | -31.65 | ||
| 5782.13 | -1.89 | -31.66 | ||
4. NLTE calculations
4.1. Atomic model
Our copper model atom contains all the important Cu I levels (including 96 Cu I terms) and the Cu II ground state, and is discussed in detail in Shi et al. (2014). Recently, Liu et al. (2014) have calculated the oscillator strengths and photoionization cross-sections using the R-matrix method in the LS-coupling scheme, and we adopted their results in our atomic model. Following Shi et al. (2014) the hydrogen collision enhancement factor = 0.1 is taken in our analysis.
A revised version of the DETAIL program (Butler & Giddings, 1985) have been adopted to solve the coupled radiative transfer and statistical equilibrium equations, which are based on the accelerated lambda iteration following the method described by Rybicki & Hummer (1991, 1992), and it was presented in detail by Mashonkina et al. (2011). The obtained departure coefficients were then adopted with the SIU code (Reetz, 1991) to calculate the synthetic line profiles.
4.2. NLTE effects
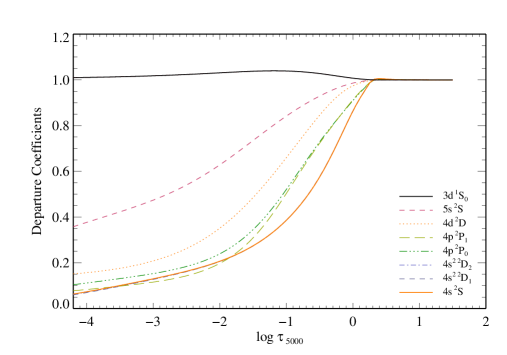
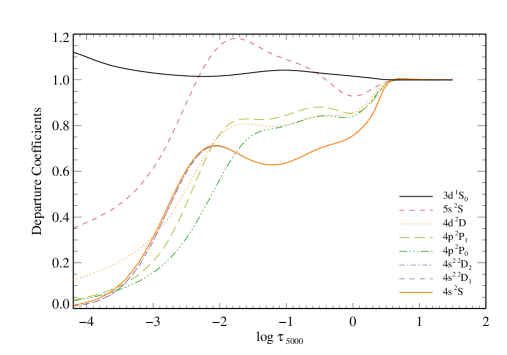
The departure coefficients () of the investigated levels as a function of the continuum optical depth at 5000 Å are shown in Fig. 1 for the model atmospheres of HD 84937 and HD 122563, here is the ratio of the number density of NLTE to that of LTE. HD 84937 is a well-known metal-poor star with high-temperature among our sample, while HD 122563 is a typical cool metal-poor giant star. The departure coefficients for the investigated levels of Cu I and the Cu II ground state are presented in this figure, and it is clear that the number densities of the Cu I levels begin to underpopulate outside layers with log due to over-ionization for both stars. An obvious overpopulate of the level for HD 122563, which is due to over-recombination, can be seen in the range of log .
It is noted that the NLTE effects of Cu I lines are evident in our abundance determination, and as expected, there is a inclination that the effects tend to be large for more metal-poor stars, very similar phenomenon is discovered for sodium (Shi, Gehren & Zhao, 2004). Compared to their NLTE counterparts the substantially lower LTE results can be found clearly, and the differences can be larger than 0.50 dex for extreme metal-poor stars. We display the copper abundance differences between LTE and NLTE calculations as functions of temperature, metal abundance and surface gravity for our sample stars in Fig. 2, respectively. The average NLTE effects are , and dex for the halo, thick and thin disk stars.


Our results indicate that departures from LTE of the copper level populations seem to be larger for more metal-poor stars, and there is a clear tendency that the NLTE effects increase with decreasing metallicity, which can explain the large Cu abundance difference derived from Cu I and Cu II lines for stars of [Fe/H] , e.g., the Cu abundances derived from Cu I resonance lines are about 0.56 dex lower than that from the Cu II lines found by Roederer et al. (2014).
5. Results
5.1. Stellar copper abundances
The copper abundances of our program stars are derived with the spectral synthesis method, and the synthetic spectra are convolved with a Gauss broadening profiles in order to fit the observed spectral lines. Figs.3 and 4 show the fitting line profiles for HD 122563 and G 64-12, respectively. It is found that the abundance differences are small for the NLTE results with a line to line abundance scatter between 0.01 and 0.11 dex, while it is larger for the LTE result. In Table 2 we present the final LTE and NLTE copper abundance results.


As noted by Bihain et al. (2004) and Cayrel et al. (2004), the abundances derived from the spectra of metal-poor stars may be overestimated if the continuum scattering is included as an additional opacity source in the spectral synthesis code. The overestimation is especially high for lines with 4000 Å, where continuum scattering becomes important relative to continuous absorption. Based our spectrum synthesis modeling code SIU, which can treat continuum scattering properly, we evaluated the influence on the derived Cu abundances for the only giant, HD 122563, and the determined Cu abundance lowers by about 0.3 dex than that derived without the continuum scattering considered, while there is no impact on the derived Cu abundances for the dwarfs, e.g. HD 84937 and G 64-12. We found a much less correlation of Cu abundance with wavelength when the continuum scattering is included, similar behavior has been found by Cayrel et al. (2004) and Lai et al. (2008).


| Name | [Fe/H] | 3247 | 3273 | 5105 | 5218 | 5220 | 5700 | 5782 | [Cu/Fe] | |||
|---|---|---|---|---|---|---|---|---|---|---|---|---|
| CD 30∘ 18140 | 6195 | 4.15 | -1.87 | 1.5 | -0.87 | -0.90 | – | – | – | – | – | -0.890.015 |
| -0.69 | -0.71 | – | – | – | – | – | -0.700.010 | |||||
| CD 57∘ 1633 | 5915 | 4.23 | -0.91 | 1.2 | -0.82 | -0.81 | -0.81 | -0.68 | – | – | – | -0.780.050 |
| -0.71 | -0.69 | -0.66 | -0.66 | – | – | – | -0.680.020 | |||||
| G 13-009 | 6270 | 3.91 | -2.28 | 1.5 | -0.95 | -0.90 | – | – | – | – | – | -0.930.025 |
| -0.41 | -0.38 | – | – | – | – | – | -0.400.015 | |||||
| G 020-024 | 6190 | 3.90 | -1.92 | 1.5 | -0.99 | -0.92 | – | – | – | – | – | -0.960.035 |
| -0.58 | -0.51 | – | – | – | – | – | -0.550.035 | |||||
| G 64-12 | 6407 | 4.40 | -3.12 | 2.5 | -0.90 | – | – | – | – | – | – | -0.900.000 |
| -0.37 | – | – | – | – | – | – | -0.370.000 | |||||
| G 183-011 | 6190 | 4.09 | -2.08 | 1.5 | -0.97 | -0.88 | – | – | – | – | – | -0.930.045 |
| -0.51 | -0.46 | – | – | – | – | – | -0.490.025 | |||||
| HD 61421 | 6510 | 3.96 | -0.03 | 1.8 | – | – | -0.14 | -0.17 | -0.15 | – | -0.18 | -0.160.015 |
| – | – | -0.07 | -0.13 | -0.11 | – | -0.14 | -0.110.023 | |||||
| HD 76932 | 5890 | 4.12 | -0.89 | 1.2 | -0.22 | -0.25 | -0.26 | -0.23 | – | – | – | -0.240.032 |
| -0.19 | -0.18 | -0.16 | -0.17 | – | – | – | -0.180.010 | |||||
| HD 84937 | 6350 | 4.09 | -2.15 | 1.7 | -0.92 | -0.94 | – | – | – | – | – | -0.930.010 |
| -0.43 | -0.46 | – | – | – | – | – | -0.450.015 | |||||
| HD 97320 | 6030 | 4.22 | -1.20 | 1.3 | -0.19 | -0.18 | -0.29 | -0.15 | – | – | – | -0.200.044 |
| -0.09 | -0.10 | -0.10 | -0.07 | – | – | – | -0.090.010 | |||||
| HD 97916 | 6350 | 4.11 | -0.88 | 1.5 | -0.34 | -0.36 | -0.35 | – | – | – | – | -0.350.007 |
| -0.17 | -0.20 | -0.20 | – | – | – | – | -0.190.013 | |||||
| HD 103723 | 6005 | 4.23 | -0.82 | 1.3 | -0.57 | -0.43 | -0.51 | -0.51 | – | – | – | -0.510.037 |
| -0.42 | -0.38 | -0.40 | -0.43 | – | – | – | -0.410.018 | |||||
| HD 106038 | 5990 | 4.43 | -1.30 | 1.2 | -0.47 | -0.38 | -0.44 | -0.36 | – | – | – | -0.410.043 |
| -0.37 | -0.33 | -0.32 | -0.28 | – | – | – | -0.330.025 | |||||
| HD 111980 | 5850 | 3.94 | -1.11 | 1.2 | -0.32 | -0.28 | -0.38 | -0.40 | – | – | – | -0.350.045 |
| -0.21 | -0.21 | -0.20 | -0.26 | – | – | – | -0.220.020 | |||||
| HD 113679 | 5740 | 3.94 | -0.70 | 1.2 | -0.06 | -0.08 | -0.06 | -0.12 | -0.03 | – | – | -0.070.024 |
| -0.01 | 0.02 | 0.07 | -0.07 | 0.02 | – | – | 0.010.037 | |||||
| HD 121004 | 5720 | 4.40 | -0.73 | 1.1 | -0.12 | -0.12 | -0.12 | -0.14 | -0.02 | – | – | -0.100.034 |
| -0.03 | -0.05 | -0.03 | -0.10 | 0.00 | – | – | -0.040.026 | |||||
| HD 122196 | 5975 | 3.85 | -1.74 | 1.5 | -1.13 | -1.09 | – | – | – | – | – | -1.110.020 |
| -0.77 | -0.77 | – | – | – | – | – | -0.770.000 | |||||
| HD 122563 | 4600 | 1.60 | -2.50 | 1.9 | -1.25 | -1.18 | -1.15 | – | – | – | – | -1.190.038 |
| -0.88 | -0.93 | -0.85 | – | – | – | – | -0.890.029 | |||||
| 4600 | 1.32 | -2.63 | 1.7 | -1.07 | -1.11 | -1.07 | – | – | – | – | -1.080.018 | |
| -0.75 | -0.78 | -0.67 | – | – | – | – | -0.730.042 | |||||
| HD 126681 | 5595 | 4.53 | -1.17 | 0.7 | -0.32 | -0.24 | -0.31 | -0.29 | – | – | – | -0.290.025 |
| -0.25 | -0.21 | -0.24 | -0.28 | – | – | – | -0.250.020 | |||||
| HD 132475 | 5705 | 3.79 | -1.50 | 1.4 | -0.51 | -0.53 | -0.57 | – | – | – | – | -0.540.022 |
| -0.34 | -0.37 | -0.34 | – | – | – | – | -0.350.013 | |||||
| HD 140283 | 5725 | 3.68 | -2.41 | 1.5 | -1.12 | -1.09 | – | – | – | – | – | -1.110.015 |
| -0.64 | -0.63 | – | – | – | – | – | -0.640.005 | |||||
| HD 160617 | 5940 | 3.80 | -1.78 | 1.5 | -1.09 | -1.00 | – | – | – | – | – | -1.050.045 |
| -0.72 | -0.68 | – | – | – | – | – | -0.700.020 | |||||
| HD 166913 | 6050 | 4.13 | -1.55 | 1.3 | -0.62 | -0.66 | -0.60 | – | – | – | – | -0.630.022 |
| -0.42 | -0.43 | -0.35 | – | – | – | – | -0.400.033 | |||||
| HD 175179 | 5780 | 4.18 | -0.74 | 1.0 | 0.03 | 0.02 | -0.01 | 0.00 | 0.03 | -0.01 | – | 0.010.017 |
| 0.10 | 0.09 | 0.12 | 0.03 | 0.10 | 0.06 | – | 0.080.026 | |||||
| HD 188510 | 5480 | 4.42 | -1.67 | 0.8 | -0.37 | -0.41 | -0.45 | – | – | – | – | -0.410.027 |
| -0.27 | -0.33 | -0.35 | – | – | – | – | -0.320.031 | |||||
| HD 189558 | 5670 | 3.83 | -1.15 | 1.2 | -0.47 | -0.43 | -0.42 | – | – | – | – | -0.440.020 |
| -0.33 | -0.33 | -0.30 | – | – | – | – | -0.320.013 | |||||
| HD 195633 | 6000 | 3.86 | -0.64 | 1.4 | -0.12 | -0.18 | -0.13 | -0.13 | – | – | – | -0.140.020 |
| -0.03 | -0.08 | -0.03 | -0.06 | – | – | – | -0.050.020 | |||||
| HD 205650 | 5815 | 4.52 | -1.13 | 1.0 | -0.13 | -0.19 | -0.17 | -0.21 | – | – | – | -0.180.025 |
| -0.09 | -0.10 | -0.09 | -0.17 | – | – | – | -0.110.029 | |||||
| HD 298986 | 6085 | 4.26 | -1.33 | 1.3 | -0.97 | -1.00 | – | – | – | – | – | -0.990.015 |
| -0.82 | -0.85 | – | – | – | – | – | -0.840.015 |
5.2. Comparison with other work
Some groups have determined copper abundances for metal-poor stars based on both LTE and NLTE analysis. We compare our results with those from the previous works, and discuss the reasons for the differences.
Nissen & Schuster (2011)
Nissen & Schuster (2011) adopted a LTE line formation for a sample of rich and poor moderately metal-poor stars, and they used Cu I 5105.5, 5218.2 and 5782.1 Å lines determining the copper abundances. Their results have been revised by Yan et al. (2016) with the NLTE effects included. Our results are well in agreement with theirs, the average difference of the NLTE results is for the 11 stars in common. Compared with Nissen & Schuster (2011) our LTE result is lower than theirs, while it is higher for our NLTE results.
Their analysis investigated a large number of metal-poor stars, of which five objects are in common with ours, and an average of dex is obtained for both LTE results. It is found that the largest difference (0.47 dex) comes from the metal-poor giant HD 122563, and around 0.3 dex difference is due to the continuum scattering included in our analysis. Excluding this object the difference will be reduced to -0.048 dex.
Bihain et al. (2004) The authors determined the copper abundances for 38 FGK stars. Our LTE results are mostly in agreement with theirs. For the eight stars in common, the average difference is . The largest difference (0.43 dex) is from the object HD 166913, both studies have adopted similar stellar parameters, thus it is hard to explain such a large difference in [Cu/Fe] for this star.
Sneden et al. (1991)
Using high resolution, high signal-to-noise ratio spectra, Sneden et al. (1991) measured the copper abundances of metal-poor stars. We have three stars in common with this work, one is the giant star HD 122563, the others are two dwarf stars, i.e., HD 76932 and HD 188510. For the giant our LTE copper abundance is 0.26 dex lower than theirs, most of the difference can be explained by the continuum scattering considered in our analysis. The difference in [Cu/Fe] is 0.04 dex for HD 76932, while it is 0.29 for HD 188510. For the later object the large difference may due to the different stellar parameters adopted in each work.
Reddy et al. (2006)
Based on the high resolution, high signal-to-noise ratio spectra of 176 nearby thick-disk candidate stars, they derived the abundance ratios of [Cu/Fe]. The results of Reddy et al. (2006) are very much in agreement with ours, the average difference between theirs and our LTE results is for the two common stars.
Andrievsky et al. (2017)
Recently Andrievsky et al. (2017) investigated the NLTE effects of copper lines in very metal-poor stars, we have three objects in common with theirs, i.e., HD 84937, HD 122563 and HD 140283. For HD 84937 their NLTE result is 0.25 dex higher than ours, while it is 0.38 for HD 140283. For the giant star HD 122563 their [Cu/Fe] is 0.69 dex higher, we note that they have not considered the impact of the continuum scattering, which will result in 0.3 dex difference, while the rest may due to their large NLTE effects. Similar large NLTE corrections have been found when the hydrogen collisions have not been included ( = 0.0), and/or the broadening and the exact wavelengths of the two strong Cu I resonance UV lines at 3247 and 3273 Å have not considered properly.
Roederer & Barklem (2018)
Very recently Roederer & Barklem (2018) tested the copper abundances in late-type stars using ultraviolet Cu II lines, and showed that LTE underestimates the copper abundance determined from Cu I lines, namely the [Cu/H] ratios determined from Cu II lines are dex higher than those determined from Cu I lines for their metal-poor samples. For the four common stars the average difference between their [Cu I/Fe] ratios and ours is , while it is between their [Cu II/Fe] ratios and our NLTE results. The difference of [Cu I/Fe] for the two works is due to the lower values for the two resonance lines ( about 0.15 dex lower) adopted by us.
6. Discussion
Following Nissen & Schuster (2010) we classified our samples as halo (h), thick disk or halo (tk/h), thick disk (tk), and thin disk (tn) stars, and presented in Table 3. In Fig. 5 we plotted the Toomre diagram of our program stars. The behavior of [Cu/Fe] with the stellar metallicity [Fe/H] holds information about the chemical evolution of our Galaxy. Figs. 6 and 7 display the trend of the [Cu/Fe] ratio (calculated in LTE and NLTE) with the metal abundance for all stars investigated in this paper, respectively. One important feature that we can find from Fig. 7 is that the [Cu/Fe] ratios decrease with decreasing metallicity for [Fe/H] from to , and they may increase for more metal-poor stars. While Andrievsky et al. (2017) suggested that the trend of [Cu/Fe] ratio is constant, this is due to their very large NLTE effects (1 dex) for very metal-poor stars. Another important feature that can be seen from this figure is that there is a group of stars with clear low [Cu/Fe] ratios compared with similar metallicity other samples, and it is interesting to discuss the behavior of this group of stars. It is first noted by Nissen & Schuster (2011) that the low- members show systematic low copper abundances (also see Yan et al., 2016), and in our sample there are four such type objects from their work, i.e. CD 1633, HD 103723, HD 122196 and HD 298986, the [Cu/Fe] ratios of these four stars are obviously lower.
In order to investigate the behavior of -elments for our sample stars, we derived the LTE and NLTE Mg, Si and Ca abundances of those objects based on the atomic models of magnesium (Zhang et al., 2017), silicon (Zhang et al., 2016) and calcium (Mashonkina et al., 2017), and the detailed information on abundance and kinematics was listed in Table 3. This table shows that, besides above four low copper abundance stars, the ratios of both [Mg/Fe] and [/Fe] (the average of Mg, Si and Ca abundances) for the other four such type halo stars (i.e. CD 18140, HD 122563, HD 140283 and HD 160617) are also obviously lower compared to other normal stars with similar metallicity, which can also be clear seen in the plots of [Mg/Fe] and [/Fe] versus metallicity in Fig. 8. For the two very metal-stars, HD 140283 and HD 122563, Siqueira-Mello et al. (2015) revealed that both are excellent examples of abundances dominated by the weak r-process.


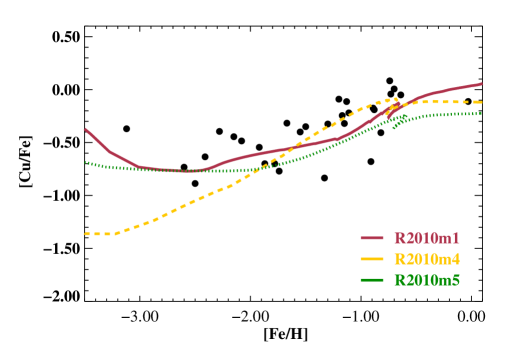
Detailed modeling of the Galactic chemical evolution for copper has been attempted by many authors (e.g. Sneden et al., 1991; Mucciarelli et al., 1993; Timmes, Woosley & Weaver, 1995; Goswami & Prantzos, 2000; Kobayashi et al., 2006; Romano & Matteucci, 2007; Romano et al., 2010). Sneden et al. (1991) suggested that the copper contributes mainly from the weak s-process, however, Raiteri, Gallino & Busso (1992) argued that a large fraction is from long lived type Ia supernovae (also see Mucciarelli et al., 1993; Mishenina et al., 2002). Based on Woosley & Weaver (1995) metallicity-dependent yields, Timmes, Woosley & Weaver (1995) calculated the behavior of [Cu/Fe] as a function of metallicity, and their result predicted that this elements may be synthesized in significant amounts by the nuclear burning stages in massive stars, which was confirmed by Romano & Matteucci (2007) with a comprehensive study of copper evolution in different systems. In Fig. 9 we plot the predicted [Cu/Fe] rations as a function of [Fe/H] from Romano et al. (2010) with our NLTE results. In their model 1, the Woosley & Weaver (1995) case B yields for normal SNe II have been adopted and it provides the best fit to the observed [Cu/Fe] versus [Fe/H] trend, even for the lowest metallicities, which means that copper is mainly produced by massive type II SNe. The models 4 and 5 of Romano et al. (2010) were computed adopting the Kobayashi et al. (2006) yields with = 0 and 1, respectively. Although model 4 can reproduce the [Cu/Fe] ratio for metal-rich stars, it underestimate the copper abundance for the very metal-poor region. Both models 1 and 5 are indistinguishable with the observational data alone, though the predicted [Cu/Fe] ratio of model 5 is slightly lower than that of the observed one.
7. Conclusions
We have determined copper abundances for 29 meal-poor stars spanning the metallicity range [Fe/H]0.0 dex. Using the MAFAGS’s LTE model atmospheres the copper abundances were obtained with both the near-UV and optical lines. Our results are derived for both LTE and NLTE based on the line fitting method. It is found:
| Name | [Mg/Fe] | [Mg/Fe] | [Si/Fe] | [Si/Fe] | [Ca/Fe] | [Ca/Fe] | U | V | W | pop111Following Nissen & Schuster (2010) classification as halo (h), thick disk or halo (tk/h), thick disk (tk), and thin disk (tn) stars. |
|---|---|---|---|---|---|---|---|---|---|---|
| LTE | NLTE | LTE | NLTE | LTE | NLTE | |||||
| CD 30∘ 18140 | 0.140.01 | 0.230.02 | 0.250.00 | 0.260.00 | 0.270.01 | 0.380.02 | 71.5 | -195.5 | -11.2 | h |
| CD 57∘ 1633 | 0.060.00 | 0.140.01 | 0.100.04 | 0.090.01 | 0.080.02 | 0.110.02 | -329.0 | -240.0 | -28.0 | h |
| G 13-009 | 0.260.05 | 0.350.00 | 0.190.15 | 0.330.03 | 0.300.03 | 0.470.03 | -93.1 | -264.4 | -81.4 | h |
| G 020-024 | 0.220.01 | 0.300.01 | 0.260.05 | 0.340.03 | 0.310.02 | 0.440.03 | 160.3 | -206.0 | 64.3 | h |
| G 64-12 | 0.220.01 | 0.320.01 | 0.040.00 | 0.280.00 | 0.310.00 | 0.370.00 | -50.0 | -317.0 | 397.0 | h |
| G 183-011 | 0.260.04 | 0.330.01 | 0.360.00 | 0.410.00 | 0.270.02 | 0.400.03 | 53.5 | -379.0 | -31.6 | h |
| HD 61421 | 0.040.02 | 0.090.01 | 0.150.09 | 0.080.01 | 0.010.01 | 0.000.00 | -12.6 | 7.0 | 6.4 | tn |
| HD 76932 | 0.330.02 | 0.440.02 | 0.360.06 | 0.330.02 | 0.250.02 | 0.260.02 | 0.3 | -41.0 | -77.0 | tk |
| HD 84937 | 0.280.04 | 0.350.02 | 0.240.07 | 0.370.00 | 0.350.02 | 0.410.02 | 226.0 | -237.5 | -8.4 | h |
| HD 97320 | 0.280.02 | 0.390.03 | 0.380.04 | 0.360.01 | 0.170.02 | 0.230.02 | 80.0 | -11.0 | -30.0 | tk |
| HD 97916 | 0.390.02 | 0.480.01 | 0.420.05 | 0.400.02 | 0.230.03 | 0.250.02 | 117.7 | 15.9 | 96.1 | tk |
| HD 103723 | 0.130.01 | 0.220.01 | 0.190.05 | 0.170.01 | 0.140.01 | 0.160.03 | -72.0 | -193.0 | 58.0 | h |
| HD 106038 | 0.240.03 | 0.330.03 | 0.760.05 | 0.750.01 | 0.160.02 | 0.220.02 | 25.2 | -264.3 | 26.2 | h |
| HD 111980 | 0.350.00 | 0.450.02 | 0.470.03 | 0.450.01 | 0.310.01 | 0.340.03 | 239.0 | -174.0 | 57.0 | h |
| HD 113679 | 0.420.00 | 0.500.01 | 0.410.03 | 0.390.01 | 0.350.02 | 0.330.03 | -96.0 | -278.0 | 3.0 | h |
| HD 121004 | 0.360.02 | 0.430.02 | 0.400.03 | 0.400.01 | 0.170.10 | 0.180.08 | 70.0 | -242.0 | 105.0 | h |
| HD 122196 | 0.110.01 | 0.190.01 | 0.180.01 | 0.170.02 | 0.160.03 | 0.240.04 | -160.9 | -139.4 | 23.5 | tk/h |
| HD 122563 | 0.170.01 | 0.220.01 | 0.250.02 | 0.240.00 | 0.070.02 | 0.170.01 | 139.0 | -233.0 | 26.0 | h |
| HD 126681 | 0.360.01 | 0.420.01 | 0.460.02 | 0.450.01 | 0.340.03 | 0.350.01 | -15.0 | -28.0 | -64.0 | tk |
| HD 132475 | 0.340.02 | 0.420.02 | 0.550.04 | 0.540.01 | 0.250.02 | 0.320.04 | 44.0 | -371.0 | 60.0 | h |
| HD 140283 | 0.130.03 | 0.210.01 | 0.160.02 | 0.170.02 | 0.080.04 | 0.250.04 | 30.0 | 147.0 | -320.5 | h |
| HD 160617 | 0.180.01 | 0.260.02 | 0.260.04 | 0.260.02 | 0.210.02 | 0.320.03 | 68.2 | -209.5 | -85.7 | h |
| HD 166913 | 0.300.00 | 0.390.02 | 0.400.07 | 0.390.04 | 0.270.02 | 0.350.02 | -44.3 | -44.5 | 67.6 | tk/h |
| HD 175179 | 0.450.01 | 0.530.01 | 0.410.04 | 0.400.01 | 0.360.03 | 0.340.02 | 96.0 | -102.0 | -19.0 | tk |
| HD 188510 | 0.360.01 | 0.430.01 | 0.370.00 | 0.380.00 | 0.360.03 | 0.420.02 | -141.1 | -109.4 | 71.6 | tk/h |
| HD 189558 | 0.340.01 | 0.420.02 | 0.410.04 | 0.400.01 | 0.300.03 | 0.330.03 | 89.0 | -109.0 | 48.0 | tk |
| HD 195633 | 0.190.02 | 0.270.01 | 0.250.06 | 0.220.02 | 0.110.03 | 0.120.03 | -48.3 | -15.7 | -3.5 | tn |
| HD 205650 | 0.260.01 | 0.340.01 | 0.360.03 | 0.360.02 | 0.200.01 | 0.230.02 | -114.0 | -71.0 | 18.0 | tk |
| HD 298986 | 0.060.03 | 0.150.02 | 0.210.06 | 0.200.04 | 0.120.01 | 0.190.02 | 250.1 | -138.0 | 163.3 | h |
-
1.
The [Cu/Fe] ratios are under-abundant for metal-poor stars, and there is an indication that [Cu/Fe] decreases with decreasing metallicity within [Fe/H] . While, it may increase for very metal-poor stars with [Fe/H] -3.0, which need to be confirmed with more objects.
-
2.
Our NLTE result confirms that the low sample stars are also with lower copper abundance found by Nissen & Schuster (2011).
-
3.
The NLTE effects of Cu I lines are sensitive to the metallicity, and they increase with decreasing metallicity. The NLTE effects can reach 0.5 dex for very metal-poor stars, which can explain the large difference of copper abundance derevied from Cu II and Cu I resonance lines noted by (Roederer et al., 2014; Roederer & Barklem, 2018). It is also need to be pointed out that the NLTE effects are different from line to line, and the weak lines are less sensitive to NLTE effects, while the strong resonance 3247 and 3273 Å lines show large NLTE effects.
-
4.
Compared with the model 1 of Romano et al. (2010) our results suggest that, similar as elements, copper is mainly produced by massive type II SNe.
Our results indicate that it is important to perform NLTE abundance analysis for Cu I lines for very metal-poor stars.
References
- Andrievsky et al. (2017) Andrievsky, S., Bonifacio, P., Caffau, E., Korotin,S., et al. 2018, MNRAS, 473, 3377
- Anstee & O’Mara (1991) Anstee, S. D., O’Mara, B. J., 1991, MNRAS, 253, 549
- Anstee & O’Mara (1995) Anstee, S. D.,& O’Mara, B. J., 1995, MNRAS, 276, 859
- Arlandini et al. (1999) Arlandini, C., Kppeler, F., Wisshak, K., et al. 1999, ApJ, 525, 886
- Asplund et al. (2009) Asplund, M., Grevesse, N., Sauval, A. J., & Scott, P. 2009, ARA&A, 47, 481
- Bagbulo et al. (2005) Bagbulo, S., Jehin E., & Ledoux C., et al. 2005, ESO messenger, 114, 10
- Biehl (1976) Biehl, D., PhD thesis, Univ. Kiel, 1976
- Bihain et al. (2004) Bihain, G., Israelian, G., Rebolo, R., Bonifacio, P., & Molaro, P., 2004, A&A, 423, 777
- Bonifacio, Caffau & Ludwig (2010) Bonifacio, P., Caffau, E., & Ludwig, H.-G. 2010, A&A, 524, 96
- Butler & Giddings (1985) Butler, K., & Giddings J. 1985, Newsletter on the analysis os astronomical spectra No. 9, University of London
- Canuto & Mazzitelli (1992) Canuto, V. M., & Mazzitelli, I. 1992, ApJ, 389, 724
- Carretta et al. (2010) Carretta, E., Bragaglia, A., Gratton, R. G., et al. 2010, A&A, 520, A95
- Carretta et al. (2014) Carretta, E., Bragaglia, A., Gratton, R. G., et al., 2014, A&A, 564, A60
- Carretta et al. (2015) Carretta, E., Bragaglia, A., Gratton, R. G., et al., 2015, A&A, 578, A166
- Cayrel et al. (2004) Cayrel, R., Depagne, E., Spite, M., Hill, V., Spite, F. et al. 2004, A&A, 416, 1117
- Colucci et al. (2012) Colucci1, J. E., Bernstein, R. A., Cameron, S. A., & McWilliam, A. 2012, ApJ, 746, 29
- Cunha et al. (2002) Cunha, K., Smith, V. V., Suntzeff, N. B., et al. 2002, AJ, 124, 379
- Delgado Mena et al. (2017) Delgado Mena, E., Tsantaki, M., Adibekyan, V. Zh., Sousa, S. G., Santos, N. C., González Hernández, J. I., & Israelian, G., 2017, A&A, 606, A94
- Fink et al. (2014) Fink, M., Kromer, M., Seitenzahl, I. R., et al., 2014, MNRAS, 438, 1762
- Gaia Collaboration et al. (2016) Gaia Collaboration, Prusti, T., de Bruijne, J. H. J., et al. 2016, A&A, 595, A1
- Gehren et al. (2004) Gehren, T., Liang, Y. C., Shi, J. R., et al. 2004, A&A, 413, 1045
- Goswami & Prantzos (2000) Goswami A., & Prantzos N., 2000, A&A, 359, 191
- Gratton & Sneden (1988) Gratton, R. G., & Sneden, C., A&A, 204,193
- Grupp (2004) Grupp, F. 2004, A&A, 420, 289
- Grupp, Kurucz & Tan (2009) Grupp, F., Kurucz, R. L., & Tan, K. F. 2009, A&A, 530, 177
- Ishigaki, Aoki & Chiba (2013) Ishigaki, M. N., Aoki, W., & Chiba, M., 2013, ApJ, 771, 67
- Iwamoto et al. (1999) Iwamoto, K., Brachwitz, F., Nomoto, K. et al. 1999, ApJS, 125, 439
- Johnson, Ivans, & Stetson (2006) Johnson, J. A., Ivans, I. I., & Stetson, P. B., 2006, ApJ, 640, 801
- Johnson et al. (2014) Johnson, C. I., Rich, R. M., Kobayashi, C., Kunder, A., & Koch, A., 2014, AJ, 148, 67
- Kobayashi et al. (2006) Kobayashi, C., Umeda H., Nomoto, K., Tominaga, N., Ohkubo, T., 2006, ApJ, 653, 1145
- Koch & McWilliam (2014) Koch, A., & McWilliam, A., 2014, A&A, 565, A23
- Mucciarelli et al. (1993) Matteucci, F., Raiteri, C. M., Busson, M., Gallino, R., & Gratton, R., 1993, A&A, 272, 421
- Lai et al. (2008) Lai, D. K., Bolte, M., Johnson, J. A., Lucatello, S., Heger, A., & Woosley, S.E., 2008, ApJ, 681, 1524
- Limongi & Chieffi (2003) Limongi, M., & Chieffi, A., 2003, ApJ, 592, 404
- Liu et al. (2014) Liu, Y. P., Gao, C., Zeng, J. L., Yuan, J. M., & Shi, J. R. 2014, ApJS, 211, 30
- Mashonkina et al. (2011) Mashonkina, L., Gehren, T., Shi, J. R., Korn, A. J., & Grupp, F., 2011, A&A, 528, A87
- Mashonkina et al. (2017) Mashonkina, L., Jablonka, P., Pakhomov, Yu., Sitnova, T., & North, P., 2017, A&A, 604, A129
- Mashonkina et al. (2017) Mashonkina, L., Sitnova, T., & Belyaev, A. K., 2017, A&A, 605, A53
- McWilliam (2016) McWilliam, A., 2016, PASP, 33, 40
- McWilliam & Smecker-Hane (2005) McWilliam, A. & Smecker-Hane, T., A., 2005, ApJ, 622, 29
- McWilliam et al. (2013) McWilliam, A., Wallerstein, G., & Mottini, M., 2013, ApJ, 778, 149
- Mikolaitis et al. (2017) Mikolaitis, Š., de Laverny, P., Recio CBlanco, A., Hill, V., Worley, C. C., & de Pascale, M., 2017, A&A, 600, A22
- Mishenina et al. (2011) Mishenina, T. V., Gorbaneva, T. I., Basak, N. Yu., Soubiran, C., & Kovtyukh, V. V., 2011, Astronomy Reports, 55, 680
- Mishenina et al. (2002) Mishenina, T. V., Kovtyukh, V. V., Soubiran, C., Travaglio, C., & Busso, M., 2002, A&A, 396, 189
- Nissen & Schuster (2010) Nissen, P. E., & Schuster, W. J., 2010, A&A, 511, L10
- Nissen & Schuster (2011) Nissen, P. E., & Schuster, W. J., 2011, A&A, 530, A15
- Noguchi, Aoki & Kawanomoto (2002) Noguchi, K., Aoki, W., & Kawanomoto, S., 2002, PASJ, 54, 855
- Pancino et al. (2002) Pancino, E., Pasquini, L., Hill, V., Ferraro, F. R., & Bellazzini, M., ApJS, 568, 101
- Pignatari et al. (2010) Pignatari, M., Gallino, R., Heil, M., Wiescher, M., Käppeler, F., Herwig, F. and Bisterzo, S., ApJ, 710, 1557
- Pompéia et al. (2008) Pompéia, L., Hill, V., Spite, M., et al. 2008, A&A, 480, 379
- Primas et al. (2000) Primas, F., Brugamyer, E., Sneden, C., et al. 2000, LIACo, 35, 119
- Reddy & Lambert (2008) Reddy, B. E., & Lambert, D. L., 2008, MNRAS, 391, 95
- Reddy et al. (2006) Reddy, B. E., Lambert, D. L., Allende Prieto, C., MNRAS, 367, 1329
- Reddy et al. (2003) Reddy, B. E., Tomkin, J., Lambert, D. L., & Allende Prieto, C., 2003, MNRAS, 340, 304
- Reetz (1991) Reetz, J. K. 1991, PhD thesis, Universität München
- Raiteri, Gallino & Busso (1992) Raiteri, C. M., Gallino, R., & Busso, M., 1992, ApJ, 387, 263
- Roederer & Barklem (2018) Roederer, I. U., & Barklem, P.S., 2018, ApJ, 857, 2
- Roederer & Lawler (2012) Roederer, I. U., & Lawler, J.E., 2012, ApJ, 750, 76
- Roederer et al. (2014) Roederer, I. U., Schatz, H., Lawler, J. E., et al. 2014, ApJ, 791, 32
- Romano et al. (2010) Romano, D., Karakas, A. I., Tosi, M., & Matteucci, F., A&A, 2010, 522, A32
- Romano & Matteucci (2007) Romano, D., & Matteucci, F., 2007, MNRAS, 378, L59
- Rybicki & Hummer (1991) Rybicki, G. B., & Hummer, D. G. 1991, A&A, 245, 171
- Rybicki & Hummer (1992) Rybicki, G. B., & Hummer, D. G., 1992, A&A, 262, 209
- Sakari, McWilliam & Wallerstein (2017) Sakari, C. M., McWilliam, A., & Wallerstein, G., 2017, arXiv:1701.03802
- Shetrone et al. (2003) Shetrone, M., Venn, K. A., Tolstoy, E., Primas, F., Hill, V., & Kaufer, A., 2003, AJ, 125, 684
- Shi et al. (2009) Shi, J. R., Gehren, T., Mashonkina, L., & Zhao, G., 2009, A&A, 503, 533
- Shi et al. (2014) Shi, J. R., Gehren, T., Zeng, J. L., Mashonkina, L., & Zhao, G. 2014, ApJ, 782, 80
- Shi, Gehren & Zhao (2004) Shi, J. R., Gehren, T., & Zhao, G., 2004, A&A, 423, 683
- Simmerer et al. (2003) Simmerer, J., Sneden, C., Ivans, I. I., Kraft, R. P., Shetrone, M. D., & Smith, V. V., 2003, AJ, 125,2018
- Siqueira-Mello et al. (2015) Siqueira-Mello, C., Andrievsky, S. M., Barbuy, B., Spite, M., Spite, F., & Korotin, S. A., 2015, A&A, 584, A86
- Smith et al. (2000) Smith, V. V., Suntzeff, N. B., Cunha, K., et al., 2000, AJ, 119, 1239
- Sneden & Crocker (1988) Sneden, C., & Crocker, D. A., ApJ, 335, 406
- Sneden et al. (1991) Sneden, C., Gratton, R. G., & Crocker, D. A., A&A, 246, 354
- Sbordone et al. (2007) Sbordone, L., Bonifacio, P., Buonanno, R., et al. 2007, A&A, 465, 815
- Tan, Shi & Zhao (2009) Tan, K. F., Shi, J. R., & Zhao, G., 2009, MNRAS, 392, 205
- Timmes, Woosley & Weaver (1995) Timmes, F. X., Woosley, S. E., & Weaver, T. A., 1995, ApJS, 98, 617
- Travaglio et al. (2004) Travaglio, C., Hillebrandt, W., Reinecke, M., Thielemann, F. -K., A&A, 2004, 425, 1029
- Villanova et al. (2013) Villanova, S., Geisler, D., Carraro, G.; Moni Bidin, C., & Muñoz, C., 2013, ApJ, 778, 186
- Villanova et al. (2017) Villanova, S., Moni Bidin, C., Mauro, F., Munoz, C., & Monaco, L., 2017, MNRAS, 464, 2730
- Woosley & Weaver (1995) Woosley, S. E., & Weaver, T. A., 1995, ApJS, 101, 181
- Yan et al. (2016) Yan, H. L., Shi, J. R., Nissen, P. E., & Zhao, G., 2016, A&A, 585, A102
- Yan, Shi & Zhao (2015) Yan, H. L., Shi, J. R., & Zhao, G., 2015, ApJ, 802, 36
- Zhao et al. (2016) Zhao, G., Mashonkina, L., Yan, H. L., Alexeeva, S., Kobayashi, C., et al., 2016, ApJ, 833, 225
- Zhang et al. (2016) Zhang, J. B., Shi, J. R., Pan, K. K., Allende Prieto, C., & Liu, C., 2016, ApJ, 833, 137
- Zhang et al. (2017) Zhang, J. B., Shi, J. R., Pan, K. K., Allende Prieto, C., & Liu, C., 2017, ApJ, 835, 90