Investigation of the High-Energy Emission from the Magnetar-like Pulsar PSR J11196127 after the 2016 Outburst
Abstract
PSR J11196127 is a radio pulsar that behaved magnetar like bursts, and we performed a comprehensive investigation of this pulsar using the archival high-energy observations obtained after its outburst in 2016 July. After the 2016 outburst, specific regions on the neutron star surface were heated up to and keV from 0.2 keV. A hard non-thermal spectral component with a photon index 0.5 related to the magnetospheric emission can be resolved from the NuSTAR spectra above 10 keV. We find that the thermal emitting regions did not cool down and gradually shrank by about 20–35% four months after the outburst. Hard X-ray pulsations were detected with NuSTAR immediately after the outburst, at 5 confidence level and with a background-subtracted pulsed fraction of %. However, the signal became undetectable after a few days. Using Fermi data, we found that the gamma-ray emission in 0.5–300 GeV was suppressed along with the disappearance of the radio pulsations. This is likely caused by a reconfiguration of the magnetic field. We also discovered that the timing noise evolved dramatically, and the spin-down rate significantly increased after the 2016 glitch. We proposed that post-outburst temporal and spectral behaviors from radio to gamma-ray bands were caused by changes of the magnetosphere structure, pair plasma injection and the shrinking emission sites on the neutron star.
Subject headings:
methods: data analysis — pulsars: individual (PSR J11196127) — X-rays: bursts — gamma rays: stars — magnetic fields1. Introduction
Magnetars are a special class of pulsars that have relatively long spin periods and extremely strong surface magnetic field of – G (Kaspi & Beloborodov, 2017) although some of them can have relatively weak surface fields (e.g., G for SGR 0418+5729; Rea et al. 2013). The soft X-ray emission of magnetars is commonly believed to be powered by the decay of the magnetic field (Thompson & Duncan, 1996). One of the most intriguing features for magnetars is bursts in hard X-rays/soft -rays (Woods & Thompson, 2006; Ng et al., 2011; Pons & Rea, 2012) when the local magnetic stress becomes too strong to be balanced by the restoring force of the crust or the reconnection of the magnetic field leads to the change of the magnetosphere structure. Some rotation-powered pulsars (RPPs) with a high surface magnetic field strength ( G; hereafter, high- pulsars) show similar outburst activities and are now considered as the transitional objects between canonical RPPs and magnetars (Kaspi & McLaughlin, 2005; Ng & Kaspi, 2011; Hu et al., 2017). High- pulsars and magnetars also share similar features in their outburst activities, glitch sizes and the inferred level of timing noise. Studies of high- pulsars is essential to unify the connection between magnetars and isolated neutron stars (NS)/radio pulsars (Pons & Geppert, 2007; Perna & Pons, 2011; Viganò et al., 2013). Most high- pulsars were detected in the radio band (e.g., PSRs J17183718, J18141733, J18141733: Hobbs et al. 2004; Camilo et al. 2000; McLaughlin et al. 2003) and a few of them are radio-quiet (e.g., PSR J18460258: Archibald et al. 2008; Gavriil et al. 2008). Similar to some transient magnetars (e.g., 1E 1547.05408; Burgay et al. 2009), intermittent and variable radio pulses were detected from some high- pulsars (Thompson, 2008). Among this class of objects, PSR J11196127 is a particularly interesting case because it has a confirmed rotational period of 408 ms detected in the radio (Camilo et al., 2000), X-ray (Gonzalez et al., 2005) and -ray (Parent et al., 2011) bands, which permits a rich, multiwavelength investigation.
PSR J11196127 is associated with the supernova remnant (SNR) G292.20.5 (Pivovaroff et al., 2001; Ng et al., 2012), and its pulsar wind nebula (PWN) was resolved by Chandra (Gonzalez & Safi-Harb, 2003). Based on the measurements through Hi absorption, the distance of the pulsar is inferred to be 8.4 kpc (Caswell et al., 2004). According to the detected spin down rate (Camilo et al., 2000), the inferred surface magnetic field is G and the spin-down luminosity is erg s-1. The characteristic age was estimated as 1600 yr with the breaking index determined from radio timing data over 12 years (Weltevrede et al., 2011). PSR J11196127 experienced three glitches in 1999, 2004 and 2007 (Camilo et al., 2000; Weltevrede et al., 2011; Antonopoulou et al., 2015), but no outburst event was detected before. Recoveries were observed following all these glitches (Weltevrede et al., 2011), similar to that of many pulsars and magnetars (Dib et al., 2008).
The Gamma-Ray Burst Monitor onbroad the Fermi Gamma-ray Space Telescope was triggered by a magnetar-like burst of PSR J11196127 on 2016 July 27 (Younes et al., 2016), and Neil Gehrels Swift Observatory (hereafter Swift) Burst Alert Telescope also reported a similar burst after a few hours (Kennea et al., 2016). The known X-ray pulsations were subsequently confirmed by the X-Ray Telescope (XRT) onboard Swift (Antonopoulou et al., 2016), and several investigations were performed to study its timing and spectral behavior in the post-outburst stage (Archibald et al., 2016b; Majid et al., 2016). Based on the detailed examination with S/N-based search and Bayesian blocks algorithm, 13 short X-ray bursts were identified between 2016 July 26 and 28 (Göğüş et al., 2016). The pulsar showed spin-up glitch of Hz and Hz s-1 soon after the onset of 2016 outburst (Archibald et al. 2016a; hereafter, after the 2016 outburst). The initial follow-up radio observations did not detect any pulsations, but the signal re-emerged over a large frequency band with different pulse profiles in 2016 mid-Aug (Majid et al., 2017). Such a transient radio emission feature could be associated with the glitching activity as seen from magnetars (Camilo et al., 2006). In addition, there was a significant difference in the radio pulse profile shape before and after the outburst, from single peaked to a complex profile with multiple components at 1.4 GHz (Archibald et al., 2017). All the observed features, including the outburst behavior and the unusual change of the radio profiles, are similar to those of transient magnetars.
The X-ray spectrum of PSR J11196127 consists of thermal and non-thermal components in the quiescent state, (Gonzalez et al., 2005; Safi-Harb & Kumar, 2008; Ng et al., 2012). The thermal emission can be attributed to a hotspot with keV or NS atmospheric emission with –0.17 keV, and the non-thermal component can be described by a simple power-law (PL) with a photon index () of 1.6–2.1. The -ray spectrum can be characterized with a PL with an exponential cutoff (PLEC), similar to other RPPs (Parent et al., 2011). After the 2016 outburst, the X-ray spectrum was dominated by a thermal component, and the PL component became harder with a photon index of , extending to the hard X-ray band (Archibald et al., 2016a). The 0.5–10 keV luminosity is erg s-1, corresponding to 15% of the pulsar spin-down power and is comparable to the pre-outburst -ray ( GeV) luminosity (Parent et al., 2011). At the end of 2016 Oct, a single PL with a softer photon index of was sufficient to model the X-ray spectrum (Blumer et al., 2017).
In this paper, we analyze the publicly available high-energy observations taken after the outburst. The observations are described in Section 2. We search for spin periodicities via data counting statistics at different epochs. Then we trace the spin period evolution with phase-coherent analysis. We obtained the X- and -ray spectra before and after the outburst, and performed a quantitative comparison. The results are presented in Section 3. Based on our results, we present a coherent picture and discuss emission scenarios in Section 4. A global magnetosphere reconfiguration could serve as the most possible origin. Our contribution and two recent published articles including the long-term investigations of PSR J11196127 in the radio (Dai et al., 2018) and X-ray bands (Archibald et al., 2018) can certainly provide a better understanding to the outburst/glitch event that occurred in this pulsar and further clarify its connection to transient radio RPPs and magnetars.
2. High-energy Observations
In order to characterize the high-energy emission of PSR J11196127, we analyzed the archival data obtained from Swift, XMM-Newton, Nuclear Spectroscopic Telescope Array (NuSTAR) and Fermi observatories. The pulsar position at RA=, dec.= (J2000), which was obtained from Chandra (Safi-Harb & Kumar, 2008; Blumer et al., 2017), to perform the timing analysis of X-ray observations. All the photon arrival times were corrected to the barycentric dynamical time (TDB) with the JPL DE200 solar system ephemeris at the source position determined by Chandra (Safi-Harb & Kumar, 2008) for all the datasets.
| Start obs. date | Instruments | Duration | ObsID | Photons | Epoch zeroa | Spin frequencyb | / | Chance |
| (ks) | (MJD) | (Hz) | prob. | |||||
| 2016-07-28* | Swift/XRT | 35.4 | 00034632001 (catalog http://www.swift.ac.uk/archive/browsedata.php?oid=00034632001&source=obs) | 3846 | 57598.0 | 2.439842(1) | 503/571 | |
| 2016-07-28* | NuSTAR/FPM | 82.9 | 80102048002 (catalog https://heasarc.gsfc.nasa.gov/FTP/nustar/data/obs/01/8/80102048002) | 32265 | 57598.5 | 2.4398409(2) | 5820/6980 | |
| 2016-07-31* | Swift/XRT | 17.9 | 00034632002 (catalog http://www.swift.ac.uk/archive/browsedata.php?oid=00034632002&source=obs) | 424 | 57600.2 | 2.43983(2) | 28.6/47.6 | |
| 2016-08-05 | NuSTAR/FPM | 127.0 | 80102048004 (catalog https://heasarc.gsfc.nasa.gov/FTP/nustar/data/obs/01/8/80102048004) | 40275 | 57606.0 | 2.4398219(1) | 7670/9310 | |
| 2016-08-06 | XMM/pn | 20.1 | 0741732601 (catalog http://nxsa.esac.esa.int/nxsa-web/#obsid=0741732601) | 25530 | 57606.6 | 2.4398214(8) | 7070/7990 | |
| 2016-08-09 | Swift/XRT | 57.6 | 00034632007 (catalog http://www.swift.ac.uk/archive/browsedata.php?oid=00034632007&source=obs) | 1376 | 57609.5 | 2.439814(2) | 151/177 | |
| 2016-08-10 | Swift/XRT | 5.9 | 00034632008 (catalog http://www.swift.ac.uk/archive/browsedata.php?oid=00034632008&source=obs) | 339 | 57610.25 | 2.43979(3) | 64.5/79.9 | |
| 2016-08-14 | NuSTAR/FPM | 170.8 | 80102048006 (catalog https://heasarc.gsfc.nasa.gov/FTP/nustar/data/obs/01/8/80102048006) | 32473 | 57615.0 | 2.4397973(1) | 5340/6320 | |
| 2016-08-15 | XMM/pn | 27.9 | 0741732701 (catalog http://nxsa.esac.esa.int/nxsa-web/#obsid=0741732701) | 26060 | 57616.0 | 2.4397945(6) | 7020/7850 | |
| 2016-08-26 | Swift/XRT | 70.5 | 00034632010 (catalog http://www.swift.ac.uk/archive/browsedata.php?oid=00034632010&source=obs) | 627 | 57627.0 | 2.439746(3) | 49.4/54.1 | |
| 2016-08-30 | XMM/pn | 32.5 | 0741732801 (catalog http://nxsa.esac.esa.int/nxsa-web/#obsid=0741732801) | 19466 | 57630.3 | 2.4397218(6) | 4960/5540 | |
| 2016-08-30 | Swift/XRT | 17.9 | 00034632011 (catalog http://www.swift.ac.uk/archive/browsedata.php?oid=00034632011&source=obs) | 542 | 57630.4 | 2.439720(8) | 78.1/105 | |
| 2016-08-30 | NuSTAR/FPM | 166.5 | 80102048008 (catalog https://heasarc.gsfc.nasa.gov/FTP/nustar/data/obs/01/8/80102048008) | 20878 | 57631.0 | 2.4397154(2) | 1810/1880 | |
| 2016-09-27 | Swift/XRT | 6.4 | 00034632020 (catalog http://www.swift.ac.uk/archive/browsedata.php?oid=00034632020&source=obs) | 527 | 57658.05 | 2.43964(2) | 72.7/99.9 | |
| 2016-12-12 | NuSTAR/FPM | 183.3 | 80102048010 (catalog https://heasarc.gsfc.nasa.gov/FTP/nustar/data/obs/01/8/80102048010) | 2118 | 57735.0 | 2.4391775(8) | 175/203 | |
| 2016-12-13 | XMM/pn | 47.5 | 0762032801 (catalog http://nxsa.esac.esa.int/nxsa-web/#obsid=0762032801) | 4053 | 57735.5 | 2.439177(1) | 954/1020 | |
| a The time zero determined in the periodicity search. | ||||||||
| b The uncertainties quoted in parentheses were assessed by Eq. 6a in Leahy (1987). | ||||||||
| ∗ Data sets also used by Archibald et al. (2016a) to generate the timing ephemeris. | ||||||||
2.1. Fermi
We obtained the Fermi Large Area Telescope (LAT) Pass 8 (P8R2) data in the energy range of 0.5-300 GeV. This range was chosen to minimize avoid the serious contamination by other sources in the source-crowded region (Parent et al., 2011). We considered the LAT data collected within 2013 November (MJD )–2016 December (MJD ). Photons in a circular region of interest within and from the position of 3FGL J1119.16127, corresponding to PSR J11196127, determined in the LAT 4-year point source catalog (Acero et al., 2015) are taken into account for spectral and temporal analysis, respectively. The data reduction was processed with Fermi Science Tools(v10r0p5).
We selected events in the class for the point source or Galactic diffuse analysis (i.e., event class 128) and considered photons collected in the front- and back-sections of the tracker (i.e., evttype = 3). We used the instrument response function “P8R2_SOURCE_V6” throughout this study. We also excluded events with zenith angles larger than to reduce contamination from Earth’s albedo -rays, and the data quality is constrained by the good-time-interval of the spacecraft (i.e., DATA_QUAL 0). In the timing analysis, all the photon arrival times were corrected to TDB with the task of gtbary supported under Fermi Science tools.
2.2. Neil Gehrels Swift
We considered all the XRT observations operated under the windowed timing (WT) mode to perform the timing analysis, since only this mode provides a high enough time resolution of 1.76 ms. All the data were obtained from the HEASARC111https://heasarc.gsfc.nasa.gov/docs/archive.html archive, and we obtained the light curves and spectra using the XRTGRBLC task in the HEASOFT package (v.6.22). We extracted the source counts from a box region of , which is the default setting of the XRTGRBLC task. Only photon energies in the range of 0.3–10 keV with grades 0–2 were included for further analysis. We corrected the photon arrival times to TDB using the HEASOFT task of barycorr.
2.3. XMM-Newton
After the outburst, XMM-Newton observed PSR J11196127 on August 6, 15, 30 and December 13 of 2016, with exposure of 21.6 ks, 29.5 ks, 34 ks and 49 ks, respectively. All the EPIC cameras were operated in the small window mode with the thin filter. We considered single- to quadruple-pixel events (PATTERN=0–12) for MOS and single and double events (PATTERN=0–4) for PN. All the data reduction was performed using the latest XMM-Newton Science Analysis Software (XMMSAS version 16.1.0). We also filtered out artifacts from the calibrated and concatenated dataset and put the most conservative events screening criteria as “FLAG==0”. We removed all the photons collected in short bursts (e.g., Archibald et al. 2017) and time intervals contaminated by X-ray background flares in both timing and spectral analyses. We extracted events in 0.15–12 keV from a 20″ radius region centered on the Chandra position. Note that this radius encircles % of the energy. We corrected the photon arrival times to TDB using the XMMSAS task barycen for the following timing analysis. In the spectral analysis, we determined the background in the nearby source-free region and generated the response matrices and ancillary response files with the XMMSAS tasks rmfgen and arfgen.
2.4. NuSTAR
Non-thermal X-rays related to PSR J11196127 can have higher energy after bursts, so we also included the NuSTAR observations, which has an effective energy range in 3–79 keV (Harrison et al., 2013). NuSTAR started to observe PSR J11196127 following the main magnetar-like outburst on 2016 July 28. Each data of NuSTAR was observed with the onboard focal plane modules A and B (FPMA/B). Excluding two slew observations and some with exposure less than 1 ks, we have five observations of 2016 July 28, Aug 5, 14, 30 and Dec 12, corresponding to exposure of 54.4 ks, 87.2 ks, 95.4 ks, 92.1 ks and 94.3 ks, respectively. We carried out detailed temporal and spectral analysis on the later four datasets, which were jointly observed with XMM-Newton. We only performed the temporal analysis on the first dataset (ObsID 80102048002) since the joint spectral fit with the Swift observation has previously been reported (Archibald et al., 2016a).
We also used the HEASOFT package (v.6.22) together with NuSTARDAS v1.8.0 and the updated NuSTAR calibration database (CALDB version 20171204) to for the data analysis. We adopted a source region of radius (and for the last observation, during which the source was faint) and a source-free background region with a radius of . We extracted events with the pulse-invariant channel of 35–1909, which corresponds to the default energy range of 3–79 keV and generated the response matrices using the nuproducts tasks. Similar to the Swift data, we also used the barycorr task to perform the barycentric time correction.


3. Results
We analyzed the X-ray and -ray data of PSR J11196127mentioned in section 2 and inspected the spin periodicity and spectral behavior of our target at different epochs. In the following subsections, we will present the detailed procedures in our analyses and the complete results.
3.1. X-Ray Timing Analysis
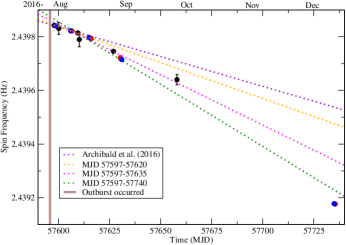
We only utilized the data obtained with the PN camera for XMM-Newton observations to perform timing analysis because of its sufficient temporal resolution (5.7 ms). We extrapolated the pre-outburst timing solution to search for the periodic signals among all the X-ray data. We performed 100 trials with a step size determined by the Fourier width (i.e., 1/time span of the data). Only spin frequencies with a chance probability of the signal less than (i.e., 5 confidence level) yielded from -statistics (de Jager & Büsching, 2010) are presented in Table 1. Because the pulse profiles are mostly single peaked, all the results also correspond to a significant Rayleigh power (Mardia, 1972; Gibson et al., 1982), except for Obs ID. 00034632002 investigated by Swift. The evolution of the spin frequency, detected in X-ray data, is shown in Fig. 1, and the spin-down rate drastically increased after the end of 2016 July.
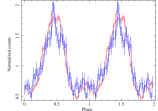
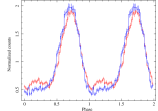
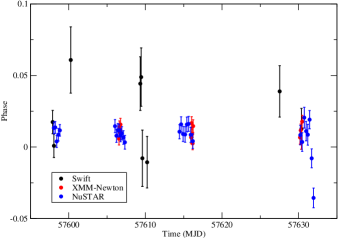
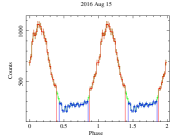
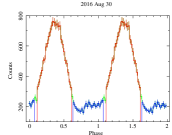
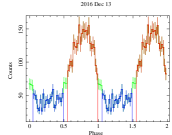
Fig. 2 shows the folded light curves in the different energy bands. In the soft X-ray (0.15 or 0.3 keV) and medium (3–10 keV) bands, there is no significant structural change with aligned pulsed peaks in the pulse profile, consistent with that reported by Archibald et al. (2016a). In the hard X-ray band (10–79 keV), we found a double-peaked pulse profile on July 28–29 with a false alert probability of through -statistics. Nevertheless, the hard X-ray pulsations became much weaker after Aug and were only detected at less than 3 level.
We traced the Times-of-Arrivals (TOAs; Ray et al. 2011) inferred from the positive detections mentioned in Table 1, using a maximum likelihood method (Livingstone et al., 2009), to account for the influence of timing noise. Because the X-ray instruments cover different effective energy ranges, we folded the data covering the similar observational time with the same ephemeris and examined the structure change of pulse profiles. Fig. 3 shows examples of the comparison between the profiles obtained from different instruments. There is no obvious phase lag of the major peak determined in soft and hard X-rays, we therefore included all the X-ray data in the TOA analysis. Each TOA was determined with enough say, counts to resolve the position of the main peak in the pulse profile. To avoid the unbalanced weighting caused by lots of TOAs determined from XMM and NuSTAR over a short time interval, we determined one TOA with the duration of 5-8 ks for XMM data and 18-20 ks for Swift and NuSTAR observations.
| Parameter | |
|---|---|
| Pulsar name | PSR J11196127 |
| Valid MJD range | 57598–57616 |
| Right ascension, | 11:19:14.26* |
| Declination, | 61:27:49.3* |
| Pulse frequency, (s-1) | 2.4398374(1) |
| First derivative of pulse frequency, (s-2) | |
| Second derivative of pulse frequency, (s-3) | |
| Third derivative of pulse frequency, (s-4) | |
| Epoch of frequency determination (MJD) | 57600 |
| Time system | TDB |
| RMS timing residual (ms) | 3.5 |
| /dof | 1.30/34 |
| Valid MJD range | 57598–57632 |
| Pulse frequency, (s-1) | 2.4398376(2) |
| First derivative of pulse frequency, (s-2) | |
| Second derivative of pulse frequency, (s-3) | |
| Third derivative of pulse frequency, (s-4) | |
| Fourth derivative of pulse frequency, (s-5) | |
| Fifth derivative of pulse frequency, (s-6) | |
| Sixth derivative of pulse frequency, (s-7) | |
| RMS timing residual (ms) | 3.5 |
| /dof | 1.41/45 |
*A FWHM value in 2.3-10 keV is ″ (Safi-Harb & Kumar, 2008).
Note: the numbers in parentheses denote errors in the last digit.
More high-order terms are required in an extensive solution to MJD 57632 to describe the timing noise.
From MJD to MJD 57,616, two high-order polynomial terms ( and ) are required to describe the timing noise, and the result is shown in Table 2. We note that the derived spin frequency and the spin-down rate are consistent with those determined by Archibald et al. (2016a). If we extend the effective time range of the pulsar ephemeris for more than half a month, the modified solution can be referred to the lower panel of Table 2 and the timing residuals are displayed in Fig. 4. We found that more high-order terms are needed, and such a feature can also be applied to characterize the change of the spin-down rate in different time interval as shown in Fig. 1. Since the next positive detection after MJD is one month later and the uncertainties in the timing solution are large, these will lead to cycle count ambiguity in the following TOA analysis and we could not further extend the ephemeris of PSR J11196127.
3.2. -Ray Light Curve and Spectrum
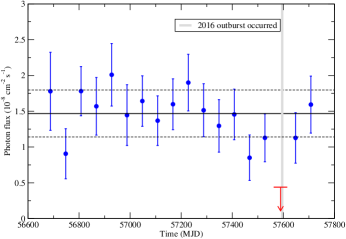
We performed unbinned likelihood analysis using the “NewMinunit” optimization algorithm to derive the flux of our target. Spectral parameters of other sources in the region of interest (ROI) is based on the LAT 4-year point source (3FGL; Acero et al. 2015) catalog, and the standard templates of Galactic and isotropic background (gll_iem_v06.fits and iso_P8R2_SOURCE_V6.txt) were also included in our analysis. The spectral parameters of each source including PSR J11196127 in ROI are thawed, and we assumed the PLEC model for our target. We divided the data into 60-day bins to investigate the variation of the source flux. This result is shown in Fig. 5. Between MJD 57,570–57,630, the pulsar experienced a magnetar-like outburst, but the -ray flux was below the detection level, therefore we only report the flux upper limit. Even though we considered a smaller time bin (e.g., 30 days) around the outburst or included lower energy band to investigate the -ray flux of PSR J11196127, the source flux is still significantly lower than its long-term average.
The -ray spectrum above 0.5 GeV from MJD 57,560–57,630 can be described by a PLEC model with a photon index of 1.5 and a cutoff energy of 3.1 GeV. The test-statistic (TS) value (Mattox et al., 1996) was only 8.4, corresponding to a confidence level less than 3, and it is much less significant than the detection at other epochs. If we consider a longer accumulation time (i.e., MJD 56,900–57,560) in the pre-outburst stage, the PLEC model has a consistent and a cutoff energy GeV (1 errors). It seems that the magnetar-like outburst suppressed the -ray emission from the pulsar but the major -ray emission mechanism did not have a significant change.
Because the post-outburst ephemeris of PSR J11196127 was seriously contaminated by the timing noise, it is difficult to investigate the -ray pulsation through a blind search. After the outburst, the effective time range of the pulsar ephemeris determined in the X-ray band (Table 2) is still too short, and Fermi-LAT cannot accumulate enough photons to detect the -ray pulsation.
3.3. Phase-Averaged X-Ray Spectral Analysis
We concentrate the post-outburst spectral analysis with XMM-Newton and NuSTAR observations because Swift XRT and XMM-Newton EPIC cover a similar energy range but the effective area of Swift/XRT is much smaller. The spectrum obtained from each observation was rebinned with different counts (e.g., 25, 50, 75 or 100) per channel to ensure the statistic, and the choice of the minimum was decided according to the total photons received from our target.
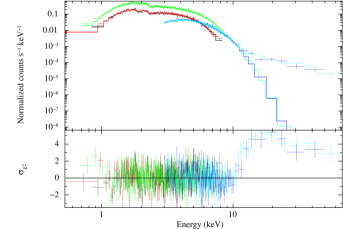
We fit the XMM-Newton and NuSTAR spectra jointly, since they cover a similar observational time interval. We inspected the spectral behavior of PSR J11196127 within 0.5–65 keV because the number of photons is insufficient beyond this energy range. We also introduced a constant in the fit to account for the cross-calibration mismatch between three EPIC cameras and two FPMs and applied a photo-electric absorption using Wisconsin cross-sections (Morrison & McCammon, 1983). A single-component model did not give an acceptable result. We therefore tried the power-law plus blackbody radiation (BB) model and the 2BB model. However, except for the spectra obtained on 2016 Dec. 12–13, the two-component models also do not provide acceptable fits. We notice that double BB components can provide a good fit to the spectra below 10 keV as shown in the left panel of Fig. 6, and the excess in the hard X-ray band ( keV) can be described with an additional hard power-law. Even though PL+BB or 2BB model can provide an acceptable fit to the spectra obtained in 2016 mid-Dec, such an excess in the hard X-ray band is still clearly seen.
| Observed Time | Aug 05-06 | Aug 14-15 | Aug 30-31 | Dec 12-13 | |
|---|---|---|---|---|---|
| a | 1.45 | ||||
| 0.5 | 0.2 | 0.5 | -0.6 | ||
| PL | b | 0.023 | 0.010 | 0.020 | 0.001 |
| + | (keV) | 0.33 | 0.34 | 0.33 | 0.35 |
| (km) | 4.4 | 4.0 | 3.6 | 1.7 | |
| + | b | 0.34 | 0.28 | 0.21 | 0.058 |
| (keV) | 1.03 | 1.04 | 1.03 | 1.09 | |
| (km) | 0.98 | 0.81 | 0.67 | 0.21 | |
| b | 1.60 | 1.16 | 0.75 | 0.091 | |
| /d.o.f. | 1.13/2905 | ||||
| a | 1.52 | ||||
| PL | 0.5 | 0.2 | 0.5 | 0.2 | |
| + | b | 0.022 | 0.010 | 0.019 | 0.003 |
| NSAc | (eV) | 234 | 224 | 210 | 162 |
| + | b | 0.44 | 0.36 | 0.28 | 0.086 |
| BB | (keV) | 1.03 | 1.04 | 1.03 | 1.03 |
| (km) | 0.97 | 0.81 | 0.67 | 0.24 | |
| b | 1.59 | 1.16 | 0.74 | 0.096 | |
| /d.o.f. | 1.14/2909 | ||||
| a | 1.55 | ||||
| PL | 0.5 | 0.1 | 0.4 | 0.2 | |
| + | b | 0.021 | 0.0095 | 0.018 | 0.0030 |
| nsmaxd | (eV) | 250 | 240 | 224 | 172 |
| + | b | 0.49 | 0.41 | 0.31 | 0.095 |
| BB | (keV) | 1.03 | 1.05 | 1.03 | 1.04 |
| (km) | 0.96 | 0.80 | 0.66 | 0.23 | |
| b | 1.57 | 1.15 | 0.74 | 0.095 | |
| /d.o.f. | 1.14/2909 | ||||
a The linked absorption column density is in units of cm-2.
b The unabsorbed flux is measured in 0.5–10 keV and recorded in units of erg cm-2 s-1.
c We assumed an NS mass of 1.4 , a radius of 13 km and the magnetic field of G.
d 1.4 M⊙ in mass and 10 km of radius in size is used to derive the gravitational redshift. The model number is fixed as 1300 for magnetar-like pulsars. The emitting size is the same as c).
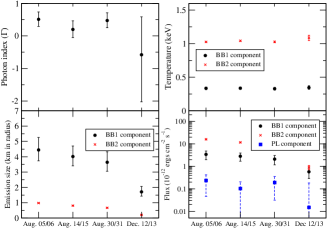
Note: the evolution of each parameter in the PL+2BB model is shown in Fig. 8.
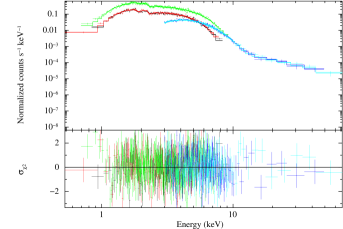
The mid-Dec spectra can be described by a PL+BB model ( for 283 dof) with a absorption column density () of cm-2, a photon index of and an emission site of km in radius with a blackbody temperature of keV. All the quoted errors of X-ray spectral parameters in this article correspond to 90% confidence interval for one parameter of interest, and a source distance 8.4 kpc was assumed (Caswell et al., 2004). The measured photon index is softer than the Chandra spectrum obtained in 2016 late Oct (Blumer et al., 2017). The unabsorbed 0.5–7 keV flux derived from our spectral model is erg cm-2 s-1, which is about 30%–50% lower than the non-thermal flux derived from the subsequent Chandra observation. The non-thermal component can be originated from the magnetospheric emission. On the other hand, we note that the soft X-ray photons (i.e., keV) of this component contribute to a substantial fraction of the pulsed photons to lead to a large pulsed fraction (%), indicating a non-thermal pulse detection. However, the pulse profiles determined in the soft and medium X-ray (i.e., 2.5–10 keV; dominated by BB component) bands have the same shape, which does not support a strong non-thermal component existed in the spectra.
Different from the post-outburst spectral fits to NuSTAR and Swift/XRT data of late July, we cannot obtain an acceptable fit with PL+BB model except for the spectra obtained in mid-Dec. We tried fitting the PL+BB model to the Dec 12–13 spectra, but obtained a totally different photon index () comparing with that on July 28–29 () determined in Archibald et al. (2016a). The non-thermal component in our spectra dominates the soft X-ray photons, but it in the fit to the spectra of NuSTAR and Swift/XRT mainly describes the hard X-ray tail. Because the PL+BB model also cannot provide acceptable fits to the post-outburst spectra obtained in 2016 Aug, we rejected it in our investigations. Table 3 lists the best-fit parameters of the three-component model, and this model is rather common to describe the spectral behavior for magnetars (Mong & Ng, 2018). Fig. 6 shows the fit to the mid-Aug spectra, and it clearly indicates that a composite model of two thermal and one power-law components (2BB+PL) can well describe the observational features. If we only consider the NuSTAR spectra in 3–65 keV, the composite model with a hard PL and a single BB component can give a good fit, and it may indicate that the cooler blackbody component was only detected by XMM-Newton due to its high sensitivity at low energy.
The double BB components determined in the 2BB+PL model can be characterized by a smaller emission site (i.e. 1 km in radius) with a higher temperature of 1.0 keV and a larger emission site of a few kilometers in radius with a lower temperature of 0.3–0.4 keV. The best-fit interstellar absorption determined with three-component model is cm-2, and this value is between the post-outburst absorptions determined by Archibald et al. (2016a) and Blumer et al. (2017). Comparing with the pre-outburst absorption, this value is also consistent with that from Chandra observations (Safi-Harb & Kumar, 2008) but obviously lower than that determined by the joint fit to both XMM-Newton and Chandra spectra (Ng et al., 2012). We find that the emission sizes of two hotspots can be larger but the hotspot temperature is similar if the absorption column density is fixed at a larger value during the fit.
In addition to the blackbody emission, we also considered NS atmosphere models, with a pure hydrogen atmosphere (NSA; Zavlin et al. 1995) and an atmosphere with hydrogen or other heavy elements (nsmax; Ho et al. 2008). PSR J11196127 has strong magnetic field of G, therefore we adopted a field strength of the same order (i.e., G) in both the NSA and the nsmax models. Comparing with the two BB components in the three-component model, only the lower temperature thermal component can be replaced by the emission from the magnetized atmosphere. If we considered the change of at different epochs for spectral fits to the PL+NSA+BB and the PL+nsmax+BB model, the best fits to both models give a consistent value of (1.4–1.6) cm-2 in Aug but a relatively higher value of (1.8–2.0) cm-2 in mid-Dec.
We did not find any obvious decreasing trend of the temperature as presented by Archibald et al. (2016a) among the spectral fits to a composite model with double BB components shown in Table 3. We detected a trend with both hotspots shrank and their flux contribution decreased after the magnetar-like outburst. The evolution of the flux ratio between the hotter and the cooler components could indicate the gradual disappearance of the hotter spot. The decrease of the temperature can be detected if we replaced the cooler thermal component by the global atmospheric emission with a uniform temperature.
3.4. Phase-Resolved X-Ray Spectral Analysis
Based on the result of the phase-averaged spectral analysis shown in Table 3, we find that the two thermal components dominate the spectral behavior in the energy range keV. The background subtracted pulsed fractions can be determined by , where and are the maximum and minimum counts in folded bins, respectively. These values inferred from four XMM-Newton/PN data are %, %, % and % while the NuSTAR observations give %, %, % and % at similar epochs. The pulsed fraction obtained from the XMM-Newton/PN observations is higher and no pulsation can be detected keV after end of July, thus, we speculate that the additional PL component required in the joint spectral analysis with NuSTAR observations has no contribution to the pulsations of PSR J11196127. Accordingly, we only generated the pulsed spectra of different epochs from the XMM-Newton/PN observations.
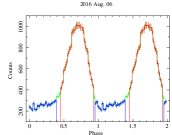
As shown in Fig. 7, we defined the phase intervals of 0.46–0.92, 0.88–1.38, 0.12–0.60 and 0.56–0.98 as the “on-pulse” components for data observed on Aug 6, Aug 15, Aug 30 and Dec 13 of 2016, respectively. The “off-pulse” (i.e., DC level) interval in the folded light curve was then determined at the phase within 0.96–1.38, 0.44–0.84, 0.64–1.06 and 0.06–0.48 for data observed on Aug 6, Aug 15, Aug 30 and Dec 13 of 2016, respectively. We generated pulsed spectra at different epochs by subtracting the “off-pulse” spectra from the “on-pulse” spectra. In order to ensure the statistic, we re-grouped the channels to have at least 50, 80, 50 and 25 photons per channel for each observation gained from 2016 early Aug to mid-Dec. We also generated the unpulsed spectra by subtracting the background contribution from the source spectrum gained within the “off-pulse” interval as defined in Fig. 7, and the background spectrum was determined by the nearby source free region. The unpulsed spectrum was also rebinned with a minimum of 25, 40, 25 and 15 counts per channel for each dataset observed from 2016 early Aug to mid-Dec.
| Observed Time | Aug 06 | Aug 15 | Aug 30 | Dec 13 | |
|---|---|---|---|---|---|
| a | 0.85 | ||||
| BB | (keV) | 1.01 | 0.96 | 0.93 | 0.79 |
| (km) | 1.01 | 0.90 | 0.78 | 0.40 | |
| b | 1.52 | 1.02 | 0.66 | 0.093 | |
| /d.o.f. | 1.25/569 | ||||
| a | 1.8 | ||||
| PL | 3.2 | 3.0 | 2.7 | 3.2 | |
| + | b | 1.58 | 1.19 | 0.93 | 0.27 |
| BB | (keV) | 1.00 | 0.97 | 0.96 | 1.2 |
| (km) | 0.99 | 0.81 | 0.58 | 0.13 | |
| b | 1.42 | 0.84 | 0.41 | 0.044 | |
| /d.o.f. | 1.10/561 | ||||
| a | 1.3 | ||||
| (keV) | 0.37 | 0.45 | 0.46 | 0.38 | |
| (km) | 3 | 2.1 | 1.9 | 1.4 | |
| + | b | 0.24 | 0.25 | 0.24 | 0.060 |
| (keV) | 1.01 | 1.03 | 1.08 | 1.2 | |
| (km) | 1.00 | 0.76 | 0.5 | 0.17 | |
| b | 1.53 | 0.94 | 0.55 | 0.071 | |
| /d.o.f. | 1.07/561 | ||||
a The linked absorption column density is in units of cm-2.
b The unabsorbed flux is measured in 0.5–8 keV and recorded in units of erg cm-2 s-1.
3.4.1 Pulsed Spectral Analysis
A single PL or a single BB model does not provide a good fit to most of the individual pulsed spectrum. Although the PL+BB model can provide acceptable fits to the pulsed spectra, the photon index is abnormally large (i.e., ) comparing to the general non-thermal X-ray emission from pulsars (Cheng & Zhang, 1999). In addition, the non-thermal component both dominates the source flux and the spectra in the soft X-ray band. We infer that the dominant non-thermal component also contributes to the pulsed emission since it was obtained from the pulsed spectra. The non-thermal pulsations corresponding to a different physical origin should have a quite distinct profile than the thermal pulsation originated from the surface emission. For example, the synchrotron radiation in the magnetosphere have a pulse profile similar to what we detected in the hard X-ray band with NuSTAR (Fig. 2), and it is different from the profile obtained from BB component. Nevertheless, we obtain similar structure without any phase change in the energy-resolved pulse profiles below 10 keV, and it disfavors the existence of different physical origins in the pulsed spectra.
We present the simultaneous fit to the pulsed spectrum with 2BB components and a linked hydrogen absorption in Table 4. The thermal flux derived for the two hotspots and the inferred emission size are somewhat lower/smaller than what we obtain in Table 3, but are still statistically consistent. Because the composite model contributed by two thermal components provides a better fit and a more physical origin, this is our preferred model. We cannot conclude a significant change in the temperature of each thermal component derived from different observations, but the shrinking of both emitting regions led to a decreasing pulsed emission with time.
| Observed Time | Aug. 06 | Aug. 15 | Aug. 30 | Dec. 13 | |
|---|---|---|---|---|---|
| a | 0.79 | ||||
| BB | (keV) | 1.09 | 1.11 | 1.11 | 1.1 |
| (km) | 0.61 | 0.51 | 0.41 | 0.12 | |
| b | 0.74 | 0.55 | 0.36 | 0.033 | |
| /d.o.f. | 1.09/488 | ||||
| a | 1.7 | ||||
| PL | 2.2 | 3.0 | 2.9 | 3 | |
| + | b | 0.66 | 0.46 | 0.28 | 0.035 |
| BB | (keV) | 1.05 | 1.13 | 1.12 | 1.2 |
| (km) | 0.53 | 0.46 | 0.38 | 0.09 | |
| b | 0.48 | 0.49 | 0.31 | 0.023 | |
| /d.o.f. | 1.01/480 | ||||
| a | 1.2 | ||||
| (keV) | 0.6 | 0.37 | 0.40 | 0.4 | |
| (km) | 1.2 | 1.8 | 1.2 | 0.5 | |
| + | b | 0.25 | 0.083 | 0.053 | 0.0082 |
| (keV) | 1.3 | 1.14 | 1.14 | 1.23 | |
| (km) | 0.4 | 0.48 | 0.39 | 0.10 | |
| b | 0.58 | 0.54 | 0.35 | 0.031 | |
| /d.o.f. | 1.00/480 | ||||
3.4.2 Unpulsed Spectral Analysis
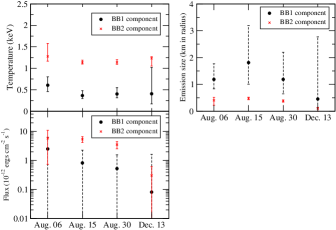
The unpulsed spectra of PSR J11196127 extracted from the “off-pulse” phase can be adequately fit by a single BB model and the results are listed in Table 5 in contrast to the phase-averaged spectra and the pulsed spectra. However, the fit prefers a small , lower than all previously reported values (e.g., cm-2; Blumer et al. 2017). Adding another BB component gives a larger absorption (see Table 5). If we fix at a higher value, we obtain lower temperatures for the BB components, e.g. cm-2 gives and eV for 2016 Aug 6 data. The thermal component at the off-pulse phase has a similar temperate, but a smaller effective radius (13–70% for the cooler component and 16–60% for hotter component) than that at the on-pulse phase. Hence, we speculate that only part of thermal emission can be observed at the off-pulse phase through a light bending effect due to the strong gravity, even though the hotspot is not in the line of sight.
BB+PL model can also provide acceptable fits to the spectra. However, NSA+PL does not provide a good fit to the spectrum. The best-fit PL+BB model has cm-2 and a large photon index (). Such a large absorption was also obtained in the pre-outburst spectral analysis of PSR J11196127. The unabsorbed flux contributed by the thermal and non-thermal components are comparable. We note that this PL component could not be contributed from PWNe because such a large photon index was rarely obtained by the non-thermal X-rays from PWNe (Kargaltsev & Pavlov, 2008). However, the soft non-thermal component could be originated from the magnetospheric upscattering of the thermal photons (Thompson et al., 2002).
4. Discussion
The positive detections of X-ray pulsations for PSR J11196127 after 2016 early Sep are few, and we cannot extend the effective time range of the ephemeris (see Table 2) through the TOA analysis. According to the spin-down rate derived by the linear regression over different time ranges, our results did not show any hints of its recovery. Instead of the spin-down recovery that can be observed after two previous glitches (Weltevrede et al., 2011; Antonopoulou et al., 2015) or after the glitch event of other high- pulsar (Livingstone et al., 2011), we suspect that some events occurred at the end of 2016 Aug could have slowed down the pulsar spin and continuously increased its spin-down rate. Three short magnetar-like X-ray bursts detected on 2016 Aug 30 may relate to not only the change of the radio pulse profile (Archibald et al., 2017) but also the increase of the timing noise and the spin-down rate.
Dai et al. (2018) observed the pulsar regularly with the Parkes radio telescope and presented a complete evolution of the timing solution. According to their results, both the radio flux and the spin-down rate of the pulsar continued to increase after the outburst at the end of July until the end of Aug. The complicated timing behavior well followed the expectation of our timing analysis although we do not have enough dense data sets to trace the recovery of the spin-down rate starting from the end of Aug. During the recovery process, a two-component radio pulse profile transformed into a four-component one accompanying a sudden flux drop in the radio band.
We need two thermal components to fit the X-ray spectra in our spectral analysis. An NS with a strong toroidal magnetic field can lead to the discontinuities in the tangential -field component, where the Ohmic dissipation is strongly enhanced (Viganò & Pons, 2012), affecting the thermal evolution through Joule heating. The heat conduction then becomes anisotropic, resulting in inhomogeneous surface temperature distributions (Viganò et al., 2013). The thermal pulse profile can eventually evolve into single-peaked with a large pulsed fraction (Perna et al., 2013); however, PSR J11196127 is a young pulsar with a characteristic age of only 1600 yr. The cooler surface emission can be hidden under the case of strong interstellar absorption ( cm-2), and the detected thermal component of the NS within the energy band of 0.5–2 keV only reveals on a single hotspot of about 1–2 km (cf. simulations in Shabaltas & Lai 2012). Nevertheless, the cooler hotspot obtained in our X-ray spectral fit has a temperature of keV and contributes to a significant fraction of photons below 2.5 keV, so a more complete model to re-investigate how the multiple thermal components lead to a single-peaked profile is required. The contribution of a cooler but larger thermal component can also be described by the global magnetized atmospheric emission with a uniform temperature. Because the cooler thermal emission also has a substantial contribution to the pulsations, we speculate that the emission scenario from two local hotspots could explain the observed pulsed structure. We also note that the hotter thermal emission in the composite model can be replaced by a Comptonization component (i.e., CompBB model; Nishimura et al. 1986), and the blackbody temperature of the Comptonized model is consistent to that determined for the surface emission.
We cannot differentiate the contribution of the non-thermal component dominated in the soft X-ray pulsation (i.e., keV) from the thermal pulsation although the BB+PL model can also provide an acceptable fit to the phase-averaged spectra below 10 keV. Comparing with the flux of PWN detected in the post-outburst stage (Blumer et al., 2017) and the time required to power it by the 2016 bursts, the unabsorbed flux contribution larger than erg cm-2 s-1 with a steep photon index of should result from the different origin, even if we cannot exclude a negligible contribution from the PWN. The similar combined components can also be resolved in the pulsed spectra extracted from the XMM-Newton observations as shown in Table 4. However, a non-thermal origin to emit a large amount of soft X-ray photons is not preferred to describe the pulsed emission because we did not find a pulsed structure change comparing with the thermal origin. An additional PL component with is indeed required to describe the spectral behavior in the hard X-ray band (i.e., keV) when we further include the spectra obtained by NuSTAR observations. Because the soft photon index () determined by the spectrum of PWN in the post-outburst stage (Blumer et al., 2017) is much softer, we argue that this component should be attributed to the magnetospheric emission of PSR J11196127. This component cannot result from the outer gap emission of the pulsar after the end of 2016 July because we detected more than 2000 source counts over 10 keV but the pulsations were not significant at all. Such a hard component was also detected in some persistently bright magnetars (e.g., 4U 0142+61) or from the spectral slope changes of some transient magnetars (e.g., 1E 1547.05408) during outbursts (Enoto et al., 2017).
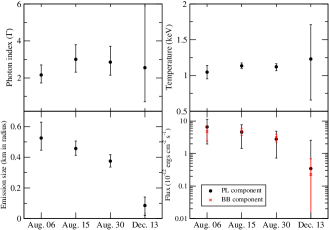
Both of the phase-averaged spectral and the pulsed spectral analyses did not show an obvious temperature variation for the two thermal components, but we can detect a trend of decreasing emission area, as shown in Fig 8. A similar feature was also observed in the outburst decay of some magnetars (Esposito et al., 2013; Rodríguez Castillo et al., 2016). The decrease in temperature can only be seen when the cooler BB component with the temperature of keV is replaced by the NS atmosphere model. When we perform simultaneous fit to the pulsed spectrum with a linked absorption ( cm-2) with the NSA+BB model, we found a uniform temperature over the entire surface of a 1.4 M⊙ NS with 13 km radius evolved with eV, eV, eV and eV obtained from the XMM-Newton data on Aug. 06, Aug. 15, Aug. 30 and Dec. 13, respectively.
In the unpulsed spectral analysis, both the composite models, PL+BB and 2BB, provide acceptable fits with the spectral parameters shown in Figs. 9 and 10. The resonant cyclotron scattering of the surface thermal emission (Thompson et al., 2002) and the gravitational bending of the emission from the warmer hotspot may provide the radiative scenario of the PL+BB model. The non-thermal emission, which dominates the soft X-ray photons (i.e., keV), is comparable to the surface emission in this model; nevertheless, the effect of resonant Compton scattering mainly produces the hard X-ray photons and is difficult to explain the off-pulse emission with such a soft PL component. It is also strange that both the pulsed and off-pulsed emission have the similar emission origin, but we note that the emission sizes of two hotspots determined by the unpulsed spectra (i.e., from 1.8 to 0.5 km for the larger hotspot radius and from 0.48 to 0.10 km for the smaller one) are smaller that those inferred from the fit to the pulsed spectrum (i.e., from 3.0 to 1.4 km for the larger hotspot radius and from 1.00 to 0.17 km for the smaller one). This result suggests that the emission from hotspots, which is not in the direction of our sight, can still be partially observed due to the gravitational light bending and contributes weaker thermal components in the spectra during the off-pulse phase.
Around the X-ray outburst of PSR J11196127, we found the source flux erg cm-2 s-1, which is clearly lower than erg cm-2 s-1 determined in the pre-outburst stage. Although the significance of the detection was clearly decreased, similar -ray spectral behavior can be inspected before and during the outburst stages. It indicates that the acceleration mechanism to emit -ray photons was suppressed without a significant change in the emission geometry. The theoretical model for the evolution of the -ray and the X-ray emission after the outburst will be fully discussed in our subsequent paper. Similar suppression after the outburst can also be detected in the radio band at the end of 2016 July or early Aug (Majid et al., 2017).
It is not clearly understood what caused the increase of the spin-down rate with a month time scale and the disappearance of the radio emission after the glitch, but it could be related to a reconfiguration of the open field line region (Akbal et al., 2015; Parfrey et al., 2012; Huang et al., 2016). Changes of the global magnetospheric configuration is also expected for some transient RPPs, for which two emitting states with different spin-down states have been observed. For example, PSR B1931+24 transferred between radio-bright and radio-quiet modes with a time scale from days to weeks (Kramer et al., 2006). PSR J2021+4026 showed a mode change in -rays during a glitch in 2011 and had stayed at a low -ray luminosity with high spin-down rate for about three years (Zhao et al., 2017). Moreover, PSR B0943+10 showed synchronous mode-switching between the radio and the X-ray emission (Hermsen et al., 2013; Mereghetti et al., 2016). We note that a similar synchronous change can be detected for PSR J11196127 after the 2016 outburst. The X-ray background subtracted pulsed fractions of PSR J11196127 obtained from NuSTAR on July 28-29 and on Aug. 30-31 are % and %, which could also indicate a relatively higher ratio of non-thermal contribution when the radio emission was switched on. Although the physical origin of our detections can be different from RPPs and the mode change of the latter could be a state change of the global magnetospheric current, triggers of the state changes in the electromagnetic emission and/or the spin-down rate are not yet well understood and could depend on the type of the transients.
It is difficult to evaluate the effect on the timing solution due to the short magnetar-like bursts occurred at the end of 2016 Aug in our study, so we cannot definitively conclude that the larger spin-down rate was caused by the reconfiguration of the global magnetosphere. Another interpretation is that a large amount of electron-positron pairs created in the trapped photon-pair plasma fireball cease the entire acceleration mechanism of an NS (Thompson & Duncan, 1995). Such a scenario was also applied to explain the sudden radio drop over a few tens of seconds coincident with the occurrence of multiple short X-ray bursts detected at the end of 2016 Aug (Archibald et al., 2017). The series of X-ray bursts occurred at the end of 2016 July can also provide the energy of the trapped fire ball to create the pairs to suppress the radio and high-energy emission. The major difference after the X-ray bursts at the end of July and Aug may be the cooling time scale of the pair plasma in the trapped fireball because no significant radio detection was obtained until 2016 Aug. 1 (Majid et al., 2017) and it seems that the recovery of the radio emission required a longer time.
5. Conclusion
We have performed a complete study to trace the high-energy timing and spectral evolution of PSR J11196127 after its 2016 outburst. Based on the confirmed periodic signals detected at different epochs, we derived the timing ephemeris of PSR J11196127 after the outburst. We also clearly found the decreasing trend of the spin frequency derivative after the glitch/outburst, which is different from the recovery of the spin-down rate generally observed following similar events, or even in the previous glitches of 2004 and 2007. The serious timing noise embedded in the timing solution can be detected at the end of 2016 Aug by comparing ephemerides determined within different time interval in Table 2, and it also prohibits blind searches of pulsations in -rays.
In the beginning of the 2016 outburst, the X-ray emission of keV in the phase-averaged spectroscopy can be mainly described with a single thermal component. After the outburst, we found that the spectrum requires two thermal components to describe X-rays from different origins; the global atmosphere/large emitting region (with a few kilometers in radius) and from the small hotspot (with the radius less than one kilometer). Comparing with the spectral behavior of the pulsar before the 2016 outburst, the pulsed fraction in keV significantly increased and an additional component is required to fit the spectrum. Instead of a decrease in the temperature after the outburst, we found that the emission sites shrank to % and 80% of their original size in four months. A shrinking of the thermal emitting region is also detected to be accompanied by a decrease of the flux. The decrease of the temperature is only significant when we replace the cooler thermal component of keV by the magnetized atmospheric emission, but we did not prefer such an interpretation because the pulsed emission in the soft X-ray band ( keV) was quite significant, inconsistent with a global emission scenario. We also need to include a hard PL component () to describe the hard X-ray ( keV) spectrum from NuSTAR. Such a component with an unclear origin cannot be detected in RPPs in general; even another high- pulsar, PSR J18460258 shows an obvious softening of the non-thermal emission in the outburst (Ng et al., 2008). Comparing with strong thermal emission from the pulsar, the emission from the PWN and magnetospheric pulsation is low and cannot be clearly resolved from the spectra after the outburst.
The -ray flux of PSR J11196127 obviously decreased when the outburst occurred in 2016, but the spectral parameters are similar to those determined in the pre-outburst state. The suppression of the radio emission was also detected at the outburst, and similar transitions of the radio flux for a pulsar were also in the mode changing RPPs. Based on our studies, we find that after the outburst, the emission from the magnetosphere had a higher flux ratio (%) between the non-thermal and total flux of 3–65 keV if the contribution from the PWN did not have a significant change between epochs. Such a high flux ratio contributed by the magnetospheric emission is also found to accompany with the active radio emission state. We also note that the pulsar had the largest spin-down rate between the end of 2016 Aug and early Sep when the radio emission of the pulsar was brightest (Dai et al., 2018). An additional support of this picture in our analysis is that the magnitude of the frequency derivative reported by Archibald et al. (2016a) is much smaller than the value we found before 2016 early Sep while the radio pulsar was still active.
References
- Acero et al. (2015) Acero, F., et al. 2015, ApJS, 218, 23
- Akbal et al. (2015) Akbal, O., Gügercinoğlu, E., Şaşmaz Muş, S., & Alpar, M. A. 2015, MNRAS, 449, 933
- Antonopoulou et al. (2016) Antonopoulou, D., Vasilopoulos, G., & Espinoza, C. M. 2016, The Astronomer’s Telegram, 9282
- Antonopoulou et al. (2015) Antonopoulou, D., Weltevrede, P., Espinoza, C. M., Watts, A. L., Johnston, S., Shannon, R. M., & Kerr, M. 2015, MNRAS, 447, 3924
- Archibald et al. (2008) Archibald, A. M., Kaspi, V. M., Livingstone, M. A., & McLaughlin, M. A. 2008, ApJ, 688, 550
- Archibald et al. (2016a) Archibald, R. F., Kaspi, V. M., Tendulkar, S. P., & Scholz, P. 2016a, ApJ, 829, L21
- Archibald et al. (2018) —. 2018, ApJ, submitted (arXiv:1806.01414)
- Archibald et al. (2016b) Archibald, R. F., Tendulkar, S. P., Scholz, P. A., & Kaspi, V. M. 2016b, The Astronomer’s Telegram, 9284
- Archibald et al. (2017) Archibald, R. F., et al. 2017, ApJ, 849, L20
- Blumer et al. (2017) Blumer, H., Safi-Harb, S., & McLaughlin, M. A. 2017, ApJ, 850, L18
- Burgay et al. (2009) Burgay, M., Israel, G. L., Possenti, A., Rea, N., Esposito, P., Mereghetti, S., Tiengo, A., & Gotz, D. 2009, The Astronomer’s Telegram, 1913
- Camilo et al. (2000) Camilo, F., Kaspi, V. M., Lyne, A. G., Manchester, R. N., Bell, J. F., D’Amico, N., McKay, N. P. F., & Crawford, F. 2000, ApJ, 541, 367
- Camilo et al. (2006) Camilo, F., Ransom, S. M., Halpern, J. P., Reynolds, J., Helfand, D. J., Zimmerman, N., & Sarkissian, J. 2006, Nature, 442, 892
- Caswell et al. (2004) Caswell, J. L., McClure-Griffiths, N. M., & Cheung, M. C. M. 2004, MNRAS, 352, 1405
- Cheng & Zhang (1999) Cheng, K. S., & Zhang, L. 1999, ApJ, 515, 337
- Dai et al. (2018) Dai, S., et al. 2018, MNRAS in press (arXiv:1806.05064)
- de Jager & Büsching (2010) de Jager, O. C., & Büsching, I. 2010, A&A, 517, L9
- Dib et al. (2008) Dib, R., Kaspi, V. M., & Gavriil, F. P. 2008, ApJ, 673, 1044
- Dorman & Arnaud (2001) Dorman, B., & Arnaud, K. A. 2001, in Astronomical Society of the Pacific Conference Series, Vol. 238, Astronomical Data Analysis Software and Systems X, ed. F. R. Harnden, Jr., F. A. Primini, & H. E. Payne, 415
- Enoto et al. (2017) Enoto, T., et al. 2017, ApJS, 231, 8
- Esposito et al. (2013) Esposito, P., et al. 2013, MNRAS, 429, 3123
- Gavriil et al. (2008) Gavriil, F. P., Gonzalez, M. E., Gotthelf, E. V., Kaspi, V. M., Livingstone, M. A., & Woods, P. M. 2008, Science, 319, 1802
- Gibson et al. (1982) Gibson, A. I., Harrison, A. B., Kirkman, I. W., Lotts, A. P., Macrae, J. H., Orford, K. J., Turver, K. E., & Walmsley, M. 1982, Nature, 296, 833
- Gonzalez & Safi-Harb (2003) Gonzalez, M., & Safi-Harb, S. 2003, ApJ, 591, L143
- Gonzalez et al. (2005) Gonzalez, M. E., Kaspi, V. M., Camilo, F., Gaensler, B. M., & Pivovaroff, M. J. 2005, ApJ, 630, 489
- Göğüş et al. (2016) Göğüş, E., et al. 2016, ApJ, 829, L25
- Harrison et al. (2013) Harrison, F. A., et al. 2013, ApJ, 770, 103
- Hermsen et al. (2013) Hermsen, W., et al. 2013, Science, 339, 436
- Ho et al. (2008) Ho, W. C. G., Potekhin, A. Y., & Chabrier, G. 2008, ApJS, 178, 102
- Hobbs et al. (2004) Hobbs, G., et al. 2004, MNRAS, 352, 1439
- Hu et al. (2017) Hu, C.-P., Ng, C.-Y., Takata, J., Shannon, R. M., & Johnston, S. 2017, ApJ, 838, 156
- Huang et al. (2016) Huang, L., Yu, C., & Tong, H. 2016, ApJ, 827, 80
- Kargaltsev & Pavlov (2008) Kargaltsev, O., & Pavlov, G. G. 2008, in American Institute of Physics Conference Series, Vol. 983, 40 Years of Pulsars: Millisecond Pulsars, Magnetars and More, ed. C. Bassa, Z. Wang, A. Cumming, & V. M. Kaspi (Melville, NY: AIP), 171
- Kaspi & Beloborodov (2017) Kaspi, V. M., & Beloborodov, A. M. 2017, ARA&A, 55, 261
- Kaspi & McLaughlin (2005) Kaspi, V. M., & McLaughlin, M. A. 2005, ApJ, 618, L41
- Kennea et al. (2016) Kennea, J. A., Lien, A. Y., Marshall, F. E., Palmer, D. M., Roegiers, T. G. R., & Sbarufatti, B. 2016, GRB Coordinates Network, Circular Service, No. 19735, #1 (2016), 19735
- Kramer et al. (2006) Kramer, M., Lyne, A. G., O’Brien, J. T., Jordan, C. A., & Lorimer, D. R. 2006, Science, 312, 549
- Leahy (1987) Leahy, D. A. 1987, A&A, 180, 275
- Livingstone et al. (2011) Livingstone, M. A., Ng, C.-Y., Kaspi, V. M., Gavriil, F. P., & Gotthelf, E. V. 2011, ApJ, 730, 66
- Livingstone et al. (2009) Livingstone, M. A., Ransom, S. M., Camilo, F., Kaspi, V. M., Lyne, A. G., Kramer, M., & Stairs, I. H. 2009, ApJ, 706, 1163
- Majid et al. (2016) Majid, W., Dobreva, T., Kocz, J., Lazio, J., Lippuner, J., Pearlman, A. B., & Prince, T. 2016, The Astronomer’s Telegram, 9321
- Majid et al. (2017) Majid, W. A., Pearlman, A. B., Dobreva, T., Horiuchi, S., Kocz, J., Lippuner, J., & Prince, T. A. 2017, ApJ, 834, L2
- Mardia (1972) Mardia, K. 1972, Statistics of Directional Data, Probability and Mathematical Statistics a Series of Monographs and Textbooks, (Academic: New York).
- Mattox et al. (1996) Mattox, J. R., et al. 1996, ApJ, 461, 396
- McLaughlin et al. (2003) McLaughlin, M. A., et al. 2003, ApJ, 591, L135
- Mereghetti et al. (2016) Mereghetti, S., et al. 2016, ApJ, 831, 21
- Mong & Ng (2018) Mong, Y.-L., & Ng, C.-Y. 2018, ApJ, 852, 86
- Morrison & McCammon (1983) Morrison, R., & McCammon, D. 1983, ApJ, 270, 119
- Ng & Kaspi (2011) Ng, C.-Y., & Kaspi, V. M. 2011, in AIP Conf. Proc. 1379, Astrophysics of Neutron Stars 2010: A Conference in Honor of M. Ali Alpar, ed. E. Göğüş, T. Belloni, & Ü. Ertan (Melville, NY: AIP), 60
- Ng et al. (2012) Ng, C.-Y., Kaspi, V. M., Ho, W. C. G., Weltevrede, P., Bogdanov, S., Shannon, R., & Gonzalez, M. E. 2012, ApJ, 761, 65
- Ng et al. (2008) Ng, C.-Y., Slane, P. O., Gaensler, B. M., & Hughes, J. P. 2008, ApJ, 686, 508
- Ng et al. (2011) Ng, C.-Y., et al. 2011, ApJ, 729, 131
- Nishimura et al. (1986) Nishimura, J., Mitsuda, K., & Itoh, M. 1986, PASJ, 38, 819
- Parent et al. (2011) Parent, D., et al. 2011, ApJ, 743, 170
- Parfrey et al. (2012) Parfrey, K., Beloborodov, A. M., & Hui, L. 2012, ApJ, 754, L12
- Perna & Pons (2011) Perna, R., & Pons, J. A. 2011, ApJ, 727, L51
- Perna et al. (2013) Perna, R., Viganò, D., Pons, J. A., & Rea, N. 2013, MNRAS, 434, 2362
- Pivovaroff et al. (2001) Pivovaroff, M. J., Kaspi, V. M., Camilo, F., Gaensler, B. M., & Crawford, F. 2001, ApJ, 554, 161
- Pons & Geppert (2007) Pons, J. A., & Geppert, U. 2007, A&A, 470, 303
- Pons & Rea (2012) Pons, J. A., & Rea, N. 2012, ApJ, 750, L6
- Ray et al. (2011) Ray, P. S., et al. 2011, ApJS, 194, 17
- Rea et al. (2013) Rea, N., et al. 2013, ApJ, 770, 65
- Rodríguez Castillo et al. (2016) Rodríguez Castillo, G. A., et al. 2016, MNRAS, 456, 4145
- Safi-Harb & Kumar (2008) Safi-Harb, S., & Kumar, H. S. 2008, ApJ, 684, 532
- Shabaltas & Lai (2012) Shabaltas, N., & Lai, D. 2012, ApJ, 748, 148
- Thompson (2008) Thompson, C. 2008, ApJ, 688, 499
- Thompson & Duncan (1995) Thompson, C., & Duncan, R. C. 1995, MNRAS, 275, 255
- Thompson & Duncan (1996) —. 1996, ApJ, 473, 322
- Thompson et al. (2002) Thompson, C., Lyutikov, M., & Kulkarni, S. R. 2002, ApJ, 574, 332
- Viganò & Pons (2012) Viganò, D., & Pons, J. A. 2012, MNRAS, 425, 2487
- Viganò et al. (2013) Viganò, D., Rea, N., Pons, J. A., Perna, R., Aguilera, D. N., & Miralles, J. A. 2013, MNRAS, 434, 123
- Weltevrede et al. (2011) Weltevrede, P., Johnston, S., & Espinoza, C. M. 2011, MNRAS, 411, 1917
- Woods & Thompson (2006) Woods, P. M., & Thompson, C. 2006, Soft gamma repeaters and anomalous X-ray pulsars: magnetar candidates, ed. W. H. G. Lewin & M. van der Klis, 547
- Younes et al. (2016) Younes, G., Kouveliotou, C., & Roberts, O. 2016, GRB Coordinates Network, Circular Service, No. 19736, #1 (2016), 19736
- Zavlin et al. (1995) Zavlin, V. E., Pavlov, G. G., Shibanov, Y. A., & Ventura, J. 1995, A&A, 297, 441
- Zhao et al. (2017) Zhao, J., et al. 2017, ApJ, 842, 53