Orbital decay of Globular Clusters in the galaxy with little dark matter
Abstract
Recently, van Dokkum et al. (2018) have presented an important discovery of an ultra-diffuse galaxy, NGC1052-DF2, with a dark matter content significantly less than predicted from its stellar mass alone. The analysis relies on measured radial velocities of 10 Globular Clusters (GCs), of estimated individual masses of a few . This is about of the inferred mass of NGC1052-DF2 of within a half-light radius, . The large relative mass and the old age of these objects imply that they might be susceptible to orbital decay by dynamical friction. Using analytic estimates and N-body simulations of an isolated system matching the inferred mass profile of NGC1052-DF2, we show that orbits of the most massive GCs should already have decayed on a time scale of a few Gyrs. These findings should help in constraining mass profile and formation scenarios of NGC1052-DF2.
1 Introduction
Small galaxies with shallow potential wells are an interesting probe of the nature of dark matter (DM). The sheer existence of DM in these objects has long ago allowed a constraint on the mass of neutrinos as candidates for DM (Tremaine & Gunn, 1979). Further, their observed abundance is sensitive to both the power spectrum of the initial mass fluctuations (Lovell et al., 2013) and energetic feedback associated with star formation and Supernovae feedback (Pontzen & Governato, 2012). The ratio of DM to stellar mass of these galaxies is (Behroozi et al., 2010; Moster et al., 2013). Therefore, the discovery of a galaxy, NGC1052-DF2, with very little or no DM content at all is particularly intriguing (van Dokkum et al., 2018). A DM deficiency in NGC1052-DF2 in conjunction with the low acceleration can in principle constrain modifications to Newtonian dynamics (e.g. van Dokkum et al., 2018; Famaey et al., 2018; Moffat & Toth, 2019). A lack of DM could serve as an indication of dark sector breaking of the equivalence principle and violation of Lorenz invariance (e.g. Frieman & Gradwohl, 1991; Kesden & Kamionkowski, 2006; Keselman et al., 2009; Bettoni et al., 2017). Indeed, an additional fifth force in the dark sector could completely segregate the stellar and DM components due to the gravitational force field of a more massive host, such as the large elliptical NDF1052 in the vicinity of NGC1052-DF2.
The analysis of NGC1052-DF2 is based on the measured radial velocities of ten compact objects which are similar to Galactic Globular Clusters (GCs) and are hence termed so by van Dokkum et al. (2018). The 90% confidence limit on the line of sight velocity dispersion of these objects is estimated as van Dokkum et al. (2018). Martin et al. (2018) have argued that the small number of tracers used to constrain the kinematics of the galaxy could be associated with poorly determined velocity dispersion and hence is the cause of the apparent lack of DM.
The GCs in NGC1052-DF2 are much more luminous than typical GCs with the brightest of them, GC-73, having an absolute luminosity and metallicity similar to Cen (van Dokkum et al., 2018b), the brightest GC in the Milky Way. We infer the mass of GC-73 to be , the close to that of Cen (D’Souza & Rix, 2013). The second brightest object, GC-77, is consequently only a factor of 1.6 less massive. Thus the mass one of the brightest GCs is about 1% of the high end mass estimate of NGC1052-DF2, as provided by van Dokkum et al. (2018). This makes these objects particularly susceptible to dynamical friction (Chandrasekhar, 1949). The time scale for orbital decay of a GC of mass in a galaxy with mass profile is (Binney & Tremaine, 2008),
| (1) |
The derivation of this relation employs several assumptions about the structure of the galaxy which do not necessarily hold in reality (c.f. Binney & Tremaine, 2008; Arca-Sedda & Capuzzo-Dolcetta, 2016, for details). Therefore, we use it to infer a rough estimate only. Consider an object at a distance from the center and with a velocity of . Then, . If the mass ratio is and , we find . Given that the estimated age of the GC is (van Dokkum et al., 2018b), orbit decay by DF should be taken into account.
In the remainder of the Letter, we provide a more robust assessment of the effects of dynamical friction using N-body simulations designed to model the NGC1052-DF2 system.
2 Simulations
We study the orbital decay using N-body simulations of an isolated collisionless system with density profile matching the general features of NGC1052-DF2, as reported in van Dokkum et al. (2018). We model the galaxy as a two component system of stars and DM, both assumed spherical with respective (Einasto & Haud, 1989) density profiles. The observed two-dimensional (2D) structure of the galaxy is represented by van Dokkum et al. (2018) in terms of a Sérsic profile with index and half-light radius . We have found that this is very well approximated as a projection of the three-dimensional (3D) Einasto density profile with parameters kpc, and . The total mass in stars is normalized to , as in the observations. The stellar component is assumed to be embedded in a DM halo with an Einasto profile with parameters derived from halos identified in large high-resolution cosmological simulations (e.g. Ludlow et al., 2013). We consider halos of virial masses and corresponding to virial radii kpc and kpc, respectively. For both masses we fix the Einasto parameters at and . van Dokkum et al. (2018) derive the constraints on the mass profile taking a distance of for NGC1052-DF2. There is, however, a debate regarding the distance. Trujillo et al. (2018) have presented arguments that the galaxy may be much nearer at a distance of . van Dokkum et al. (2018) countered these arguments, producing a revised distance of . Nonetheless, here we also model GC orbits for parameters appropriate for , where the spacial extent of the galaxy is reduced to and its stellar mass to . Further, we model the stellar component is an Einasto profile with the same and as above but with and mass normalized to . The parameters of the DM halo remain as before with a virial mass of , consistent with Trujillo et al. (2018).
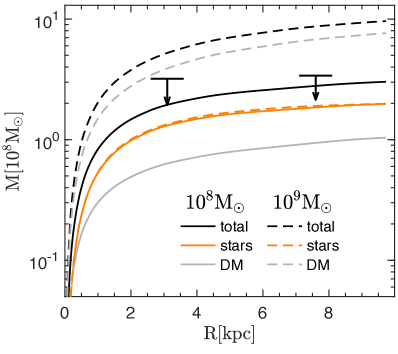
The simulations are run using the publicly available treecode written by J. Barnes (Barnes & Hut, 1986), with a force softening and an opening angle criteria . This value for is close to , the impact parameter above which encounters between the GC and galactic particles are important for dynamical friction (Binney & Tremaine, 2008). Approximating the speed of GC by we find for and . In any case, the uncertainty in fixing is of minor significance relative to the the unknown detailed structure of the galaxy and the actual three dimensional positions of the GCs in the observations. Each simulation contains particles of equal mass, representing the galaxy without the GCs. A particle at position from the center, is assigned a randomly oriented initial velocity with a magnitude equal to the circular velocity, , where is the total (stars + DM) within . The initial configurations are evolved using the treecode for Gyr to obtain the corresponding relaxed configurations. Fig. 1 shows the 2D mass profiles obtained from the simulation runs without GCs, for two halo masses, and as indicated in the figure. The evolved mass profiles are actually close to the respective profiles obtained from the initial conditions. The stellar component in both simulation runs should match the observed stellar profile. Indeed, stellar distributions represented by the orange (solid and dashed) curves for the low and high mass simulations, match very well the corresponding profile in Fig. 4a in van Dokkum et al. (2018). In computing the 2D DM profiles, we excise particles with (3D) distances larger than 10 kpc in the simulations. We obtain a good match with the DM mass profiles shown in the same figure of van Dokkum et al. (2018). The arrows represent the confidence limits on the mass estimates from the observations (van Dokkum et al., 2018). The low mass profile is close to the 90% mass limits from the observations. The circular velocity, , for the lower mass profile in the simulation, reaches a maximum of at and declines slowly at larger radii. The corresponding line of sight velocity dispersion is , consistent with the observations. We have also checked (but do not show) that the simulated profiles corresponding to a distance of NGC1052-DF2 agree well with Trujillo et al. (2018). Once a relaxed state is reached, a massive particles representing a GC is placed in each simulation galaxy. For van Dokkum et al. (2018) GCs of masses , , and million solar masses are placed at various distances from the center with orbital eccentricity of (e.g. Benson, 2005; Wetzel, 2011). The observed NGC1052-DF2 is expected to be truncated at by the tidal gravitational force field of NGC1052, a much larger nearby elliptical galaxy at a projected distance of . Therefore, we only consider GC particles within 111Given a projected distance the probability for a 3D distance is for where is the truncation radius of the galaxy. This assumes the number density of GCs falls like . .
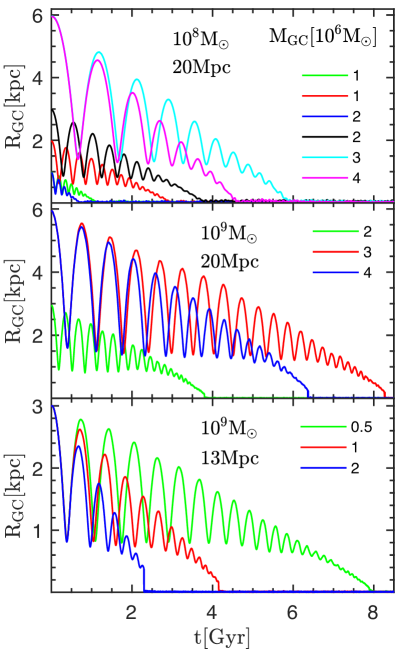
After the inclusion of GCs, the simulations are run forward for , with an energy conservation to better than . For each simulated galaxy, a “center” is identified as the particle with the lowest potential energy. Distances of GC particles are computed relative to the center in the corresponding simulation. Fig. 2 is a summary of the results for GCs distances versus time in the lower mass galaxy. The results are not reliable numerically for distances close to the softening parameter, , e.g. at a distance of force bias introduced by the Plummer smoothing is about 10%. For the low mass galaxy run (top panel), the orbit of the GC particle with (cyan line) decays within for an initial apocenter as large as . Starting from an apocenter of , the same curve shows that the orbit decays within . For an initial apocenter of , orbits decay on a much shorter time scale of less than even for the lightest particles. At a distance, the brightest observed GC is with a mass in between the two largest GC particles and lies at a projected separation . The second brightest observed cluster is at a projected separation of . The middle panel represents orbits in the simulations of a galaxy with a 10 times more massive halo, still at a distance. Orbital decay is clearly slower, however, it remains significant. Tracing the red curve, a GC with a starting at an apocenter of , sinks to the center at . According to the green curve, a particles with (close to the mass of the second brightest observed GC), starting with apocenters of and reaches the center after and , respectively. Note that the orbit of a particle starting from decays over the same time scale in the low and high mass galaxies. This is seen by comparing the black curve in the top panel with the green curve in the middle panel. Results for simulations corresponding to a galaxy at a distance are represented in the bottom panel. On account of the different assumed distances to NGC1052-DF2, the GC masses in the simulations corresponding to Trujillo et al. (2018) are smaller than for van Dokkum et al. (2018). This boosts the dynamical friction time scale but we must bear in mind that the lower distance implies smaller separations between the GCs and the center of NGC1052-DF2. At a distance, the mass of the brightest GC is . Since whole system is now less extended, we consider smaller separations than before. Starting from a a particle reaches the center within , faster than in the top and middle panel. The reason is the smaller stellar mass in the distance galaxy which results in an overall less mass than the case, within the relevant radius. Therefore, also with the lower distance to NGC1052-DF2, dynamical friction is expected tp play an important role.
3 Discussion and Conclusions
We have argued that dynamical friction is an important process in NGC1052-DF2 for the mass range reported in van Dokkum et al. (2018). Our findings imply that the presence of the observed massive GCs at distances is likely inconsistent with the reported mass estimate of NGC1052-DF2. We have seen that boost of the galaxy mass by a factor of 4 to is insufficient to suppress the effects of dynamical friction on the largest GCs in the relevant range of distances from the center. The scaling with implies that boosting the total mass of the galaxy by a factor of a 100, as would be expected for a typical galaxy the same stellar mass, practically eliminates the effects of dynamical friction. However, an order of magnitude increase over the reported mass limit in van Dokkum et al. (2018) is sufficient to increase to . Thus, although our findings indicate that the ratio of DM to stellar mass in NGC1052-DF2 should be on the order of a few tens, they do not strictly require the typical high value of a few hundreds expected from its stellar mass. A more detailed analysis of the mass constraints implied by the measured GC velocities might still yields that the dynamical mass might be large enough to avoid short dynamical friction timescales.
Another way out is if the system is relatively young. But this possibility is yet to be demonstrated in a physical scenario that will yield consistency with all observations of the system van Dokkum et al. (2018). We have also run simulations where the whole system is subject to the external field of a nearby larger galaxy like NGC1052 in the vicinity of NGC1052-DF2. The results regarding orbital decay of GCs are unaltered by the inclusion of a (static) external field, provided that they lie within the tidal radius of the simulated NGC1052-DF2. It should be pointed out that the relative radial velocity of NGC1052-DF2 relative to NGC1052 is (van Dokkum et al., 2018), while line-of-sight velocity dispersion of the NGC1052 group is only (van Dokkum et al., 2018) which is consistent with the circular velocity of measured from the HI content of NGC1052 Gorkom1986. Thus the relative speed of NGC1052-DF2 is close to the escape velocity from NGC1052. At a projected distance of kpc between the two galaxies, NGC1052-DF2 is likely to be just skimming past NGC1052. Nonetheless, even with tests where the external field generated from a galaxy with a 1D velocity dispersion of , the GCs either sank to the center or completely stripped (for large initial separations).
Ogiya & Go (2018) have shown that if i) NGC1052-DF2 is initially harbored in a halo with a large core and ii) is on a highly radial orbits in the field of NGC1052, then gravitational tidal stripping could produce mass profiles consistent with the observations. As argued Ogiya & Go (2018) , this set-up is unlikely and systems like NGC1052-DF2 are expected to e rare. As mentioned above, we argue the relative speed between NGC1052-DF2 and NGC1052 makes this set-up unrealistic. Thus, tidal stripping scenarios (e.g. Di Cintio et al., 2017; Carleton et al., 2018) are unlikely to apply in the case of NGC1052-DF2.
The situation is reminiscent of Fornax, the most massive satellite of the Milky Way. Fornax is the only satellite of the Galaxy containing GCs; there are five of them, and they are observed at projected distances from its center. The dynamical friction time scale is short and at least the two most massive of the GCs should have reached the center within a few . Fornax is DM dominated with a halo mass of , close to the mass of NGC1052-DF2 as given in van Dokkum et al. (2018). But there are distinct differences between the two systems. Fornax is much less spatially extended that the ultra diffuse NGC1052-DF2 if indeed at a distance of Mpc. Further, the massive GC that Fornax harbors is less that of its mass. Therefore, none of our simulations corresponding to can be directly associated with the relevant dynamical friction calculation done for Fornax. At , the NGC1052-DF2 system becomes much more akin to Fornax. The larger GC mass in NGC1052-DF2, could make dynamical friction more problematic than in Fornax, but the tidal radius of Fornax is better determined and we have less freedom in fixing the 3D separation. Several ways out have been suggested to solve the Fornax mystery, such as having a core of constant density within (Goerdt et al., 2006). This cored density profile is, however, very hard to achieve within the context of viable warm DM models (MacCiò et al., 2012). Further, even a mild cusp would would bring the orbits of some of the GCs to decay (Cole et al., 2012). Other solutions same that the Fornax has only recently captured its GCs and that they are located near its tidal radius (Cole et al., 2012; Oh et al., 2000; Angus & Diaferio, 2009). This set-up could be relevant for NGC1052-DF2 but it seems unlikely and its feasibility is hard to assess.
The orbit calculations done in this Letter should serve as a general indication for the orbital decay times. The unknown detailed structure of the NGC1052-DF2 and the availability of only partial phase space coordinates of the GC system, prevent an accurate determination of the orbits. Nonetheless, the variety of numerical experiments presented here, sustained by analytic estimation, demonstrate clearly that typical decay time scales could comfortably shorter than the age of the system. A clear conclusion from our work is that any mass model and formation scenario for NGC1052-DF2 should consider the constraints on GC orbital decay by dynamical friction. This statement is valid for the two distance measurements reported for this galaxy. A full assessment of the parameter space of plausible mass profiles and orbital characteristics similar to the analysis Cole et al. (2012) for Fornax, could be worthwhile. However, an extensive investigation is beyond the scope of this Letter.
Acknowledgements
The author thanks Avishai Dekel, Fangzhou Jiang, Martin Feix and Noam Soker for useful comments and Joshua Barnes for providing the FORTRAN treecode N-body code. This research was supported by the I-CORE Program of the Planning and Budgeting Committee, THE ISRAEL SCIENCE FOUNDATION (grants No. 1829/12 and No. 203/09) and the Asher Space Research Institute.
References
- Angus & Diaferio (2009) Angus, G. W., & Diaferio, A. 2009, MNRAS, 396, 887, doi: 10.1111/j.1365-2966.2009.14745.x
- Arca-Sedda & Capuzzo-Dolcetta (2016) Arca-Sedda, M., & Capuzzo-Dolcetta, R. 2016, MNRAS, 464, 3060, doi: 10.1093/mnras/stw2483
- Barnes & Hut (1986) Barnes, J., & Hut, P. 1986, Nature, 324, 446, doi: 10.1038/324446a0
- Behroozi et al. (2010) Behroozi, P. S., Conroy, C., & Wechsler, R. H. 2010, ApJ, 717, 379, doi: 10.1088/0004-637X/717/1/379
- Benson (2005) Benson, A. J. 2005, MNRAS, 358, 551, doi: 10.1111/j.1365-2966.2005.08788.x
- Bettoni et al. (2017) Bettoni, D., Nusser, A., Blas, D., & Sibiryakov, S. 2017, JCAP, 2017, doi: 10.1088/1475-7516/2017/05/024
- Binney & Tremaine (2008) Binney, J., & Tremaine, S. 2008, Galactic dynamics (Princeton University Press), 885. http://adsabs.harvard.edu/abs/2008gady.book.....B
- Carleton et al. (2018) Carleton, T., Errani, R., Cooper, M., Kaplinghat, M., & Peñarrubia, J. 2018, eprint arXiv:1805.06896. https://arxiv.org/abs/1805.06896
- Chandrasekhar (1949) Chandrasekhar, S. 1949, Rev. Mod. Phys., 21, 383, doi: 10.1103/RevModPhys.21.383
- Cole et al. (2012) Cole, D. R., Dehnen, W., Read, J. I., & Wilkinson, M. I. 2012, MNRAS, 426, 601, doi: 10.1111/j.1365-2966.2012.21885.x
- Di Cintio et al. (2017) Di Cintio, A., Brook, C. B., Dutton, A. A., et al. 2017, Mon. Not. R. Astron. Soc. Lett., 466, L1, doi: 10.1093/mnrasl/slw210
- D’Souza & Rix (2013) D’Souza, R., & Rix, H. W. 2013, MNRAS, 429, 1887, doi: 10.1093/mnras/sts426
- Einasto & Haud (1989) Einasto, J., & Haud, U. 1989, A&A, 223, 89
- Famaey et al. (2018) Famaey, B., McGaugh, S., & Milgrom, M. 2018, eprint arXiv:1804.04167. https://arxiv.org/abs/1804.04167
- Frieman & Gradwohl (1991) Frieman, J. A., & Gradwohl, B. A. 1991, PRL, 67, 1441, doi: 10.1126/science.260.5113.1441
- Goerdt et al. (2006) Goerdt, T., Moore, B., Read, J. I., Stadel, J., & Zemp, M. 2006, MNRAS, 368, 1073, doi: 10.1111/j.1365-2966.2006.10182.x
- Kesden & Kamionkowski (2006) Kesden, M., & Kamionkowski, M. 2006, PRD, 74, doi: 10.1103/PhysRevD.74.083007
- Keselman et al. (2009) Keselman, J. A., Nusser, A., & Peebles, P. J. E. 2009, PRD, 80, doi: 10.1103/PhysRevD.80.063517
- Lovell et al. (2013) Lovell, M. R., Frenk, C. S., Eke, V. R., et al. 2013, MNRAS, 439, 300, doi: 10.1093/mnras/stt2431
- Ludlow et al. (2013) Ludlow, A. D., Navarro, J. F., Boylan-Kolchin, M., et al. 2013, MNRAS, 432, 1103, doi: 10.1093/mnras/stt526
- MacCiò et al. (2012) MacCiò, A. V., Paduroiu, S., Anderhalden, D., Schneider, A., & Moore, B. 2012, MNRAS, 424, 1105, doi: 10.1111/j.1365-2966.2012.21284.x
- Martin et al. (2018) Martin, N. F., Collins, M. L. M., Longeard, N., & Tollerud, E. 2018, ApJL, 859, L5, doi: 10.3847/2041-8213/aac216
- Moffat & Toth (2019) Moffat, J. W., & Toth, V. T. 2019, MNRAS, 482, L1
- Moster et al. (2013) Moster, B. P., Naab, T., & White, S. D. M. 2013, MNRAS, 428, 3121, doi: 10.1093/mnras/sts261
- Ogiya & Go (2018) Ogiya, G., & Go. 2018, eprint arXiv:1804.06421. https://arxiv.org/abs/1804.06421
- Oh et al. (2000) Oh, K., Lin, D., & Richer, H. B. 2000, ApJ, 531, 727
- Pontzen & Governato (2012) Pontzen, A., & Governato, F. 2012, MNRAS, 421, 3464, doi: 10.1111/j.1365-2966.2012.20571.x
- Tremaine & Gunn (1979) Tremaine, S., & Gunn, J. E. 1979, PRL, 42, 407, doi: 10.1103/PhysRevLett.42.407
- Trujillo et al. (2018) Trujillo, I., Beasley, M. A., Borlaff, A., et al. 2018, eprint arXiv:1806.10141. https://arxiv.org/abs/1806.10141
- van Dokkum et al. (2018) van Dokkum, P., Danieli, S., Cohen, Y., et al. 2018, Nature, 555, 629, doi: 10.1038/nature25767
- van Dokkum et al. (2018) van Dokkum, P., Danieli, S., Cohen, Y., Romanowsky, A. J., & Conroy, C. 2018, ApJ, 864, L18
- van Dokkum et al. (2018b) van Dokkum, P., Cohen, Y., Danieli, S., et al. 2018b, ApJL, 856, L30, doi: 10.3847/2041-8213/aab60b
- Wetzel (2011) Wetzel, A. R. 2011, MNRAS, 412, 49, doi: 10.1111/j.1365-2966.2010.17877.x