Evolution of Starburst Galaxies in the Illustris Simulation
Abstract
There is a consensus in the literature that starburst galaxies are triggered by interaction events. However, it remains an open question as to what extent both merging and non-merging interactions have in triggering starbursts? In this study, we make use of the Illustris simulation to test how different triggering mechanisms can effect starburst events. We examine star formation rate, colour and environment of starburst galaxies to determine if this could be why we witness a bimodality in post-starburst populations within observational studies. Further, we briefly test the extent of quenching due to AGN feedback. From Illustris, we select 196 starburst galaxies at = 0.15 and split them into post-merger and pre-merger/harassment driven starburst samples. We find that 55% of this sample not undergone a merger in the past 2 Gyr. Both of our samples are located in low-density environments within the filament regions of the cosmic web, however we find that pre-merger/harassment driven starburst are in higher density environments than post-merger driven starbursts. We also find that pre-merger/harassment starbursts are redder than post-merger starbursts, this could be driven by environmental effects. Both however, produce nuclear starbursts of comparable strengths.
keywords:
galaxies: evolution – interactions – starburst – star formation1 Introduction
The star formation main sequence (SFMS) is a tight correlation (scatter 0.2 dex as reported by Speagle et al. 2014) between mass and star formation rate (SFR). It holds true at both low (Brinchmann et al. 2004; Salim et al. 2007) and high redshifts (Daddi et al. 2007) over multiple wavelengths (Elbaz et al. 2011; Rodighiero et al. 2014). Star-formation occurs in two modes: quiescently and star bursting (Pillepich et al. 2017), as revealed by the Kennicutt-Schmidt relation (Kennicutt 1998). Most galaxies situated in the SFMS can be considered star forming at a steady rate, whilst those significantly above the main sequence are considered to be in a starburst phase. Galaxies undergoing starburst spend a very short amount of time in this phase (108 years) and because of this, they are rare, making up between only 5% and 10% of the global galaxy population (Rodighiero et al. 2011).
Throughout the literature there is a consensus about the possible triggers of starburst/post-starburst galaxies, namely mergers (Barnes & Hernquist 1991; Sparre & Springel 2016) and galaxy-galaxy interactions (Zabludoff et al. 1996). It is suggested that these mechanisms are responsible for transforming star forming spirals into quiescent ellipticals. Evidence of this can be seen in the morphologies of post-starburst galaxies. Zabludoff et al. (1996) finds that in a sample of 21 post-starburst galaxies from the Las Campanas Redshift Survey that 5 galaxies display tidal features. This is a consequence of galaxy interactions. Other studies such as Tran et al. (2004) and Quintero et al. (2004) find that the morphology of post-starburst galaxies are generally bulge dominated with underlying disc components, similar to the S0 morphology, reinforcing the evolutionary link between spiral and elliptical galaxies.
It is widely believed that major mergers contribute heavily to the production of elliptical galaxies (Cox et al. 2006). Using 112 -body merger simulations of varying mass ratios, Naab & Burkert (2003) find that mergers with mass ratios of 1:1 - 1:4 mostly result in elliptical-like remnants. These remnants can be discy and resemble an S0 morphology, similar to the post-starburst morphologies found by Yang et al. (2004). Work by Sparre & Springel (2017), using the Illustris simulation (Genel et al. 2014; Vogelsberger et al. 2014a, b), find that merger remnants are able to regrow their disc and do not necessarily have to be quenched ellipticals.
However, spiral morphologies are found in 44–54% of post-starburst galaxies (Wilkinson et al. 2017), meaning major mergers are not the only process triggering the starburst phase. Cales et al. (2013) suggests that non-merging galaxy interactions are more likely to maintain a spiral morphology. This could suggest why there is a significant fraction of post-starburst spiral galaxies. However, this is not the only alternative to mergers to trigger starbursts, other studies such as Dekel et al. (2009), Ceverino et al. (2010), Cacciato et al. (2012) and Porter et al. (2014) suggest that instabilities in the disc could also result in starbursts.
Further, the environment in which starburst galaxies are found supports the merger/galaxy-galaxy interaction connection. Mergers, particularly gas-rich major mergers, are found to be more prominent in low-density environments (Bekki et al. 2001; Lin et al. 2010; Sánchez-Blázquez et al. 2009). These results back up the findings by Hashimoto et al. (1998), who find that star formation is on average higher in field environments than in cluster environments. This in turn reveals that there is a higher fraction of starbursts in the field compared with clusters. Zabludoff et al. (1996) finds that 75% of post-starburst galaxies are located in the field, a similar result is found in Wilkinson et al. (2017). By combining these findings, it suggests that for the majority of starburst galaxies major mergers are the main trigger (Wild et al. 2009a; Snyder et al. 2011) but not the only trigger (Sparre & Springel 2017) for driving galaxy transformation, with galaxy-galaxy interactions being the next major trigger.
Whilst starbursts are twice as common in the field than in cluster environments (Poggianti et al. 1999), they are present in some cluster environments (Balogh et al. 1999). Poggianti et al. (2009) find that post-starburst galaxies are predominantly in cluster environments at higher redshifts (0.4 < < 0.8). At lower redshifts (0.02 < < 0.06), Mahajan (2013) find that post-starburst galaxies prefer a weak-group environment containing 4 to 10 group members and that 86% of X-ray bright clusters contain sub-structure on the weak group scale. Of these weak groups, 91% contain post-starburst galaxies. This suggests pre-processing is occurring, in which the starburst is triggered in a weak group environment which then infalls into a denser cluster environment. This results in ram pressure stripping that quenches star formation.
In both cases, mergers and interactions have the potential of triggering a starburst (Zabludoff et al. 1996; Bekki et al. 2001, 2005; Hopkins et al. 2006, 2008) in which tidal torques funnel gas into the galactic centre (Barnes & Hernquist 1991; Barnes & Hernquist 1996). The increased build up of gas in the galactic centre then begins to fuel a rapid burst of star formation known as a nuclear starburst. Sparre & Springel (2016) suggests that head-on mergers are likely to produce a strong nuclear burst were the strength of the burst is directly proportional to the speed of the collision. Due to the regulatory processes within galaxies, this elevated rate of star formation is not sustained for a prolonged period of time and is quenched.
The literature suggests many potential mechanisms that could quench star formation after a starburst such as AGN feedback, stellar feedback, ram pressure stripping, and gas depletion. AGN feedback is a form of rapid quenching and has been discussed extensively within the literature (Springel et al. 2005; Goto 2006; Feruglio et al. 2010; Cicone et al. 2014) and is typically attributed to gas-rich major mergers (Di Matteo et al. 2005; Hopkins et al. 2006). When the merger occurs, gas is funnelled into the centre of the galaxy and activates the AGN, causing ‘quasar mode’ feedback which ejects remaining gas away from the star forming central region via strong galactic winds. After the quasar phase, ‘radio mode’ feedback takes over in which the AGN heats up surrounding gas preventing it from forming stars (Croton et al. 2006). Whilst AGN feedback is a powerful tool in suppressing star formation, gas falling back from the initial blow-out is capable of reigniting star formation (Faucher-Giguère 2018).
Star-formation triggered by either minor mergers or galaxy-galaxy interactions are found to quench on an intermediate time-scale, 1.0 /Gyr 2.0 (Smethurst et al. 2015). Mechanisms that could quench on an intermediate time-scale include ram pressure stripping, gas depletion or harassment. The morphology of such a remnant would resemble an S0 morphology, similar to the post-starburst galaxies found by Tran et al. (2004), Quintero et al. (2004) and Yang et al. (2004).
There has been many studies focusing on the link between starburst and mergers. However, there is little investigation in the literature that examines the links between non-merging events and starburst and how they compare to post-merger starbursts. In this study we use hydrodynamical simulations from Illustris (Vogelsberger et al. 2014a; Nelson et al. 2015) to track the evolution of starburst galaxies. We explicitly aim to determine their main trigger and make a comparison between post-merger and pre-merger/harassment driven starbursts.
In section 2 we give a brief description of the Illustris simulation and how we derive our sample. In section 3 we discuss our findings on the triggering mechanisms of starburst galaxies, their properties and what quenches their star formation. In section 4 we will discuss our main findings and in section 5 we will make our conclusions.
2 Sample Selection
2.1 Illustris
In order to address the questions above, we use the Illustris simulation to track and compare starbursts driven by differing triggers. Illustris is a hydrodynamical simulation that tracks cosmological evolution from = 127 to = 0 in a box of comoving size 106 Mpc3 (Genel et al. 2014; Vogelsberger et al. 2014a, b). The following cosmological parameters are adopted: = 0.2726, = 0.7274, = 0.0456, = 0.809, = 0.963 and = 100 km s-1 Mpc-1 where = 0.704. The initial conditions are generated at = 127 and achieves a dark matter resolution of 6.26 106 M⊙ and baryonic matter mass resolution of 1.26 106 M⊙. The smallest radii of a cell achieved is 48 pc (Vogelsberger et al. 2014a).
Illustris uses the moving-mesh code arepo (Springel 2010) that provides a hydrodynamical treatment of gas and works alongside gravitational forces (calculated using a Tree-PM scheme; Xu 1995) to create realistic galaxy formation. Phenomenological models are also included to allow for processes that regulate stellar mass growth within galaxies such as AGN feedback, stellar mass loss and SMBH growth. The simulation is capable of resolving gravitational dynamics down to ranges of 710 pc at = 0 whilst following large-scale evolution (Vogelsberger et al. 2014a).
Illustris uses the star formation and feedback model from Springel & Hernquist (2003). The model describes the multiphase nature of star formation, accounting for both self-regulating, ‘quiescent’ star formation and ‘explosive’ star formation. Springel & Hernquist (2003) use a sub-resolution model that uses spatially averaged properties to describe the ISM; this includes the growth of cold gas clouds, radiative cooling and supernova feedback in the form of galactic winds, radiative heating and outflows. During a starburst the gas density is much higher than the star formation threshold and this allows for efficient star formation. However, in the self-regulating model, galactic winds can reduce the efficiency of star formation producing results that are consistent with observations.
We make use of the publicly available merger trees (Nelson et al. 2015) created using the sublink code (Rodriguez-Gomez et al. 2015). These trees allow us to track our selected galaxies through subsequent and previous time steps and give details about their merger histories. This will allow us to compare the driving forces behind starburst galaxies.
2.2 Starburst Selection
We begin by selecting starburst galaxies at a lookback time of 1.912 Gyr ( = 0.15) with the aim of tracking them forward through time to = 0. By starting at this point in the simulation we are able to track the galaxies through 12 snapshots to = 0 which covers the 2 Gyr duration of the post-starburst phase (Kaviraj et al. 2007). Selecting galaxies in one snapshot simplifies the analysis as the time between snapshots is not uniform. Working in a low- regime allows for the minimum time difference between snapshots, allowing us to monitor the evolution of low- galaxies more closely and provides ease of comparison to SDSS studies like Wilkinson et al. (2017).
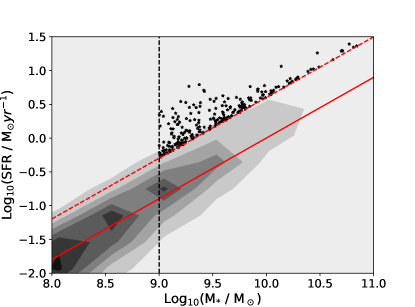
To select starburst galaxies we first plot the star formation main sequence, as shown in Fig. 1. We exclude passive galaxies at = 0.15 from our fit by fitting our trend line to main-sequence galaxies with specific star formation rates above 2.5 1010 yr-1. Further, we apply a minimum mass of 109 M⊙ for ease of comparison to observational studies. We identify galaxies 0.6 dex above the main sequence line as starburst galaxies, as defined by Zhang et al. (2016). Using this method, we select 196 starburst galaxies (0.82% of Illustris galaxies in this snapshot within the mass range given above).
We add the caveat that within the Illustris simulation, starbursts are under-produced (Sparre et al. 2015), this is due to the spatial resolution of the simulation (Sparre & Springel 2016). This problem reduces the star formation that is measured and therefore hides the bursty nature of starbursts. This could cause some starbursts to be hiding within the main sequence. The star formation main sequence becomes less defined at higher masses and as a result the average star formation rate drops as masses surpass 1010.5 M⊙ (Sparre et al. 2015). This results in fewer starburst galaxies being identified at higher masses.
3 Results
3.1 Triggering Mechanisms of Starbursts
| log10(M/M⊙) | |||||||
|---|---|---|---|---|---|---|---|
| Sub-Sample | Total | 9.0-9.5 | 9.5-10.0 | 10.0-10.5 | 10.5-11.0 | ||
| Major | 35 | 20 | 12 | 2 | 1 | ||
| Intermediate | 24 | 5 | 12 | 5 | 2 | ||
| Minor | 30 | 9 | 15 | 4 | 2 | ||
| Post-Merger | 89 | 31 | 38 | 11 | 5 | ||
|
107 | 58 | 31 | 15 | 3 | ||
Zabludoff et al. (1996) suggested that the main mechanisms responsible for triggering the starburst phase are galaxy-galaxy interactions and mergers. Studies such as Wild et al. (2009b) and Snyder et al. (2011) suggest gas rich major mergers are responsible for triggering starburst galaxies. Other studies have reported non-merging galaxy-galaxy interactions are more likely to maintain spiral structure post starburst (Cales et al. 2013; Wilkinson et al. 2017). There are an extensive number of studies researching the link between mergers and starbursts but to what extent do non-merging interactions play on triggering starbursts? In this section we explore the potential triggers of starbursts by making use of the sublink merger trees in Illustris.
We examine the merger histories of our starburst galaxies and split our primary sample into two sub-samples based on whether they have undergone a merger in the previous 2 Gyr. Those starbursts that have had a merger in the past 2 Gyr we call post-merger starbursts and those that have not we call pre-merger/harassment starbursts, we note that this sample may or may not have a harassing neighbour that could or could not lead to a merger. However, at the snapshot in which these galaxies are selected, there has been no coalescence in the previous 2 Gyr and it is in this way that our two samples differ. We explore the post-merger scenario further by examining the types of merger that have occurred by splitting our post-merger driven starburst sample by mass ratio; 1:1-1:4 (major mergers), 1:4-1:10 (intermediate mergers) and 1:10-1:100 (minor mergers) as shown in Table 1. Mass ratio is defined as the ratio of stellar mass of the merger, calculated at a time when the secondary progenitor reaches its maximum stellar mass (Rodriguez-Gomez et al. (2015, 2016)). We find that 35 (15%) have had a major merger, as defined by Bournaud et al. (2005). We use this definition as it has been shown to produce remnants with similar morphologies to the post-starburst galaxies found by Naab & Burkert (2003) and Tran et al. (2003).
We separate out intermediate mergers (those with ratios between 1:4 and 1:10) because Bournaud et al. (2005) finds that this type of merger can form remnants with S0 morphologies. We find that 24 galaxies (10%) in our sample have had this type of merger in the previous 2 Gyr. When examining minor mergers, those with mass ratios less than 1:10, we find that 30 starbursts (34%) have had minor mergers, i.e. those with ratios less than 1:10 in the past 2 Gyr. We also split these fractions by mass in Table 1, that shows minor mergers are more prevalent at higher mass regimes whilst major mergers are more likely to occur at lower mass regimes because the number density of galaxies drops as mass increases.
In total 89 (13%) starburst have had at least one merger in the past 2 Gyr which suggests mergers do have a significant impact on triggering starbursts. However, mergers are not the only trigger as suggested by Sparre et al. (2017); what is triggering the remaining 107 (62%) starbursts? Perhaps, another likely trigger is harassment interactions which can cause rotational instabilities that lead to tidal torques capable of tunnelling gas and dust into the galactic centre Barnes & Hernquist (1992).
To determine how starbursts in the pre-merger/harassment sample are being triggered, we examine the locations and track the movements of galaxies within a 100 kpc radius surrounding the pre-merger/harassment starburst sample. We find that 52 pre- merger/harassment starbursts (49% of the pre-merger/harassment starburst sample) have a neighbour with a stellar mass at least 10% that of the starburst galaxy. This could indicate that harassment events are triggering starbursts whether it be a pre-merger harassment or a pure harassment event with no consequent merger. By examining the merger trees for future mergers, we find that 33 starbursts (31%) in our pre-merger/harassment sample have a future merger with a minimum mass ratio of 1:10 in subsequent snapshots. However, without the full raw data from Illustris we are unable to get a quantitative measure of tidal gravity. In 8 (7%) of the pre-merger/harassment starburst galaxies, there are no surrounding galaxies or mass. In these galaxies, gas could be accreted from the intergalactic medium fuelling a starburst or instabilities in the galactic disc could be driving the rapid burst of star formation. Only a higher resolution simulation would allow us to determine what is causing burst of star formation. These results could suggest that interactions play a role in triggering starbursts.
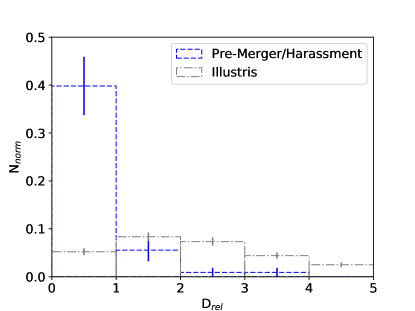
For starbursts in the pre-merger/harassment sample that have neighbouring galaxies within a 100 kpc radius and are greater than 10% of the starburst mass, we investigate the harassment scenario by determining the relative distance to the closest neighbour. Fig. 2 shows the distribution of relative distances normalised to the total sample size. We define relative distance, Drel, below in Eq. 1, where D is the distance from the centre of the starburst galaxy to the centre of its closest neighbour, R1 is the half mass radii of the starburst and R2 is the half mass radii of the closest neighbour. This method allows us to determine how close galaxies get regardless of their size.
| (1) |
In Fig. 2 we include a non-starburst control sample that is composed of 500 randomly selected galaxies from the Illustris simulation with masses above 109 M⊙. We find that 40% of the pre-merger/harassment starburst sample have a neighbour with Drel 1 which quickly drops to 10% for neighbours with relative distances greater than 1. Fig. 2 shows the control sample peaks at a higher Drel values and has a much lower fraction at Drel 5 than our pre-merger/harassment starburst sample. This shows that starbursts are closer to their neighbours than non-starbursts. This is strong evidence for an interaction driven starburst. Due to the close proximity it is not unreasonable to predict that a merger will eventually follow, providing that the relative velocities are low enough that will allow the galaxies to coalesce.
3.2 Environments
As we find in our previous study (Wilkinson et al. 2017), post-starburst galaxies predominantly reside in, but not restricted to, low-density environments. We find that those in high-density environments are redder and more elliptical in morphology than those in low-density environments. This suggests that environment could be enhancing the evolution in clusters and rich-groups. To discover more about the effects of environment on the post-starburst phase we look at the locations of our starburst galaxies in the Illustris simulation.
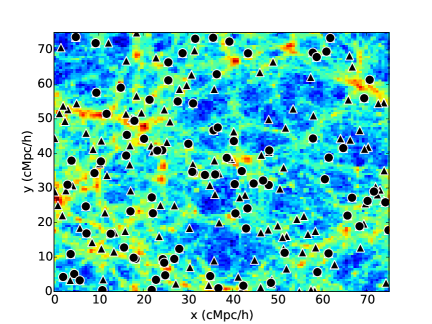
Firstly, we explore the global environments of starburst galaxies in the Illustris simulation. Fig. 3 shows the locations of starburst galaxies against the number density of galaxies in Illustris. We highlight the locations of starbursts that have had some sort of merger in the last 2 Gyr. We can see that the majority of the starbursts are located in the lower density environments around the filament regions.
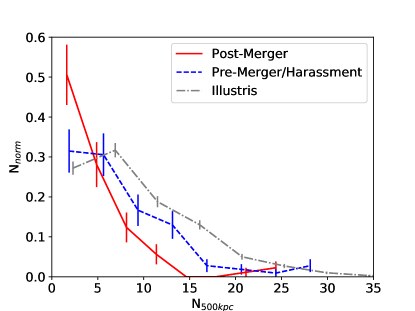
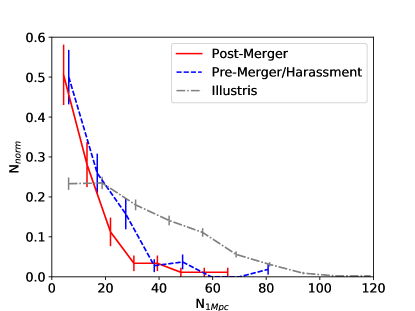
To quantify the environments of starburst galaxies in Illustris, we determine the number of galaxies with a minimum mass of 105M⊙ (this is the minimum stellar mass of a resolved subhalo) surrounding our starburst and control samples within 500 kpc and 1 Mpc as shown in Fig. 4. Using the same approach in section 3.1, we compose our control sample by selecting 500 random non-starburst galaxies. We find that the distribution in both samples peaks in the least dense environments, this confirms the findings of Wilkinson et al. (2017) and Zabludoff et al. (1996) that suggest post-starbursts and therefore starbursts have a preference for low-density environments. We note that the pre-merger/harassment starburst sample has a relatively extended tail on the distributions suggesting that starbursts in denser environments are more likely to be driven by harassment events rather than mergers. The distribution of non-starburst galaxies is shifted towards denser environments meaning that starburst galaxies are in less dense environments than pre-merger/harassment starburst environments. We quantify this by performing a KS test and obtain a p-value much less than 1% when comparing the pre-merger/harassment starburst sample to the post-merger sample at distances of 500 kpc and 1 Mpc.
When examining the halos our galaxies are in, we find the mean halo mass for the pre-merger/harassment starburst sample is 6.12.11012 M⊙ compared with 3.42.01012 M⊙ for the merger starburst sample. This result adds further evidence that starbursts without a previous merger are in denser environments to post-merger starbursts.
3.3 Nuclear or Global Starbursts?
In an extreme case, a starburst will use up all available cold gas throughout the galaxy, but as starbursts typically occur on a very short timescale, 50 Myr, these cases are very rare (Mihos & Hernquist 1994). It is more likely that gas is funnelled into the galactic centre, triggering a nuclear starburst (Barnes & Hernquist 1991, 1996). It is unknown to what extent gas is consumed in this scenario because molecular hydrogen has been found in some post-starburst galaxies (Zwaan et al. 2013; French et al. 2015).
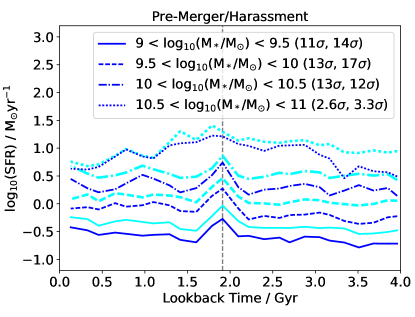
We start by examining the Star Formation Rates (SFR) of our samples (Fig. 5) from = 0.36 to = 0.00 (this is 2 Gyr either side of the snapshot used for selection). We split each sample by the mass bins as defined in Table 1. We include the total SFR (orange and aqua) and the SFR within the stellar half mass radius (red and blue). In the legends we include the significance of the peaks in terms of which is calculated by subtracting the median SFR before the peak from the height of the peak and dividing by the standard deviation of the pre-starburst SFRs. On average we find that SFR is higher in the pre-merger/harassment starburst sample than in the post-merger starburst sample. We don’t see a significant difference between the total and stellar half mass radius.
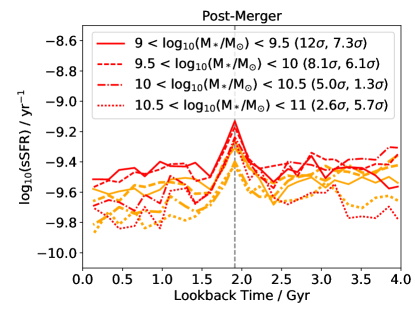
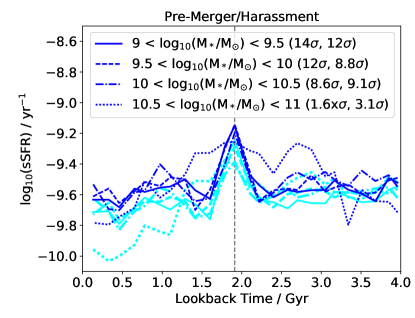
We also investigate the specific Star Formation Rates (sSFR) of our starburst galaxies. We plot sSFR against lookback time in Fig. 6, again split by mass bin and radii. In both samples we witness an offset between the total sSFR and sSFR within the stellar half mass radius, in which the sSFR in the stellar half mass radius is higher. When focusing on the enhancement at the time of the starburst, on average there is a higher enhancement in the stellar half mass radius. These results suggest that starbursts occur towards the galactic centre as noted by Barnes & Hernquist (1991) and Barnes & Hernquist (1996).
We can also see that the enhancement in sSFR is 0.1 dex higher in the pre-merger/harassment starburst sample compared to the post-merger sample. However, this could be a consequence of the resolution of Illustris; this means that burstier star formation would be averaged out into the background star formation as the measure of time used to calculate star formation is greater at the time duration of the starburst. Therefore, this could be the result of post-merger starbursts being burstier than the pre-merger/harassment starburst which would explain a lower peak in star formation.
When mergers and interactions occur, tidal torques funnel gas into the galactic centre (Barnes & Hernquist 1991, Barnes & Hernquist 1996). This build up of gas then acts as a fuel for a rapid burst of star formation. In this section we explore the extent of this increase in gas and test whether there is an infall to the galactic centre.
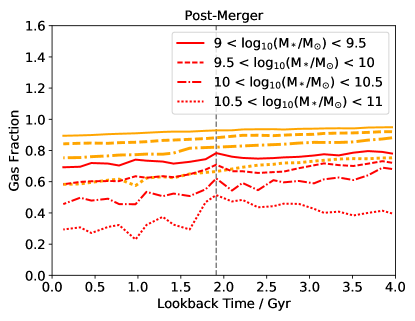
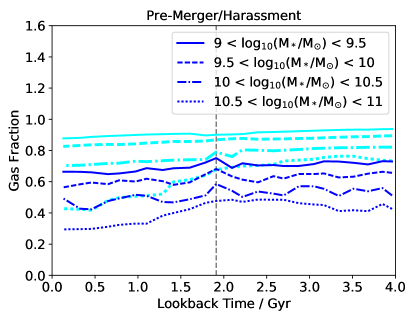
We plot the median stacked gas fractions within the stellar half mass radius and total gas fractions against lookback time in Fig. 7. We calculate gas fraction to be / ( + ), where is the mass of the gas and is the stellar mass. We see that there is a very mild downwards trend towards =0 throughout each gas fraction calculated which is attributed to steady rates of star formation. Whilst we see no significant change in gas fraction within either sample at both the half mass and total radii, for both samples we see a slight fluctuation within the stellar half mass radius at the time of starburst. Due to the insignificance of this fluctuation, it could suggest that star formation in Illustris is very efficient. In the model described by Springel & Hernquist (2003), quiescent star formation rates increase with gas density, however if gas density surpasses a threshold value the gas consumption time scale becomes very rapid producing a burst of star formation. This increase in star formation efficiency in the galactic centre means that gas is quickly converted to stars. The insignificance of the peak in gas fraction could also be because the cold to hot gas ratio has increased during the starburst therefore increasing the star formation efficiency. We add the caveat that whilst it is possible to calculate the temperature of gas in Illustris, the resolution is not high enough to allow the probing of molecular gas clouds and therefore we are unable to locate the cold gas reservoirs in our galaxies.
By using a simulation that has shorter time intervals between snapshots, we may be able to witness a more significant rise and fall of the gas fraction within the stellar half mass radius. Because this fluctuation only appears in the half mass radii, this could indicate that the starburst event affects mainly the nuclear regions with a greater effect further afield only in extreme cases. A nuclear starburst would mean there is negligible change to gas fraction outside of the central region, which is what we see in Fig. 7.
3.4 Colour
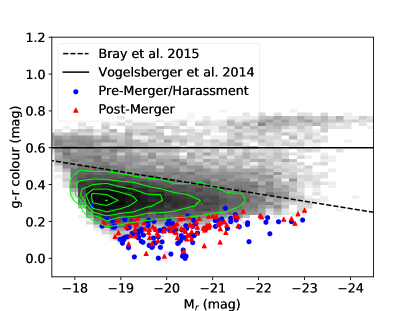
Poggianti et al. (1999), Poggianti et al. (2009) and Wilkinson et al. (2017) find there is bimodality in colour when studying the properties of post-starburst galaxies. We explore this further by using the mock stellar photometry measurements Illustris provides. Fig. 8 shows a colour-magnitude diagram at the time of the starburst. We include the separation lines from Vogelsberger et al. (2014b) and Bray et al. (2016) that denote the locations of the blue cloud and the red sequence. We add the caveat that the red sequence is not well defined in Illustris using photometry measurements, as there is no clear bimodality in colour. However, by plotting a colour-magnitude diagram, it allows us to determine whether one sample is bluer or redder than the other.
From Fig. 8, we see that all starbursts are located well within the blue cloud region of the colour-magnitude diagram; situated under both the Vogelsberger and Bray lines (Vogelsberger et al. 2014b and Bray et al. 2016 respectively). The Illustris simulation does not include dust and therefore this is why there is no large range in the colour of starbursts. Instead, starbursts are ‘ultra-blue’ in colour.
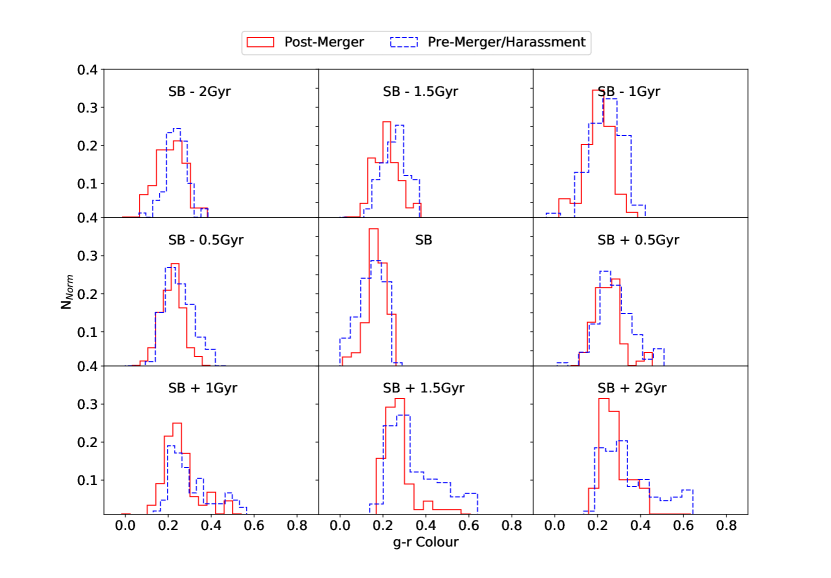
We explore how colour changes over time in Fig. 9 by plotting the colour distribution at 0.5 Gyr intervals before, during and after the starburst event. We find that within the 4 Gyr range the vast majority of starbursts are below g-r = 0.6 and can be considered blue (Vogelsberger et al. 2014b). At the snapshot containing the starburst we can see that the colours of both samples become bluer and then shift to approximately their original positions after the starburst. However, we find that the pre-merger/harassment sample has an extended tail towards redder colours which becomes more pronounced as the galaxies progress through the post-starburst phase. We have seen previously in section 3.2. pre-merger/harassment starbursts have an extended tail into denser environments which suggests environment has an impact on the colour of starburst galaxies.
3.5 Quenching and Feedback
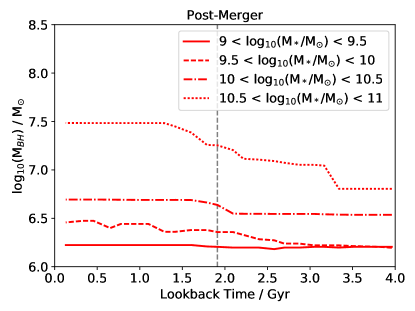
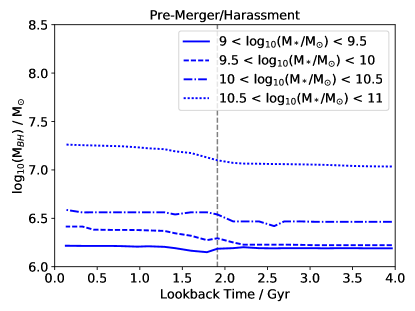
Active galactic nuclei (AGN) have been linked with post-starburst galaxies in many studies such as Trouille et al. (2011), Melnick et al. (2015) and Baron et al. (2017) to name a few. It is heavily reported in the literature that mergers, particularly gas-rich major mergers, could be the main trigger behind AGN activity (Di Matteo et al. 2005; Hopkins et al. 2006). This is the same trigger that is believed to ignite the starburst phase and hence post-starburst phase (Zabludoff et al. 1996; Bekki et al. 2005; Hopkins et al. 2006). In this section we briefly test to what extent AGN feedback plays in quenching star formation by examining black hole masses of the galaxies in this study.
In Fig. 10, we plot black hole mass against lookback time. Here, black hole mass is described at the sum of the masses of all blackholes in a subhalo. In both samples we see there is a gradual increase in black hole mass. For higher mass galaxies in the post-merger sample, there is on average a greater growth in blackhole mass which could indicate there is a larger level of AGN feedback, although there is no significant difference towards lower masses.
4 Discussion
Whilst previously thought that mergers are required to trigger a starburst, we find in this study, that harassment events can also trigger a starburst that is comparable in strength. We see that 55% of the starbursts in this study have not had a previous merger in the past 2 Gyr. These starbursts appear to have been triggered by harassment events (that may or may not lead to a future merger), galactic instabilities (Sparre et al. 2015) or the accretion of gas from the surrounding intergalactic medium. Without the raw Illustris data we are unable to measure the tidal gravity between surrounding galaxies to test directly whether harassments are the main trigger for the pre-merger/harassment starbursts; this would be a suitable subject for future study. However, to get an indication of whether harassments could be a significant trigger, we test how close galaxies get to one another by studying their relative distances, as defined in Eq. 1. We find that 40% are within distances equivalent to the sum of their half mass radii, this means galaxies become very close, possibly to the extent in which their discs directly interact. At these distances it is likely that this could trigger a starburst.
In the literature, post-starburst galaxies have been shown to reside in low-density environments (Zabludoff et al. 1996; Bekki et al. 2001; Sánchez-Blázquez et al. 2009). We have seen that the starburst galaxies in this study are found to reside along the filament regions in low-density environments. When comparing the post-merger starbursts to the pre-merger/harassment starbursts we find that the pre-merger/harassment sample has a preference for denser environments. As denser environments have higher velocity dispersions, galaxies in close proximity are more likely to harass and fly-by than merge directly. We also compare the colours of both samples before, during and after the starburst and find the colour distribution of pre-merger/harassment starburst sample to be slightly redder than post-merger driven starbuples. We believe this is linked to environment and therefore starbursts that occur in denser environments are likely to be redder than low-density environments.
To examine the strength of the starbursts, we test SFR and sSFR and find that starbursts occur on timescale of 0.5 Gyr. With a higher resolution simulation and shorter time intervals between snapshot we would be able to make a more accurate measurement of starburst duration. Further, we see there are higher sSFR within the stellar half mass radius compared to the total sSFR. This suggests that starbursts occur more in the central regions as suggested by Barnes & Hernquist (1991) and Barnes & Hernquist (1996) rather than affecting the whole galaxy. This is also visible when we test gas fractions: while there is no significant enhancement in as fraction due to efficient star formation within the entire halo, we do witness a slight change within the stellar half mass radius which supports the nuclear starburst hypothesis.
We also find that the enhancement in sSFR at the time of the starburst is on average higher in the pre-merger/harassment starburst sample, which would suggest that starburst are stronger when not driven by a merger. However, due to the resolution of the Illustris simulation, it is more likely that starbursts in the merger driven sample are burstier than pre-merger/harassment starbursts and hence appear to be lower when averaged over time (Sparre & Springel 2016).
We briefly investigate the extent AGN feedback could play in quenching star formation by measuring black hole masses over lookback time. We find there is on average more growth in black hole mass in the post-merger sample than there is in the pre-merger/harassment sample. This could indicate that there is more AGN feedback post-merger.
5 Conclusions
Starburst galaxies and the events that trigger them play an important role in transforming star forming spirals into quiescent ellipticals. The literature has many discrepant findings concerning the role of environment and triggering mechanisms. In this paper we have utilised the Illustris simulation to explore the possible triggering-mechanisms and making a comparison between post-merger and pre-merger/harassment triggered scenarios. We list here our principal findings:
-
1.
We find that 55% of the starbursts identified in this study have not been triggered by a merger. The majority of this sample we believe to have been harassment driven due to their very close relative distances between surrounding galaxies, 1.
-
2.
We find that in both of our samples, starburst galaxies are located within low-density regions in the filament regions of the cosmic web. The pre-merger/harassment driven starbursts have been found to have an extended tail in denser environments compared to post-merger starbursts.
-
3.
sSFR is on average larger within the stellar half mass radius which suggests a nuclear starburst rather than a galaxy wide starburst.
-
4.
Pre-merger/harassment starbursts have a slight extended tail towards redder colours in their colour distribution compared to post-merger starbursts. This is driven by environment and therefore denser environments produce redder post-starburst galaxies.
-
5.
These results suggest that mergers not only trigger bursty star formation but they could also trigger higher rates of feedback.
These findings suggest that whilst there are two significant processes that can trigger a starburst of comparable strength, environment has an impact on which process a galaxies takes to enter the starburst phase. This also has an effect on the colour of the galaxy which in turn could contribute to the bimodality of colour of post-starburst galaxies we see in observational studies such as Poggianti et al. (1999). Further work using the latest IllustrisTNG (Nelson et al. 2017; Naiman et al. 2017; Springel et al. 2017; Pillepich et al. 2017; Marinacci et al. 2017) will allow us to probe starburst galaxies in further detail with a higher temporal and spacial resolution.
Acknowledgements
We thank the anonymous referee for their useful report that has helped improve the quality of this work. We would like to thank Sugata Kaviraj for his advice and useful discussions during this study. KAP and BKG acknowledge support of STFC through the University of Hull Consolidated Grant ST/R000840/1. This research has made use of the Illustris database. The Illustris project acknowledges support from many sources: support by the DFG Research Centre SFB-881 “The Milky Way System” through project A1, and by the European Research Council under ERC-StG EXAGAL-308037, support from the HST grants program, number HST-AR-12856.01-A, support for program #12856 by NASA through a grant from the Space Telescope Science Institute, which is operated by the Association of Universities for Research in Astronomy, Inc., under NASA contract NAS 5-26555, support from NASA grant NNX12AC67G and NSF grant AST-1312095, support from the Alexander von Humboldt Foundation, NSF grant AST-0907969, support from XSEDE grant AST-130032, which is supported by National Science Foundation grant number OCI-1053575. The Illustris simulation was run on the CURIE supercomputer at CEA/France as part of PRACE project RA0844, and the SuperMUC computer at the Leibniz Computing Centre, Germany, as part of project pr85je. Further simulations were run on the Harvard Odyssey and CfA/ITC clusters, the Ranger and Stampede supercomputers at the Texas Advanced Computing Center through XSEDE, and the Kraken supercomputer at Oak Ridge National Laboratory through XSEDE.
References
- Balogh et al. (1999) Balogh M. L., Morris S. L., Yee H. K. C., Carlberg R. G., Ellingson E., 1999, ApJ, 527, 54
- Barnes & Hernquist (1991) Barnes J. E., Hernquist L. E., 1991, ApJ, 370, L65
- Barnes & Hernquist (1992) Barnes J. E., Hernquist L., 1992, ARA&A, 30, 705
- Barnes & Hernquist (1996) Barnes J. E., Hernquist L., 1996, ApJ, 471, 115
- Baron et al. (2017) Baron D., Netzer H., Poznanski D., Prochaska J. X., Förster Schreiber N. M., 2017, MNRAS, 470, 1687
- Bekki et al. (2001) Bekki K., Shioya Y., Couch W. J., 2001, ApJ, 547, L17
- Bekki et al. (2005) Bekki K., Couch W. J., Shioya Y., Vazdekis A., 2005, MNRAS, 359, 949
- Bournaud et al. (2005) Bournaud F., Jog C. J., Combes F., 2005, A&A, 437, 69
- Bray et al. (2016) Bray A. D., et al., 2016, MNRAS, 455, 185
- Brinchmann et al. (2004) Brinchmann J., Charlot S., White S. D. M., Tremonti C., Kauffmann G., Heckman T., Brinkmann J., 2004, MNRAS, 351, 1151
- Cacciato et al. (2012) Cacciato M., Dekel A., Genel S., 2012, MNRAS, 421, 818
- Cales et al. (2013) Cales S. L., et al., 2013, ApJ, 762, 90
- Ceverino et al. (2010) Ceverino D., Dekel A., Bournaud F., 2010, MNRAS, 404, 2151
- Cicone et al. (2014) Cicone C., et al., 2014, A&A, 562, A21
- Cox et al. (2006) Cox T. J., Dutta S. N., Di Matteo T., Hernquist L., Hopkins P. F., Robertson B., Springel V., 2006, ApJ, 650, 791
- Croton et al. (2006) Croton D. J., et al., 2006, MNRAS, 365, 11
- Daddi et al. (2007) Daddi E., et al., 2007, ApJ, 670, 156
- Dekel et al. (2009) Dekel A., Sari R., Ceverino D., 2009, ApJ, 703, 785
- Di Matteo et al. (2005) Di Matteo T., Springel V., Hernquist L., 2005, Nature, 433, 604
- Elbaz et al. (2011) Elbaz D., et al., 2011, A&A, 533, A119
- Faucher-Giguère (2018) Faucher-Giguère C.-A., 2018, MNRAS, 473, 3717
- Feruglio et al. (2010) Feruglio C., Maiolino R., Piconcelli E., Menci N., Aussel H., Lamastra A., Fiore F., 2010, A&A, 518, L155
- French et al. (2015) French K. D., Yang Y., Zabludoff A., Narayanan D., Shirley Y., Walter F., Smith J.-D., Tremonti C. A., 2015, ApJ, 801, 1
- Genel et al. (2014) Genel S., et al., 2014, MNRAS, 445, 175
- Goto (2006) Goto T., 2006, MNRAS, 369, 1765
- Hashimoto et al. (1998) Hashimoto Y., Oemler Jr. A., Lin H., Tucker D. L., 1998, ApJ, 499, 589
- Hopkins et al. (2006) Hopkins P. F., Hernquist L., Cox T. J., Di Matteo T., Robertson B., Springel V., 2006, ApJS, 163, 1
- Hopkins et al. (2008) Hopkins P. F., Hernquist L., Cox T. J., Kereš D., 2008, ApJS, 175, 356
- Kaviraj et al. (2007) Kaviraj S., Kirkby L. A., Silk J., Sarzi M., 2007, MNRAS, 382, 960
- Kennicutt (1998) Kennicutt Jr. R. C., 1998, ARA&A, 36, 189
- Lin et al. (2010) Lin L., et al., 2010, ApJ, 718, 1158
- Mahajan (2013) Mahajan S., 2013, MNRAS, 431, L117
- Marinacci et al. (2017) Marinacci F., et al., 2017, preprint (arXiv:1707.03396)
- Melnick et al. (2015) Melnick J., Telles E., De Propris R., Chu Z.-H., 2015, A&A, 582, A37
- Mihos & Hernquist (1994) Mihos J. C., Hernquist L., 1994, ApJ, 431, L9
- Naab & Burkert (2003) Naab T., Burkert A., 2003, ApJ, 597, 893
- Naiman et al. (2017) Naiman J. P., et al., 2017, preprint (arXiv:1707.03401)
- Nelson et al. (2015) Nelson D., et al., 2015, Astronomy and Computing, 13, 12
- Nelson et al. (2017) Nelson D., et al., 2017, preprint (arXiv:1712.00016)
- Pillepich et al. (2017) Pillepich A., et al., 2017, Monthly Notices of the Royal Astronomical Society, 475, 648
- Poggianti et al. (1999) Poggianti B. M., Smail I., Dressler A., Couch W. J., Barger A. J., Butcher H., Ellis R. S., Oemler Jr. A., 1999, ApJ, 518, 576
- Poggianti et al. (2009) Poggianti B. M., et al., 2009, ApJ, 693, 112
- Porter et al. (2014) Porter L. A., Somerville R. S., Primack J. R., Johansson P. H., 2014, Monthly Notices of the Royal Astronomical Society, 444, 942
- Quintero et al. (2004) Quintero A. D., et al., 2004, ApJ, 602, 190
- Rodighiero et al. (2011) Rodighiero G., et al., 2011, ApJ, 739, L40
- Rodighiero et al. (2014) Rodighiero G., et al., 2014, MNRAS, 443, 19
- Rodriguez-Gomez et al. (2015) Rodriguez-Gomez V., et al., 2015, MNRAS, 449, 49
- Rodriguez-Gomez et al. (2016) Rodriguez-Gomez V., et al., 2016, Monthly Notices of the Royal Astronomical Society, 458, 2371
- Salim et al. (2007) Salim S., et al., 2007, ApJS, 173, 267
- Sánchez-Blázquez et al. (2009) Sánchez-Blázquez P., Gibson B. K., Kawata D., Cardiel N., Balcells M., 2009, MNRAS, 400, 1264
- Smethurst et al. (2015) Smethurst R. J., et al., 2015, MNRAS, 450, 435
- Snyder et al. (2011) Snyder G. F., Cox T. J., Hayward C. C., Hernquist L., Jonsson P., 2011, ApJ, 741, 77
- Sparre & Springel (2016) Sparre M., Springel V., 2016, MNRAS, 462, 2418
- Sparre & Springel (2017) Sparre M., Springel V., 2017, MNRAS, 470, 3946
- Sparre et al. (2015) Sparre M., et al., 2015, MNRAS, 447, 3548
- Sparre et al. (2017) Sparre M., Hayward C. C., Feldmann R., Faucher-Giguère C.-A., Muratov A. L., Kereš D., Hopkins P. F., 2017, MNRAS, 466, 88
- Speagle et al. (2014) Speagle J. S., Steinhardt C. L., Capak P. L., Silverman J. D., 2014, ApJS, 214, 15
- Springel (2010) Springel V., 2010, ARA&A, 48, 391
- Springel & Hernquist (2003) Springel V., Hernquist L., 2003, MNRAS, 339, 289
- Springel et al. (2005) Springel V., Di Matteo T., Hernquist L., 2005, MNRAS, 361, 776
- Springel et al. (2017) Springel V., et al., 2017, Monthly Notices of the Royal Astronomical Society, 475, 676
- Tran et al. (2003) Tran K.-V. H., Franx M., Illingworth G., Kelson D. D., van Dokkum P., 2003, ApJ, 599, 865
- Tran et al. (2004) Tran K.-V. H., Franx M., Illingworth G. D., van Dokkum P., Kelson D. D., Magee D., 2004, ApJ, 609, 683
- Trouille et al. (2011) Trouille L., Tremonti C., Hickox R., 2011, in American Astronomical Society Meeting Abstracts #218. p. 123.03, http://adsabs.harvard.edu/abs/2011AAS...21812303T
- Vogelsberger et al. (2014a) Vogelsberger M., et al., 2014a, MNRAS, 444, 1518
- Vogelsberger et al. (2014b) Vogelsberger M., et al., 2014b, Nature, 509, 177
- Wild et al. (2009a) Wild V., Walcher C. J., Johansson P. H., Tresse L., Charlot S., Pollo A., Le Fèvre O., de Ravel L., 2009a, MNRAS, 395, 144
- Wild et al. (2009b) Wild V., Walcher C. J., Johansson P. H., Tresse L., Charlot S., Pollo A., Le Fèvre O., de Ravel L., 2009b, MNRAS, 395, 144
- Wilkinson et al. (2017) Wilkinson C. L., Pimbblet K. A., Stott J. P., 2017, MNRAS, 472, 1447
- Xu (1995) Xu G., 1995, ApJS, 98, 355
- Yang et al. (2004) Yang Y., Zabludoff A. I., Zaritsky D., Lauer T. R., Mihos J. C., 2004, ApJ, 607, 258
- Zabludoff et al. (1996) Zabludoff A. I., Zaritsky D., Lin H., Tucker D., Hashimoto Y., Shectman S. A., Oemler A., Kirshner R. P., 1996, ApJ, 466, 104
- Zhang et al. (2016) Zhang Z., Shi Y., Rieke G. H., Xia X., Wang Y., Sun B., Wan L., 2016, ApJ, 819, L27
- Zwaan et al. (2013) Zwaan M. A., Kuntschner H., Pracy M. B., Couch W. J., 2013, MNRAS, 432, 492