Pressure-tuned superconductivity and normal-state behavior in Ba(Fe0.943Co0.057)2As2 near the antiferromagnetic boundary
Abstract
Superconductivity in iron pnictides is unconventional and pairing may be mediated by magnetic fluctuations in the Fe-sublattice. Pressure is a clean method to explore superconductivity in iron based superconductors by tuning the ground state continuously without introducing disorder. Here we present a systematic high pressure transport study in Ba(Fe1-xCox)2As2 single crystals with 0.057, which is near the antiferromagnetic instability. Resistivity was studied under applied pressure up to 7.90 GPa. The parameter approaches a minimum value of at a critical pressure 3.65 GPa. Near , the superconducting transition temperature reaches a maximum value of 25.8 K. In addition, the superconducting diamagnetism at 2 K shows a sudden change around the same critical pressure. These results may be associated with a possible quantum critical point hidden inside the superconducting dome, near optimum .
pacs:
74.25.Dw 74.25.Uv 74.40.Kb 74.72.Kf.1 Introduction
Unconventional superconductivity observed in iron-based superconductors is in close proximity to an antiferromagnetically ordered state.Stewart (2011) Superconductivity emerges as antiferromagnetism is suppressed by pressure or chemical doping,Ni et al. (2008); Colombier et al. (2009); Canfield and Bud’ko (2010) and the superconducting critical temperature forms a dome shape. In the Ni-, Co-, P-, Rh- and Pd-doped BaFe2As2 system, the antiferromagnetic phase boundary crosses the superconducting dome near optimal doping.Ni et al. (2008, 2010); Luo et al. (2012); Hashimoto et al. (2012); Canfield et al. (2009); Ni et al. (2009, 2008); Chu et al. (2009) Hence, there is a region in the phase diagram where antiferromagnetism and superconductivity coexist. Neutron scattering measurements on Ba(Fe1-xNix)2As2 observed short range incommensurate antiferromagnetic order coexisting with superconductivity near optimal doping, where the first-order-like antiferromagnetism-to-superconductivity transition suggests the absence of a quantum critical point (QCP).Luo et al. (2012) Notably, it has been reported that the magnetic penetration depth in BaFe2(As1-xPx)2 shows a sharp peak at optimal doping, possibly due to quantum fluctuations associated with a QCP.Hashimoto et al. (2012)
In particular for Ba(Fe1-xCox)2As2, the physical properties have been widely studied close to optimal doping and the antiferromagnetic phase boundary. Neutron diffraction measurements indicate Co doping rapidly suppresses antiferromagnetism, with the antiferromagnetic order vanishing at 0.055.Lester et al. (2009) For 0.06, it is suggested that superconductivity coexists with a spin density wave (SDW).Huang et al. (2017a) For thin films of Ba(Fe1-xCox)2As2, the exponent in the temperature dependence of the resistivity is minimum namely, close to unity at 0.05 and 0.07 for MgO and CaF2 substrate, respectively, which may be associated with an antiferromagnetic QCP. Iida et al. (2016) Furthermore, a sign change in the electronic-magnetic Gruneisen parameter is observed for and , consistent with the expected behavior at a QCP.Meingast et al. (2012) In addition, a critical concentration of is determined from the analysis of in NMR measurements. Ning et al. (2014) Considerably enhanced flux-flow resistivity was also detected for 0.06, perhaps due to enhancement of spin fluctuations near QCP.Huang et al. (2017b) Thermopower() measurements reported a maximum in proximity to the commensurate-to-incommensurate SDW transition for 0.05, close to the highest superconducting .Arsenijević et al. (2013) However, the superconducting magnetization appears nearly unchanged across the dome in Ba(Fe1-xCox)2As2.Ni et al. (2008)
Despite extensive studies in Ba(Fe1-xCox)2As2 close to optimal doping, there had been no systematic study on how the normal state evolves across the antiferromagnetic phase boundary. Here we probe the phase diagram close to the antiferromagnetic boundary through measurements of resistivity and magnetization by tuning the applied pressure in a sample with 0.057. Normal state resistivity changes from non-Fermi liquid to Fermi liquid with increasing pressure. It shows almost linear temperature dependence at a critical pressure of 3.65 GPa, where is maximum. In addition, the residual resistivity and the resistivity at all change around the same critical pressure. From the magnetization data, the superconducting diamagnetism at 2 K shows a sudden change at a critical pressure of 3.5 GPa, in accordance with changes in resistivity. These results may be due to a possible QCP at optimum , similar to the case of BaFe2(As1-xPx)2 Hashimoto et al. (2012) and hole doped cuprates.Sachdev (2010)
.2 Experimental Details
Single crystals of Ba(Fe1-xCox)2As2 with were synthesized by a flux method.Ni et al. (2008) Electrical resistivity was measured using a Quantum Design Physical Property Measurement System (PPMS). The electronic transport properties were measured using four-probe electrical conductivity in a diamond anvil cell made of CuBe alloy. The diamond culet was 800 m in diameter. Magnetic measurements were performed in a superconducting quantum interference device (SQUID magnetometer). Pressure was applied using a diamond anvil cell made of CuBe alloy with the diamond anvil culet of 500 m. In both cases, Daphne oil 7373 was used as a pressure-transmitting medium. Above its solidification at 2.2 GPa,Sefat (2011) non-hydrostaticity may develop and lead to inhomogeneous pressure distribution inside the sample chamber. Pressure was calibrated by using the ruby fluorescence shift at room temperature. For resistivity, the superconducting transition temperature is defined as the temperature for the appearance of zero resistance state (Fig. 1(b)); for magnetization, is the temperature we observe a sharp drop in (inset to Fig. 3(a)).
.3 Results and Discussion
Figure 1 shows the temperature dependence of resistivity for Ba(Fe1-xCox)2As2 with 0.057 measured at different applied pressures namely, 0, 1.25, 2.69, 3.65, 5.26, 6.87 and 7.90 GPa. The resistivity curve for 7.90 GPa was shifted downward by 0.05 m cm for clarity. Note that the large decrease of with pressure (inset to Fig. 1(b)) is very similar to the changes occurring with Co doping in Ba(Fe1-xCox)2As2.Ahilan et al. (2009) By comparing the data we find that an increase in doping level by 1 is roughly equivalent to 1.2 GPa of pressure, which is comparable with previous report.Meingast et al. (2012)
At low pressures, resistivity decreases with decreasing temperature but shows an upturn just before entering the superconducting state. This upturn is due to the structural () and SDW () phase transition, in agreement with earlier studies in underdoped Ba(Fe1-xCox)2As2.Ni et al. (2008) Both / can be estimated from the first derivative of the temperature dependent resistivity curve (see inset to Fig. 1(a)).Ni et al. (2010) With further increase in pressure, the upturn vanishes suggesting suppression of the and . Similar changes with pressure has been reported for Ba(Fe1-xCox)2As2.Ahilan et al. (2008, 2009); Colombier et al. (2010) The zero resistance transition temperature (solid squares in Fig. 2(a)) varies non-monotonically with increasing pressure. For 6.87 GPa and above, we observe a finite resistivity down to the lowest measured temperature. A similar dome shaped variation in is observed in Ba(Fe1-xCox)2As2 with Co doping.Colombier et al. (2010); Ahilan et al. (2008)
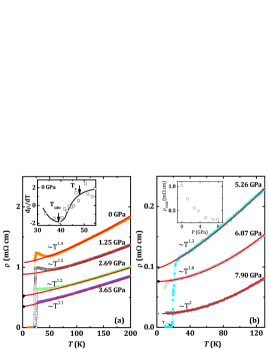
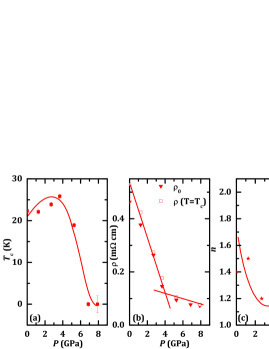
We fit the resistivity curve under pressure using (with fitting parameters , and ) as shown in Fig. 1, where the symbols represent data points and the solid lines are fits. The pressure dependence of , , at and obtained from Fig. 1 are summarized in Fig. 2(a)-(c), respectively. Resistivity can be tuned with pressure from a non-Fermi liquid (NFL)( 1) to Fermi liquid (FL) ( 2) behavior. Note that at 3.65 GPa and increases with further increase in pressure, reaching 2 at 7.90 GPa.
Interestingly, all parameters in Fig. 2 show a change at 3.5 GPa. This is similar to the heavy fermion superconductor CeCoIn5, where and change at 1.6 GPa.Sidorov et al. (2002) We ascribe the decrease in with increasing pressure to a change in inelastic scattering.Sidorov et al. (2002) The pressure dependence of at shows a change in slope at , similar to the behavior of the normal state resistivity at around optimal doping in chemically tuned BaFe2As2.Huang et al. (2017a) Similar change in was also observed in BaFe2As2 with Co doping, where the exponent is minimum namely, close to 1 at optimal doping.Iida et al. (2016) In BaFe2(As1-xP, non-Fermi liquid behavior with close to unity is found around optimal doping 0.3, with maximum at the QCP.Hashimoto et al. (2012) Similarly, linear resistivity was observed for Ba(Fe1-xNix)2As2 with 0.05 for which is maximum at a magnetic QCP.Zhou et al. (2013)
The zero field cooled (ZFC) magnetization was measured in a run with increasing pressure for 0.6, 1.2, 2.0, 2.7, 3.5, 4.3, 5.6, 6.4 GPa. The resultant data are plotted in Fig. 3(a). Since the sample used in the pressure cell is too small to measure its mass, we show magnetization data in emu. Another piece of sample is used to obtain the ambient pressure magnetization data (as shown in the inset to Fig. 3(a)) to determine at . The pressure dependence of determined from magnetization measurements is plotted in Fig. 3(b), consistent with the obtained from resistivity measurements (Fig. 2(a)).
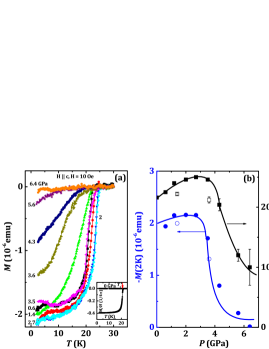
We summarize the pressure dependence of the ZFC magnetization at 2 K, (2K) in Fig. 3(b). Note that the magnetization data at low temperatures was often used to estimate the superconducting volume fraction.Saha et al. (2009, 2012); Kudo et al. (2013) In our case, it may not be accurate to estimate the volume fraction of superconductivity from magnetization since the superconducting transitions are broad and incomplete at high pressures and upon releasing the pressure. Nevertheless, it will give some hint to further understand the behavior of the superconducting state evolving across the antiferromagnetic phase boundary. Initially, slightly increases with pressure followed by a sudden suppression at 3.5 GPa, then becoming negligible at high pressures. A similar pressure induced suppression in the superconducting volume was observed in the parent compound of BaFe2As2 and SrFe2As2, where a dome like behavior of the pressure dependent superconducting volume is reported.Alireza et al. (2009) Also, for Sr(Fe1-xNix)2As2 and Ca1-xLaFe2(As1-yPy)2, the superconducting volume shows a dome behavior with doping.Saha et al. (2009); Kudo et al. (2013) In addition, a sudden suppression in the superconducting volume was observed in high- cuprate La2-xSrxCuO4 at a critical doping level of around 0.21,Takagi et al. (1992) which is close to a QCP.Cooper et al. (2009) Thus, the suppression of the superconducting volume fraction above the critical pressure observed in present work could reflect a phase transition at .
Note that in chemically doped (Co, Rh, Ni) BaFe2As2 at ambient pressure, there is no change in magnetization across the dome.Ni et al. (2008, 2009, 2010) Nevertheless, this difference may be due to different role played by pressure and chemical tuning. In fact, there is a pressure tuned QCP in pure CeCoIn5,Sidorov et al. (2002) while, there is no signatures of quantum critical behavior in Cd-doped CeCoIn5, due to the effect of disorder near a zero temperature magnetic instability.Seo et al. (2013) This suggests that tuning a system with disorder to a presumed magnetic QCP does not necessitate a quantum critical response. Seo et al. (2013)
We also measured two magnetization curves under decompression, namely, for 3.6 and 1.4 GPa (see Fig. 3(a)). Interestingly, the superconducting volume fraction is about the same as compression data, however, the values are not fully recovered. The different between compression and decompression is previously reported in In2Se3, which is intrinsic, as a result of changes in phonon and variation of carrier concentration combined in the pressure quench.Ke et al. (2017) Further measurements are needed to confirm if there is indeed a suppressed behavior in Ba(Fe1-xCox)2As2 during decompression, which is beyond the scope of this work.
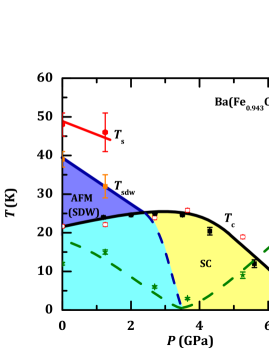
Figure 4 shows the temperature vs. pressure () phase diagram of Ba(Fe1-xCox)2As2 with 0.057. The structural phase transition temperature (), the SDW antiferromagnetic phase transition temperature , the superconducting transition temperature and the exponent in are summarized. With increasing pressure, we observe a suppression of the antiferromagnetic phase whereas, the superconducting transition temperature increases, suggesting competition between the two. reaches a maximum at a critical pressure around 3.5 GPa and decreases with further increase in pressure, forming a dome shape. Around , we observe signature of a non-Fermi liquid namely, close to 1, often associated with quantum criticality.Cooper et al. (2009); Gegenwart et al. (2008) This is accompanied by the above mentioned change in the superconducting diamagnetism. Together, these experimental findings suggest the presence of a QCP at , where is maximum.
Earlier NMR measurements in Ba(Fe1-xCox)2As2 revealed that the maximum occurs at the antiferromagnetic QCP possibly due to magnetically mediated superconductivity.Nakai et al. (2013) Such a superconducting pairing mechanism may be applicable in several strongly correlated superconducting systems, where fundamental physical quantities, including the superconducting condensation energy, quasiparticle lifetime, and superfluid density show abrupt changes at a QCP.Panagopoulos et al. (2002) Hence, the observation of a linear temperature dependence of resistivity at about 3.5 GPa and a possible change in the superconducting volume fraction, may be associated with a quantum phase transition.
.4 Conclusions
In summary, electrical resistivity and magnetization under pressure were measured in Ba(Fe1-xCox)2As2 with 0.057. Resistivity shows linear temperature dependence around a critical pressure of 3.5 GPa where is maximum. Furthermore, we detected signs of an accompanied change in the superconducting volume. These results are most likely due to a possible pressure tuned QCP hidden inside the superconducting dome of Ba(Fe1-xCox)2As2.
.5 Acknowledgments
Work at HPSTAR was supported by NSAF, Grant No. U1530402. Work at SIMIT was supported by the support of NSFC, Grant No. 11574338. Work at the Ames Laboratory was supported by the U.S. Department of Energy, Basic Energy Sciences under Contract No. DE-AC02-07CH11358. The work in Singapore was supported by the National Research Foundation C NRF Investigatorship (Reference No. NRF-NRFI2015-04). The work at KSU was supported by the National Science Foundation under grant No. DMR-1505826.
∗ hong.xiao@hpstar.ac.cn † thu@mail.sim.ac.cn
W.L. and Y.F.W. contributed equally to this work.
References
- Stewart (2011) G. R. Stewart, Rev. Mod. Phys. 83, 1589 (2011).
- Ni et al. (2008) N. Ni, M. E. Tillman, J.-Q. Yan, A. Kracher, S. T. Hannahs, S. L. Bud’ko, and P. C. Canfield, Phys. Rev. B 78, 214515 (2008).
- Colombier et al. (2009) E. Colombier, S. L. Bud’ko, N. Ni, and P. C. Canfield, Phys. Rev. B 79, 224518 (2009).
- Canfield and Bud’ko (2010) P. C. Canfield and S. L. Bud’ko, Annual Review of Condensed Matter Physics 1, 27 (2010), https://doi.org/10.1146/annurev-conmatphys-070909-104041 .
- Ni et al. (2010) N. Ni, A. Thaler, J. Q. Yan, A. Kracher, E. Colombier, S. L. Bud’ko, P. C. Canfield, and S. T. Hannahs, Phys. Rev. B 82, 024519 (2010).
- Luo et al. (2012) H. Luo, R. Zhang, M. Laver, Z. Yamani, M. Wang, X. Lu, M. Wang, Y. Chen, S. Li, S. Chang, J. W. Lynn, and P. Dai, Phys. Rev. Lett. 108, 247002 (2012).
- Hashimoto et al. (2012) K. Hashimoto, K. Cho, T. Shibauchi, S. Kasahara, Y. Mizukami, R. Katsumata, Y. Tsuruhara, T. Terashima, H. Ikeda, M. A. Tanatar, H. Kitano, N. Salovich, R. W. Giannetta, P. Walmsley, A. Carrington, R. Prozorov, and Y. Matsuda, Science 336, 1554 (2012).
- Canfield et al. (2009) P. C. Canfield, S. L. Bud’ko, N. Ni, J. Q. Yan, and A. Kracher, Phys. Rev. B 80, 060501 (2009).
- Ni et al. (2009) N. Ni, A. Thaler, A. Kracher, J. Q. Yan, S. L. Bud’ko, and P. C. Canfield, Phys. Rev. B 80, 024511 (2009).
- Chu et al. (2009) J.-H. Chu, J. G. Analytis, C. Kucharczyk, and I. R. Fisher, Phys. Rev. B 79, 014506 (2009).
- Lester et al. (2009) C. Lester, J.-H. Chu, J. G. Analytis, S. C. Capelli, A. S. Erickson, C. L. Condron, M. F. Toney, I. R. Fisher, and S. M. Hayden, Phys. Rev. B 79, 144523 (2009).
- Huang et al. (2017a) X. Y. Huang, Y. P. Singh, D. J. Haney, T. Hu, H. Xiao, H.-H. Wen, S. Zhang, M. Dzero, and C. C. Almasan, Phys. Rev. B 96, 094509 (2017a).
- Iida et al. (2016) K. Iida, V. Grinenko, F. Kurth, A. Ichinose, I. Tsukada, E. Ahrens, A. Pukenas, P. Chekhonin, W. Skrotzki, A. Teresiak, R. Hühne, S. Aswartham, S. Wurmehl, I. Mönch, M. Erbe, J. Hänisch, B. Holzapfel, S.-L. Drechsler, and D. V. Efremov, Scientific Reports 6, 28390 (2016).
- Meingast et al. (2012) C. Meingast, F. Hardy, R. Heid, P. Adelmann, A. Böhmer, P. Burger, D. Ernst, R. Fromknecht, P. Schweiss, and T. Wolf, Phys. Rev. Lett. 108, 177004 (2012).
- Ning et al. (2014) F. L. Ning, M. Fu, D. A. Torchetti, T. Imai, A. S. Sefat, P. Cheng, B. Shen, and H.-H. Wen, Phys. Rev. B 89, 214511 (2014).
- Huang et al. (2017b) X. Y. Huang, D. J. Haney, Y. P. Singh, T. Hu, H. Xiao, H.-H. Wen, M. Dzero, and C. C. Almasan, Phys. Rev. B 95, 184513 (2017b).
- Arsenijević et al. (2013) S. Arsenijević, H. Hodovanets, R. Gaál, L. Forró, S. L. Bud’ko, and P. C. Canfield, Phys. Rev. B 87, 224508 (2013).
- Sachdev (2010) S. Sachdev, Physica Status Solidi 247, 537 C543 (2010).
- Sefat (2011) A. S. Sefat, Reports on Progress in Physics 74, 124502 (2011).
- Ahilan et al. (2009) K. Ahilan, F. L. Ning, T. Imai, A. S. Sefat, M. A. McGuire, B. C. Sales, and D. Mandrus, Phys. Rev. B 79, 214520 (2009).
- Ahilan et al. (2008) K. Ahilan, J. Balasubramaniam, F. L. Ning, T. Imai, A. S. Sefat, R. Jin, M. A. McGuire, B. C. Sales, and D. Mandrus, Journal of Physics: Condensed Matter 20, 472201 (2008).
- Colombier et al. (2010) E. Colombier, M. S. Torikachvili, N. Ni, A. Thaler, S. L. Bud’ko, and P. C. Canfield, Superconductor Science and Technology 23, 054003 (2010).
- Sidorov et al. (2002) V. A. Sidorov, M. Nicklas, P. G. Pagliuso, J. L. Sarrao, Y. Bang, A. V. Balatsky, and J. D. Thompson, Phys. Rev. Lett. 89, 157004 (2002).
- Zhou et al. (2013) R. Zhou, Z. Li, J. Yang, D. L. Sun, C. T. Lin, and G.-q. Zheng, 4, 2265 (2013).
- Saha et al. (2009) S. R. Saha, N. P. Butch, K. Kirshenbaum, and J. Paglione, Phys. Rev. B 79, 224519 (2009).
- Saha et al. (2012) S. R. Saha, N. P. Butch, T. Drye, J. Magill, S. Ziemak, K. Kirshenbaum, P. Y. Zavalij, J. W. Lynn, and J. Paglione, Phys. Rev. B 85, 024525 (2012).
- Kudo et al. (2013) K. Kudo, K. Iba, M. Takasuga, Y. Kitahama, J.-i. Matsumura, M. Danura, Y. Nogami, and M. Nohara, Scientific Reports 3, 1478 (2013).
- Alireza et al. (2009) P. L. Alireza, Y. T. C. Ko, J. Gillett, C. M. Petrone, J. M. Cole, G. G. Lonzarich, and S. E. Sebastian, Journal of Physics: Condensed Matter 21, 012208 (2009).
- Takagi et al. (1992) H. Takagi, R. J. Cava, M. Marezio, B. Batlogg, J. J. Krajewski, W. F. Peck, P. Bordet, and D. E. Cox, Phys. Rev. Lett. 68, 3777 (1992).
- Cooper et al. (2009) R. A. Cooper, Y. Wang, B. Vignolle, O. J. Lipscombe, S. M. Hayden, Y. Tanabe, T. Adachi, Y. Koike, M. Nohara, H. Takagi, C. Proust, and N. E. Hussey, Science 323, 603 (2009).
- Seo et al. (2013) S. Seo, X. Lu, J.-X. Zhu, R. R. Urbano, N. Curro, E. D. Bauer, V. A. Sidorov, L. D. Pham, T. Park, Z. Fisk, and J. D. Thompson, Nature Physics 10, 120 (2013).
- Ke et al. (2017) F. Ke, H. Dong, Y. Chen, J. Zhang, C. Liu, J. Zhang, Y. Gan, Y. Han, Z. Chen, C. Gao, J. Wen, W. Yang, X.-J. Chen, V. V. Struzhkin, H.-K. Mao, and B. Chen, Advanced Materials 29, 1701983 (2017), 1701983.
- Gegenwart et al. (2008) P. Gegenwart, Q. Si, and F. Steglich, Nat Phys 4, 186 (2008).
- Nakai et al. (2013) Y. Nakai, T. Iye, S. Kitagawa, K. Ishida, S. Kasahara, T. Shibauchi, Y. Matsuda, H. Ikeda, and T. Terashima, Phys. Rev. B 87, 174507 (2013).
- Panagopoulos et al. (2002) C. Panagopoulos, J. L. Tallon, B. D. Rainford, T. Xiang, J. R. Cooper, and C. A. Scott, Phys. Rev. B 66, 064501 (2002).