Influence of hydrogen on electron-phonon coupling and intrinsic electrical resistivity in zirconium: a first-principles study
Abstract
This paper presents the first-principles calculation of the electron-phonon coupling and the temperature dependence of the intrinsic electrical resistivity of the zirconium-hydrogen system with various hydrogen concentrations. The nature of the anomalous decrease in the electrical resistivity of the Zr-H system with the increase of hydrogen concentration (at high concentrations of H/Zr1.5) is studied. It was found that the hydrogen concentration, where the resistivity starts to decrease, is very close to the critical concentration of the - phase transition. It is shown that the tetragonal lattice distortion due to the - phase transition of the Zr-H system eliminates imaginary phonon frequencies and the strong electron-phonon coupling of the phase and, as a result, leads to the reduction of the electrical resistivity of the Zr-H system at a high hydrogen concentration.
- PACS numbers
-
63.20.Kr, 64.70.Kb, 71.20.Be, 72.15.-v
pacs:
Valid PACS appear hereI Introduction
The features of the metal-hydrogen interaction have been extensively studied over many years Mueller et al. (2013); Sakintuna et al. (2007); Fukai (2006). The addition of hydrogen in metals leads to the change in its mechanical, transport, magnetic and other properties caused by the electron density redistribution and the change in the phonon structure and electron-phonon coupling. One of the most interesting changes is that the hydrogen absorption leads to a significant increase of the superconducting critical temperature , which was first found in thorium Satterthwaite and Toepke (1970) and in palladium Skoskiewicz (1972). The nature of the increasing is the high Debye temperature due to the light mass of hydrogen. Recently, the high- superconductivity in H3S Errea et al. (2015); Drozdov et al. (2015) and LaH10 Peng et al. (2017); Drozdov et al. was reported in both experimental and theoretical studies, which provided credible evidence of the possibility to build a room-temperature superconductor from BCS theory.
The electron-phonon coupling (EPC), known as an importan physical process in metal superconductivity, is also important for studying its other transport properties, in particular, electrical resistance. The measurement of the electrical resistivity can help us to identify the type of defects (in particular impurities) and their concentration in a real material. Moreover, the data for electrical resistivity are also helpful for understanding the heat conduction and other thermal properties of metals. An interesting fact observed in the experiments is the reduction of the electrical resistivity in some hydrogen-metal systems at very high H concentrations. In the Pd-H system this reduction occurs at the concentration H/Pd0.71 Geerken and Griessen (1983) at 300 K and H(D)/Pd0.75 Sakamoto et al. (1996) at 298 K; in the Zr-H system it occurs at the concentration H/Zr1.6 Bickel and Berlincourt (1970) at 300 K. The correlation between the reduction of the electrical resisitivity and the phase transition of the Pd-H and Zr-H systems was assumed in experiments Geerken and Griessen (1983); Bickel and Berlincourt (1970), using empirical models; however, it has still not been clarified by theoretical calculation. The understanding of the experimental observation is still open.
This work focuses on the study of the Zr-H system. Zr-based alloys are extensively used as structural materials for active zones of light-water reactors since Zr has a low thermal-neutron absorption cross section and good corrosion resistance and strength characteristics. Hydrogen is actively accumulated in the materials during the reactor’s operation and causes their corrosion and degradation of their mechanical properties Wang and Gong (2012a); Zieliński and Sobieszczyk (2011); Zuzek et al. (1990). To study the influence of hydrogen on the mechanical properties of zirconium-based alloys, knowledge of the atomic structure of the Zr-H system is necessary. It was shown in experimental and theoretical works that at low H concentrations, the Zr-H system has a hexagonal close packed (HCP) structure and H atoms are located at tetragonal interstitial sites Khoda-Bakhsh and Ross (1982); Narang et al. (1977); Lopatina et al. (2015); Svyatkin et al. (2018). At high H concentrations ( H/Zr ), the Zr-H system has a face-centered cubic (FCC) or face-centered tetragonal (FCT) structure Zuzek et al. (1990); Ackland (1998); Niedźwiedź et al. (1993); Cantrell et al. (1984); Bowman Jr et al. (1983). The transition from the phase (FCC structure) to the phase (FCT structure, ) was investigated in Refs. Yakel (1958); Bowman Jr et al. (1983); Niedźwiedź et al. (1993); Kul’kova et al. (1999); Miwa and Fukumoto (2002); Quijano et al. (2009), and it is known that the critical H concentration of this phase transition is located at . It has been reported that there is a strong reduction in the electron state density at Fermi level due to the phase transition (for ZrH2 this reduction achieves 0.5 state/eV per unit cell Quijano et al. (2009)). The electron-driven mechanisms of the phase transition in the Zr-H system with were investigated in the works Gupta (1982); Cantrell et al. (1984); Wolf and Herzig (2000); Quijano et al. (2009); Zhang et al. (2011); Wang and Gong (2012b). It should be mentioned that the expected correlation between the phase transition and decreasing resistance implies the importance of the electron-phonon coupling to the phase transition in the Zr-H system. But, to our knowledge, the key factors of electron-phonon coupling, varying with the change in the hydrogen concentration, are still unclear.
The electrical properties of the Zr-H system were measured experimentally for different purposes, such as researching the hydrogen kinetics Grib et al. (2010), the thermal properties Tsuchiya et al. (2002a), and the isotope effect Uno et al. (2004); Tsuchiya et al. (2002b). Unlike the Pd-H system, the phonon distribution in the Zr-H system can be described by linear-response theory since the hydrogen atoms in Zr behave like ”Einstein” oscillators (independent simple harmonic oscillators). This makes the first-principles calculation of EPC in the Zr-H system possible within density functional perturbation theory (DFPT). In present work, the H concentration’s influence on the electron-phonon coupling and intrinsic electrical resistivity of Zr is theoretically studied. The electron-phonon coupling is analyzed by means of the Eliashberg function and the Eliashberg transport function . To clarify the relationship between the phase transition and the reduction of the electrical resistivity, the influence of the tetragonal lattice distortion on the electron-phonon coupling of ZrH2, as an example, was investigated. We study the main factors decreasing the resistance of the Zr-H system due to its phase transition. Before the calculation of the electron-phonon coupling, we have determinated the lattice structure of the Zr-H system, and the results are discussed in the Appendix A.
II Methodology and computational details
All calculations in our work were carried out from first principles within density functional theory and DFPT using the optimized norm-conserving Vanderbilt pseudopotential method (ONCVPSP) Hamann (2013), as implemented in the ABINIT Gonze et al. (2016) code. To describe the exchange and correlation effects, the generalized gradient approximation (GGA) in the form of Perdew, Burke, and Ernzerhof Perdew et al. (1996) was used. The cut off energy for the plane wave basis was set to 30 Ha in the structural optimization and relaxation and 40 Ha in the electronic structure calculation and linear-response calculation. To describe the occupation of electron levels, the temperature smearing method of “cold smearing” Verstraete and Gonze (2002) with a broadening of 0.001 Ha (about 316 K) was adopted, and the cut off energy of the smearing function was set to 0.5 Ha. For structural optimization, the Broyden-Fletcher-Goldfarb-Shanno minimization Eitan et al. (2011) was adopted. The atoms in the system considered were assumed to be in the equilibrium configuration when the force on each atom was below Ha/bohr.
The present calculations were performed for ZrH0.5, ZrH, ZrH1.25, ZrH1.5, ZrH1.75, ZrH2 and pure Zr. In our calculations we considered three possible structures: HCP, FCC, and FCT, with the H atoms all in tetragonal (T) sites or all in octaherdral (O) sites (see the Appendix A). To carry out the structural optimization and relaxation of the system considered, a supercell with 4 Zr atoms was adopted, and the meshes were chosen to be for the HCP structure and for the FCC, the FCT structures. In the electronic structure calculations [including the calculation of a band structure and the electronic density of states (EDOS)] for the ZrH2 and phases, the meshes of and , respectively, were adopted. In linear-response calculations, for pure Zr and ZrH a supercell with two Zr atoms was adopted, and a mesh of and a mesh of were chosen. For ZrH1.25, ZrH1.5, and ZrH1.75 the supercell with four Zr atoms was adopted, a mesh of and the q-mesh of were chosen. For ZrH2 the primitive cell was used, a mesh of and the q-mesh of were chosen.
By means of DFPT within the linear-response theory, the first-order perturbation potentials for a phonon with frequency (crystal momentum and branch index ) were calculated. Then they were used in the calculation of the electron-phonon matrix elements as . More details about the theoretical methods can be found in the review by Giustino Giustino (2017). The Eliashberg function Allen (1972), which measures the contribution of the phonons with frequency to scattering processes of the electrons at the Fermi level, was calculated in terms of the phonon linewidths ,
| (1) |
where is the EDOS per atom and spin at the Fermi level . The linewidth is written by electron-phonon matrix elements :
The strength of is described by the parameter
| (3) |
which is called the electron-phonon coupling constant.
For the calculation of transport properties, the tetrahedron smearing method Zaharioudakis (2004) was adopted. The Eliashberg transport function Allen (1971), which is used to describe the influence of the electron-phonon scattering on transport properties, and additionally considers the efficiency factor of electronic transport , is calculated as follows
| (4) | |||||
where an efficiency factor has been introduced in the terms of the electron velocity in the state , with being the average square of the Fermi velocity. The strength of is described by the parameter
| (5) |
which is called the transport constant. For a metal, the electrical resistivity can be calculated by solving the Boltzmann equation in the lowest-order variational approximation Savrasov and Savrasov (1996), and can be written in terms of as follows
| (6) |
where and is the unit cell volume.
The electrical resistivity was calculated for the two lattice directions: for pure Zr and ZrH0.5 with a HCP structure, the directions along primitive lattice vectors and ; for zirconium hydrides (at hydrogen concentration ) with a FCC or FCT structure, the directions are along primitive lattice vectors and close-packing direction . We have found the relative difference between the different lattice directions is less than . As a result, the calculated electrical resistivity presented in Sec. III is chosen to be the average value of all the considered directions.
III Results and discussion
III.1 Electron-phonon coupling and electrical resistivity of the Zr-H system
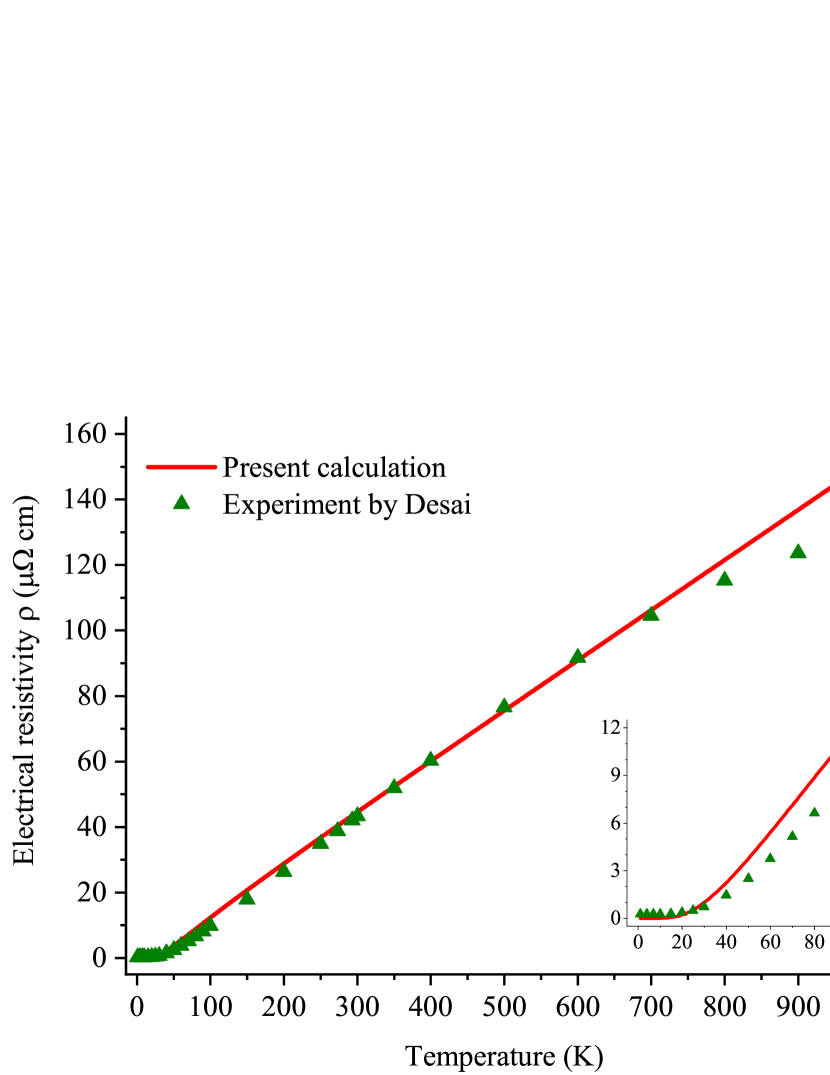
First, we present the calculated temperature dependence of the electrical resistivity for pure Zr and the experimental results Desai et al. (1984) in Fig. 1. It can be seen that the theoretical curve is close to the experimental data for temperature up to 800 K. At a temperature above 800 K, significant deviations between the calculated and experimental results are observed. This situation is caused by two factors. First, at the temperature of 823 K the transformation of the phase with a HCP structure into the phase with a body-centered cubic (BCC) structure is observed Zuzek et al. (1990). Second, the harmonic approximation which is used in the present work to describe the EPC is incorrect at high temperature. As shown in the inset of Fig. 1, there is a considerable difference between the calculated electrical resistivity and the experimental data at low temperature, since in this case, in addition to the electron-phonon scattering, the size effects, electron-electron scattering, scattering on impurities, etc. give significant contributions to the electrical resistance Savrasov and Savrasov (1996). Thus, we did not investigate the electrical resistivity at a temperature below 200 K in this work. It also should be mentioned that we did not consider any disorder or impurity effect in the present study, but the considered configurations in present work are stable (without imaginary phonon frequency in the spectrum).
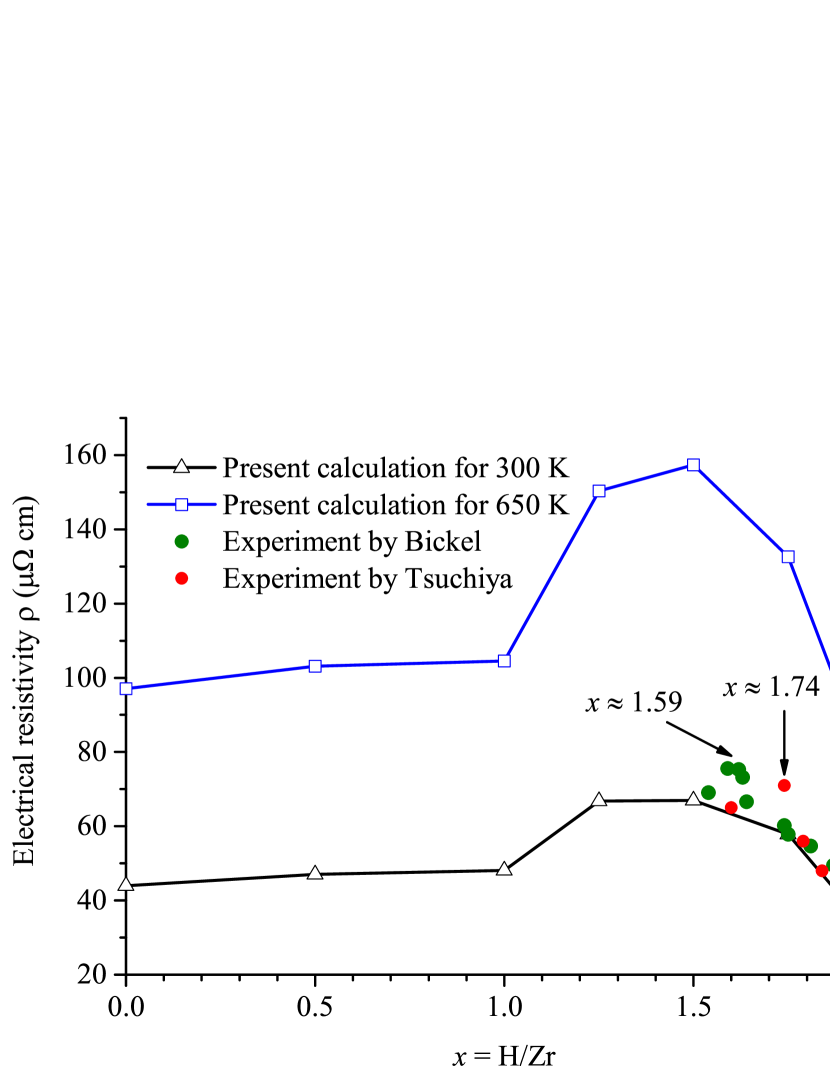
The calculated electrical resistivity of the ZrHx system depending on the H concentration at 300 K is shown together with the experimental data Bickel and Berlincourt (1970); Tsuchiya et al. (2002b, a) in Fig. 2. We also calculated this dependence at the typical operating temperature of the nuclear reactor (650 K). Unfortunately, in the literature there are no experimental data for this temperature. Since at a temperature of 650 K the harmonic approximation allows the correct calculation of the electrical resistance, the calculated results have practical importance. Figure 2 shows that the behavior of the function is the same at both temperature values, although at the higher temperature the function is changed more sharply due to a stronger lattice vibration. According to both our results and the experimental results, the reduction in the electrical resistivity starts at H concentration , and zirconium hydrides become a better electrical conductor than pure Zr at H concentration .
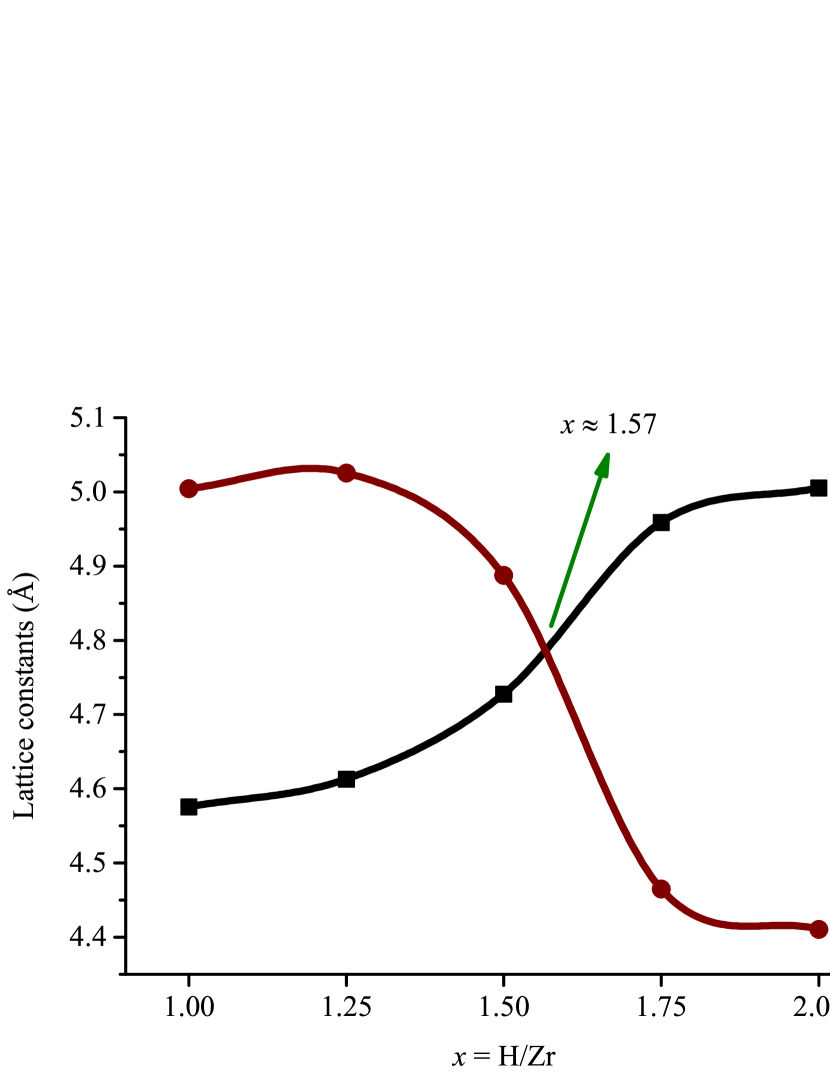
It should be noticed that the concentration is close to the concentration of the phase transition of the Zr-H system. The and phases have different values for the lattice parameter relation . In Fig. 3 , we present the dependence of the lattice parameters and on the H concentration in zirconium hydrides. It can be seen that, with the H concentration increasing the parameter is increased, while the parameter is decreased and, as a consequence, the value of the relation is decreased. The lattice parameters and become equal at the concentration , which is close to the experimental results of the phase transition () Bowman Jr et al. (1983) and the concentration . Thus, we assume that the observed behavior of the H concentration dependence of the electrical resistivity is related to the lattice tetragonal distortion in zirconium hydride. This relation will be discussed in detail in Sec. III.2.
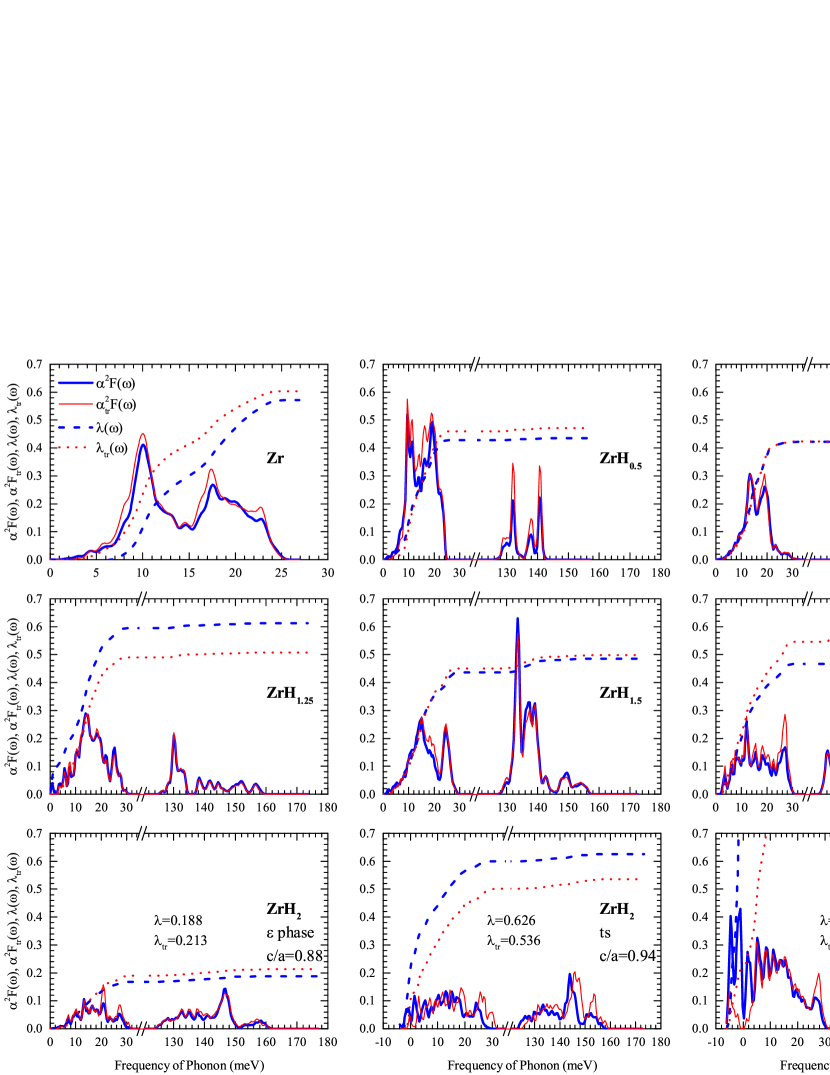
Further, we focus on the EPC in the Zr-H system. The calculated Eliashberg function , Eliashberg transport function , and their strength electron-phonon coupling constant and transport constant for the Zr-H system with various H concentrations are shown in Fig. 4. The calculation value of for pure Zr indicates quite a strong electron-phonon coupling that is typical for transition metals due to the large effective mass of its electrons Mott (1964). Good agreement between the calculated resistivity and the experimental data allows us to conclude that the calculated spectra of are credible.
Figure 4 shows that the Eliashberg function and Eliashberg transport function are similar in shape, and the difference between the values of and does not exceed in all the stable structures of the ZrHx system. So we can conclude that the efficiency factor , which gives a preferential weight from the backscattering process, gives a small contribution to the electron-phonon scattering process for the Zr-H system Savrasov and Savrasov (1996). It should be noticed that the difference between and is very small in ZrH, ZrH1.5, and ZrH2. In the cases of ZrH1.25 and ZrH1.75, which were not observed in the experiment, this difference is observable, which indicates a Fermi surface nesting which is related to the instability of these systems. Therefore, we will discuss below only ZrH, ZrH1.5, and ZrH2, which correspond to the experimentally observed , , and zirconium hydride phases. In addition, it can be seen from the case of the unstable structures of ZrH2 with and that the electron backscattering weakens the strong coupling. In particular, the system is not able to hold a strong EPC since strong coupling leads to the instability of the system. As a result, the system transforms into a new structure with weaker coupling. It seems that there is a relevance between the electron backscattering and the phase transition in the Zr-H system. Especially, there is a significant difference between and in -ZrH2 due to the electron backscattering, which may cause a strong Fermi surface nesting Crespi and Cohen (1992) and a phase transition. It is clearly seen for ZrH2 that the decrease in the value of from 1 to 0.88 leads to the increase of the relation from 0.32 to 1.14. This means that the EPC becomes weaker due to the tetragonal distortion, and the strong Fermi surface nesting of the phase recedes. The weak EPC in -ZrH2 can explain why ZrH2 is a better conductor than pure Zr.
The contribution of H atoms to the electron-phonon scattering is also an interesting issue. It was found that the H-character phonons give a small contribution to and in the Zr-H system as shown Fig. 4. In particular, the contribution of the H-character phonon to is , , and in ZrH, ZrH1.5, and ZrH2, respectively. The small contribution of H atoms can be explained by the presence of strong Zr-H chemical bonds Quijano et al. (2009), which limits the H vibration modes on a small scale. This fact can also explain why the harmonic approximation correctly describes the phonon structure in the Zr-H system. The contribution of the H-character phonon modes to EPC increases with the increasing of the H concentration.
III.2 Electron-phonon-driven phase transition and reduction of electrical resistivity
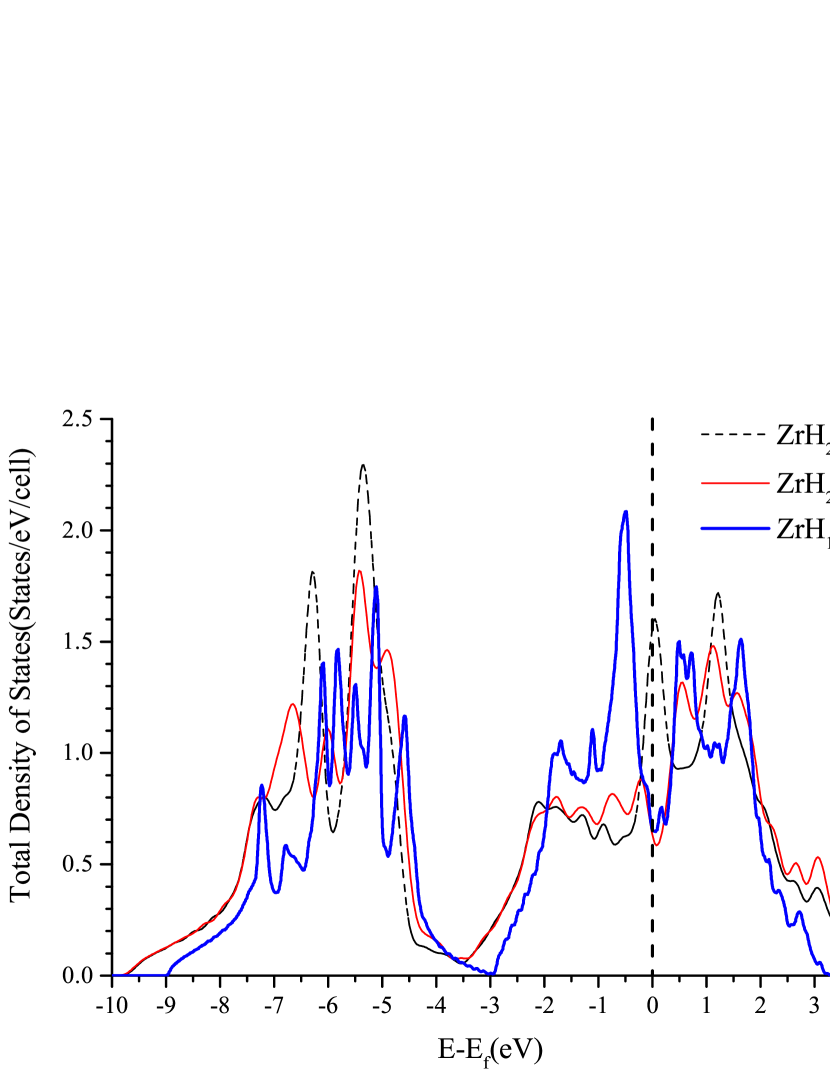

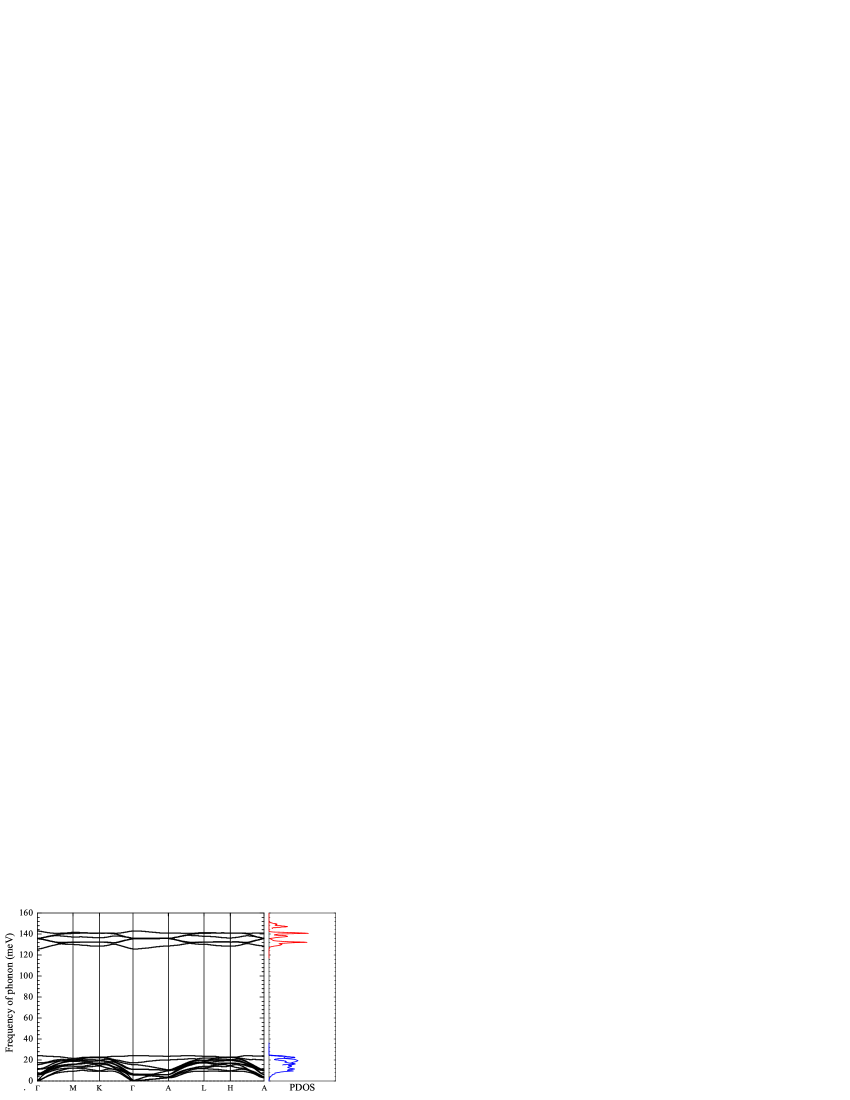
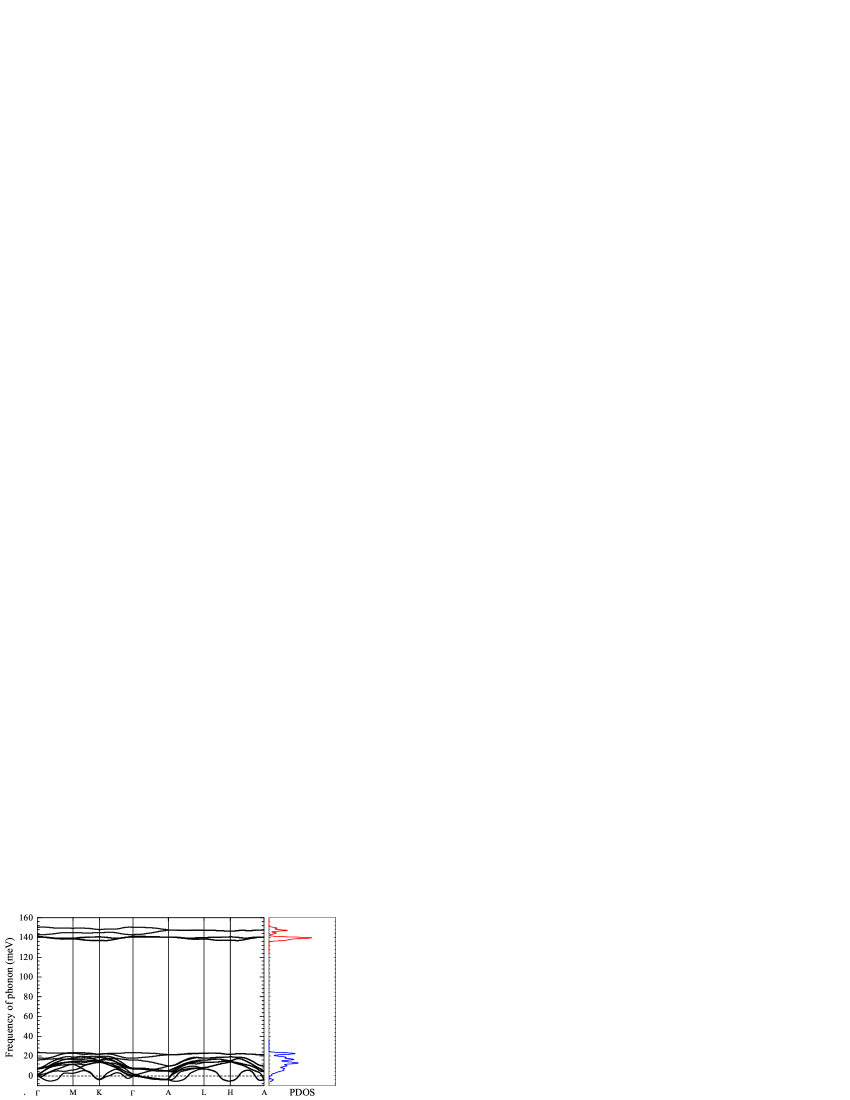
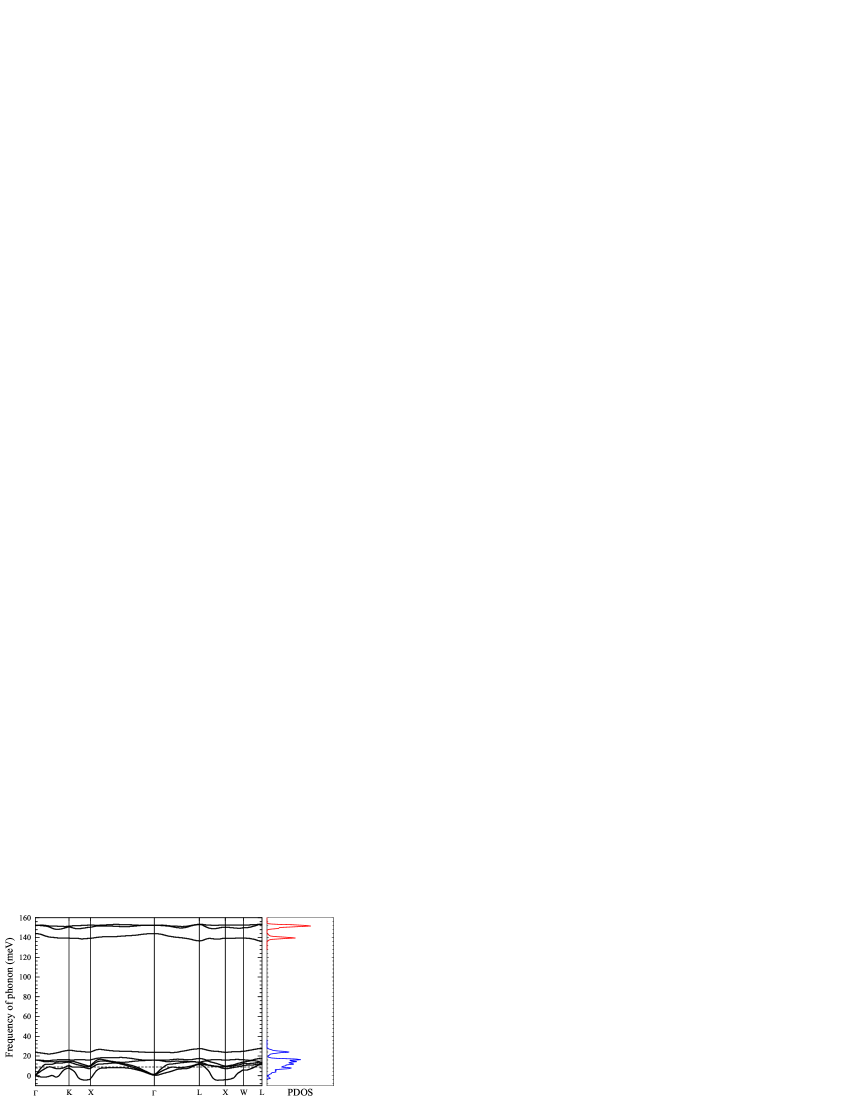
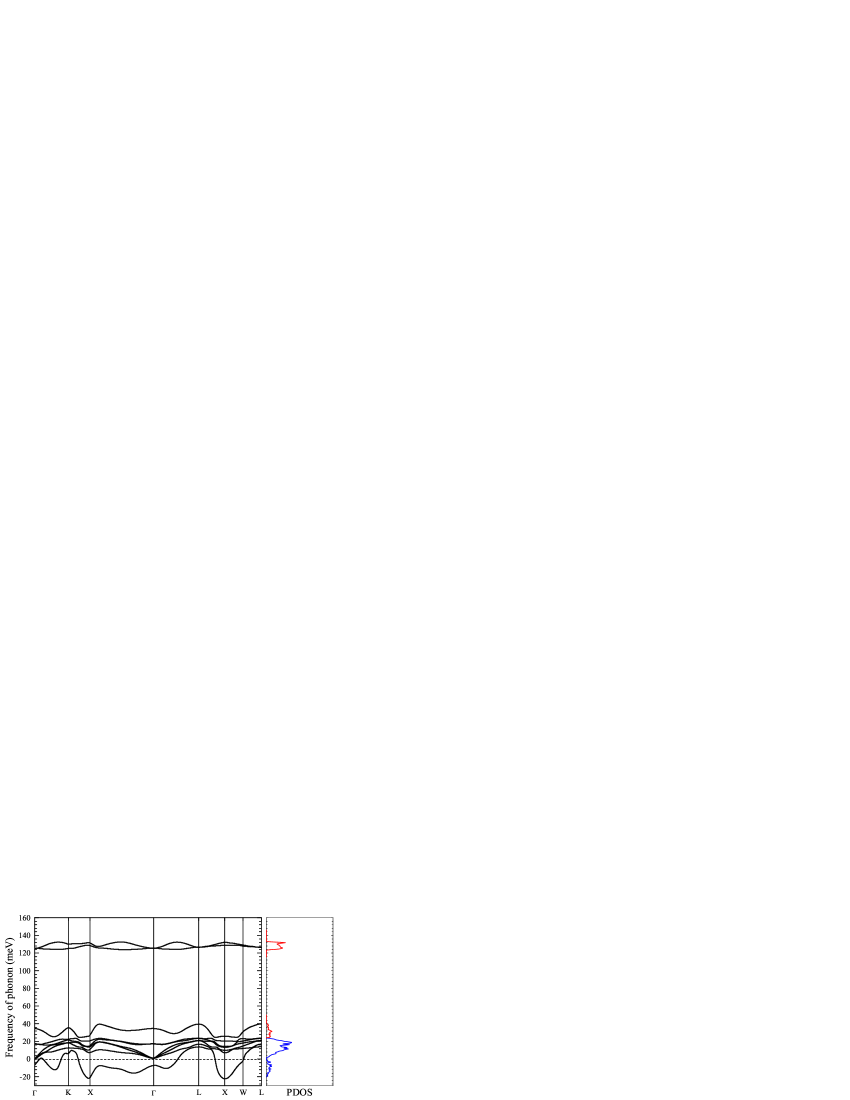
In this section we will discuss in detail the influence of the tetragonal distortion of the FCC structure on the electrical properties of ZrH2. As we said, the instability of the FCC structure plays an important role in the reduction of the electrical resistivity; it leads to the phase transition and also weakens the electron-phonon coupling in the Zr-H system. There are three indications of the structural instability of the phase: the high peak of the EDOS at the Fermi level, imaginary phonon frequencies and the extremely high value of the Fermi surface nesting factor, and they correspond to the electron-, phonon-, and electron-phonon- driven mechanisms of the tetragonal distortion in the Zr-H system. There are two main electron-driven mechanisms, the first is the splitting of the bands at the Fermi level in the direction due to Jahn-Teller effect Cantrell et al. (1984); Wolf and Herzig (2000); Miwa and Fukumoto (2002); Quijano et al. (2009), and the second is the reduction of by a shift in energy of the band along the direction Kul’kova et al. (1999); Quijano et al. (2009). The key point is that the two electron-driven mechanisms lead to the reduction in from the phase to the phase (Fig. 5). We can see that the high splits into two peaks near the Fermi level through the phase transition, and the system obtains structural stability in this way. The phonon spectrum also shows the structural instability of the ZrH2 phase. As shown in Fig. 6, in the , , and directions the Zr-character phonon modes have imaginary frequencies around the point. As a consequence, in the and directions the signs of electron-driven mechanisms of phase transition were observed, so we can assume that the phase transition is related to the interaction between electrons and phonons.
According to Eq. 6, there are three parameters which influence the electrical resistivity: the conduction electron concentration , the transport constant and the average square of the Fermi velocity . In Fig. 5 we also compare the EDOS between the ZrH2 phase and ZrH1.5 with the FCC(T) structure since ZrH1.5 can be considered the energetically stable configuration of the phase (the ZrH2 phase is unstable). We can see that there is no significant difference in the EDOS at the Fermi level between the ZrH2 phase and ZrH1.5. In fact, the value of the transport constant of 0.498 for ZrH1.5 is about 2.338 times higher than the value of 0.213 for ZrH2, and this is in good agreement with the value of 2.4 for the ratio of (ZrH1.5)/(ZrH2). Thus, we conclude that the reduction in the electrical resistivity is defined by the change in ; the influences of the conduction electron concentration and the Fermi velocity are small, and they equalize each other.
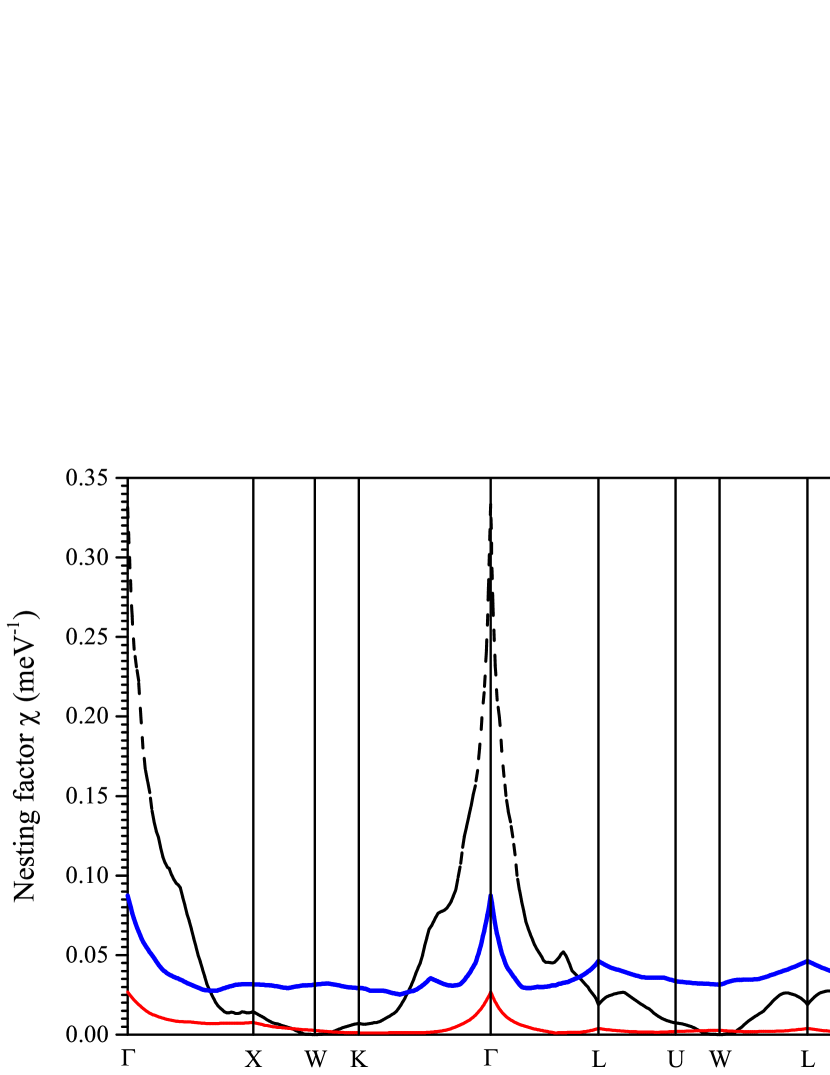
Two factors influence : the Fermi surface nesting and the electron-phonon coupling matrix elements. To evaluate the Fermi surface nesting, we calculated the distribution of the nesting factor in the reciprocal space, as shown in Fig. 7. As we said, the strong nesting is the electron-phonon-driven mechanism of the phase transition of the Zr-H system. It can clearly be seen that in the ZrH2 phase, the nesting is strong around the point in the , , directions where the imaginary phonon frequencies appear. It can also be found that the nesting factor has its maximum at the point. It is interesting that the point is like a singular point which is the center of imaginary phonon frequencies, but the Zr-character acoustic phonon frequencies at point are close to 0. The Zr-character acoustic phonon modes are following the “2+1” splitting Giannozzi et al. (1991), the frequencies of the two degenerate modes are imaginary, and the frequencies of split mode are positive. This may be caused by the fact that the nesting vector (points to the maximum of the nesting factor) ( point) and the point as the point with the highest degeneracy cannot be modified, so the period-lattice distortion and the charge-density modulation have not been observed in ZrH2, unfortunately. But the Fermi surface nesting behavior in ZrH2 can still help us to understand the modification of the electron and phonon structures of the system, especially the changes around the point. In particular, through the phase transition, the nesting factor not only strongly decreases around the point but also has a global reduction. If we compare the stable ZrH1.5 and ZrH2, we can see that the nesting in ZrH1.5 is stronger than in ZrH2. In particular, we can see that in the system the effect of the electron-phonon coupling on the electron transport is weakened due to the modification of the electronic structure, which leads to the decrease in the electrical resistance. Also, such a system with strong Fermi surface nesting is unstable, and it may lead to a phase transition.
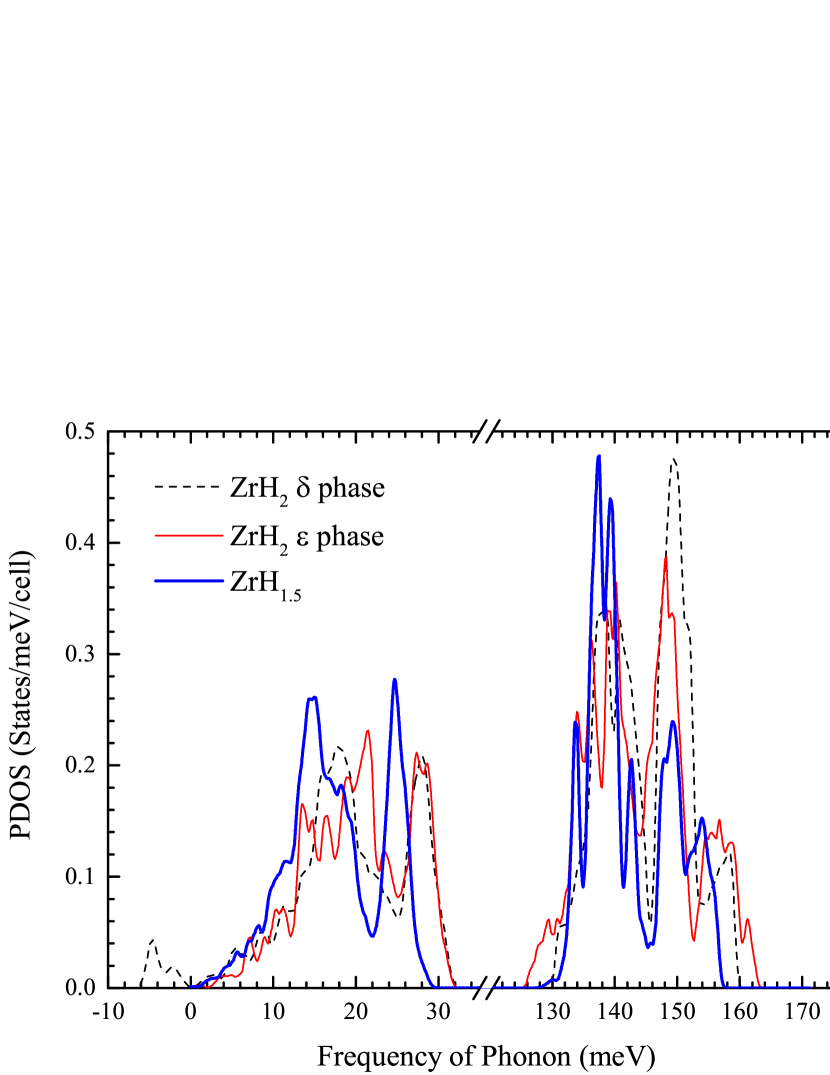
It is also important to investigate the influence of the electron-phonon coupling matrix elements, which indicate the strength of the single-scattering process. To achieve this goal, we calculated the changes in the phonon density of states (PDOS) through the transition, as shown in Fig. 8. We can see that the frequency range of the H-character optical phonon in both the ZrH2 phase and ZrH1.5 is narrower than in the ZrH2 phase, and the gap between the acoustic and optical phonons in both the ZrH2 phase and ZrH1.5 is higher than in the ZrH2 phase. Under a high-symmetry condition (cubic structure), phonon modes in the system have a higher degeneracy, which leads to the high peak and narrow range of the H-character optical phonon frequency, and this might be a reason why the H-character optical phonon plays a more important role in the phase. The shapes of the PDOS and are similar, in fact, can also be seen as a modification of the PDOS with a weight from the electron-phonon coupling. Figure 8 shows that the PDOSs in the and phases have no significant difference, but the comparison of between the and phases in Fig. 4 shows that the electron-phonon coupling in the phase is much stronger than in the phase. Thus, we can conclude that the electron-phonon coupling matrix elements play the defining role in the scattering process.
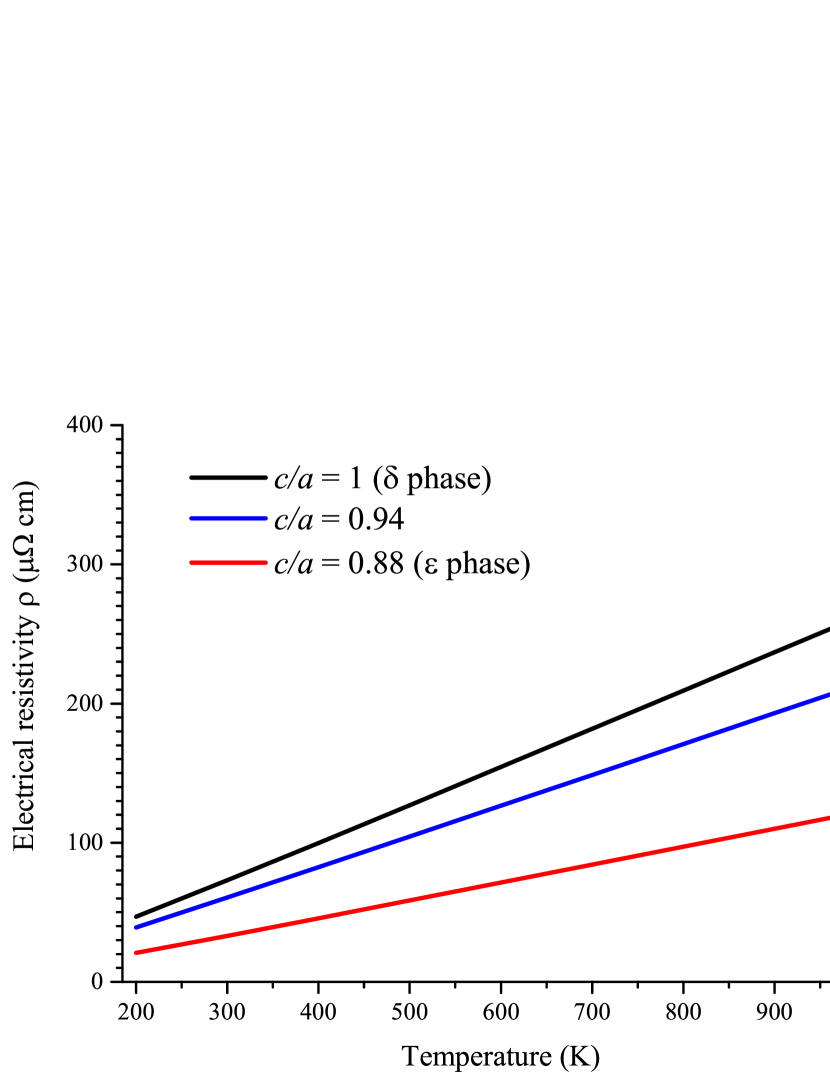
In addition, to clarify that the tetragonal distortion of a FCC structure is the reason for the decrease in the electrical resistance, we consider an imaginary transition state (ts) of ZrH2 with the lattice volume and ratio being the average of the and phases. The calculated results of the ts show that this state has a structural instability weaker than the phase: the values of and are lower than in the case of the phase, and higher than in the case of the phase. In the end, we show the calculated results of for the ZrH2 , phases and the ts in Fig. 9. We can clearly see that the electrical resistivity of ZrH2 decreases through the tetragonal distortion. In the phase the electrical resistivity is much higher, and the temperature dependence is steeper than in the phase. It should be noticed that the results for the phase and ts are not physical because of the imaginary phonon frequencies. We can conclude that the high electrical resistivity in the phase is caused by its strong electron-phonon coupling, and it comes from the structural instability of the FCC structure. We can see that through the tetragonal distortion the imaginary phonon frequency and the strong electron-phonon coupling are eliminated. As a result, the stable state of the phase with weak electron-phonon coupling strength is obtained, and it causes the reduction in the electrical resistivity of the ZrHx system at a high hydrogen concentration (). In fact, the strong electron-phonon coupling in the phase can also be seen as a result of its high . The high provides a large number of backscattering electrons and gives a contribution to the strong Fermi surface nesting. Thus, we can conclude that the strong electron-phonon coupling has significant relevance to the structural instability of the phase.
IV Summary and conclusions
In the present paper, the nature of the anomalous decrease in the electrical resistivity of the Zr-H system with the increase of hydrogen concentration (at H/Zr1.5) was studied within the framework of the electron density functional theory and the density functional perturbation theory, using the optimized norm-conserving Vanderbilt pseudopotential method. To understand the nature of the reduction, a comprehensive study of the main factors decreasing the resistance was carried out.
It was shown that the electrical resistivity in the Zr-H system is not determinated by the conduction electron concentration but the change in electron-phonon coupling. We analyzed the electron-phonon coupling in the Zr-H system by means of the Eliashberg function and the Eliashberg transport function in detail. It was shown that with the increasing of H concentration in Zr, the change in the electron-phonon coupling strength is not great except in ZrH2. It was also found that in the stable configuration of the Zr-H system the difference between and is small, but it is large in the ZrH2 phase, which is unstable. It was established that the significant difference between and in the ZrH2 phase is caused by the backscattering of electrons due to the strong Fermi surface nesting, which is one of the reasons why ZrH2 transforms from the phase into the phase. It was also found that the strongly reduced Fermi surface nesting due to the phase transion is one main factor decreasing the resistance of Zr-H system. From this, the correlation between the phase transition and the reduction of electrical resistivity was clarfied. Another main factor decreasing the resistance is the strong reduction of the electron-phonon coupling matrix elements, which indicate the strength of single electron-phonon scattering process. It was shown that the ZrH2 phase has a resistivity significantly larger than that of the phase due to the strong electron-phonon coupling, which leads to the structural instability of the phase. The tetragonal lattice distortion due to the phase transition of ZrH2 eliminates imaginary phonon frequencies and the strong electron-phonon coupling.
| System | Structure | Method | Reference | |||
|---|---|---|---|---|---|---|
| Pure zirconium | HCP | 3.2346 | 5.1678 | 1.5976 | GGA | Present work |
| 3.2317 | 5.1476 | 1.5928 | Exp. (298K) | Zuzek et al.,1990 | ||
| 3.213 | 5.159 | 1.605 | GGA | Wang and Gong,2012a | ||
| 3.23 | 5.18 | 1.60 | GGA | Domain et al.,2002 | ||
| Zr2H | HCP(T), C1 | 3.2603 | 5.3962 | 1.6551 | GGA | Present work |
| 3.3 | 5.145 | 1.56 | Exp. (293K) | Zhao et al.,2008 | ||
| 3.313 | 5.549 | 1.675 | GGA | Wang and Gong,2012a | ||
| HCP(T), C2 | 3.2433 | 5.4892 | 1.6925 | GGA | Present work | |
| 3.26 | 5.447 | 1.671 | GGA | Wang and Gong,2012a | ||
| FCT(T), C3 | 4.7597 | 4.4595 | 0.9369 | GGA | Present work | |
| 4.676 | GGA | Wang and Gong,2012a | ||||
| FCT(O), C4 | 4.4334 | 4.8431 | 1.0924 | GGA | Present work | |
| 4.575 | GGA | Wang and Gong,2012a | ||||
| ZrH | FCT(T) | 4.5754 | 5.0045 | 1.0938 | GGA | Present work |
| 4.5957 | 4.9686 | 1.081 | Exp. (293K) | Mueller et al.,2013 | ||
| 4.61 | 5.04 | 1.093 | GGA | Wang and Gong,2012b | ||
| ZrH1.25 | FCT(T) | 4.6130 | 5.0252 | 1.0894 | GGA | Present work |
| 4.79 | 5.20 | 1.086 | GGA | Wang and Gong,2012b | ||
| ZrH1.5 | FCT(T) | 4.7276 | 4.8874 | 1.0338 | GGA | Present work |
| 4.65 | 4.96 | 1.067 | Exp. (320K) | Bowman Jr et al.,1983 | ||
| 4.62 | 4.83 | 1.046 | GGA | Wang and Gong,2012b | ||
| ZrH1.75 | FCT(T) | 4.9585 | 4.4651 | 0.9005 | GGA | Present work |
| 4.9087 | 4.5220 | 0.9212 | Exp. (118K) | Cantrell et al.,1984 | ||
| 4.97 | 4.47 | 0.899 | GGA | Wang and Gong,2012b | ||
| ZrH2 | FCT(T) | 5.0053 | 4.4106 | 0.8812 | GGA | Present work |
| 4.9808 | 4.4336 | 0.8901 | Exp. (108K) | Cantrell et al.,1984 | ||
| 4.975 | 4.447 | 0.894 | Exp. (294K) | Niedźwiedź et al.,1993 | ||
| 4.982 | 4.449 | 0.893 | Exp. (320K) | Bowman Jr et al.,1983 | ||
| 5.021 | 4.432 | 0.883 | GGA | Quijano et al.,2009 | ||
| FCC(T) | 4.8089 | GGA | Present work | |||
| 4.817 | GGA | Quijano et al.,2009 | ||||
| 4.82 | GGA | Domain et al.,2002 | ||||
| 4.804 | LDA | Wolf and Herzig,2000 |
Acknowledgements.
The research was carried out within the framework of the grant of the Program for Enhancing Competitiveness of Tomsk Polytechnic University.*
Appendix A Structure of Zr-H system
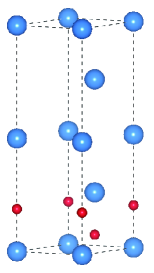
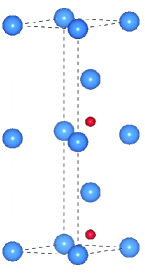
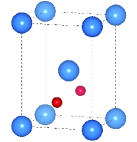
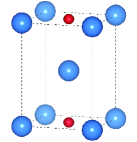
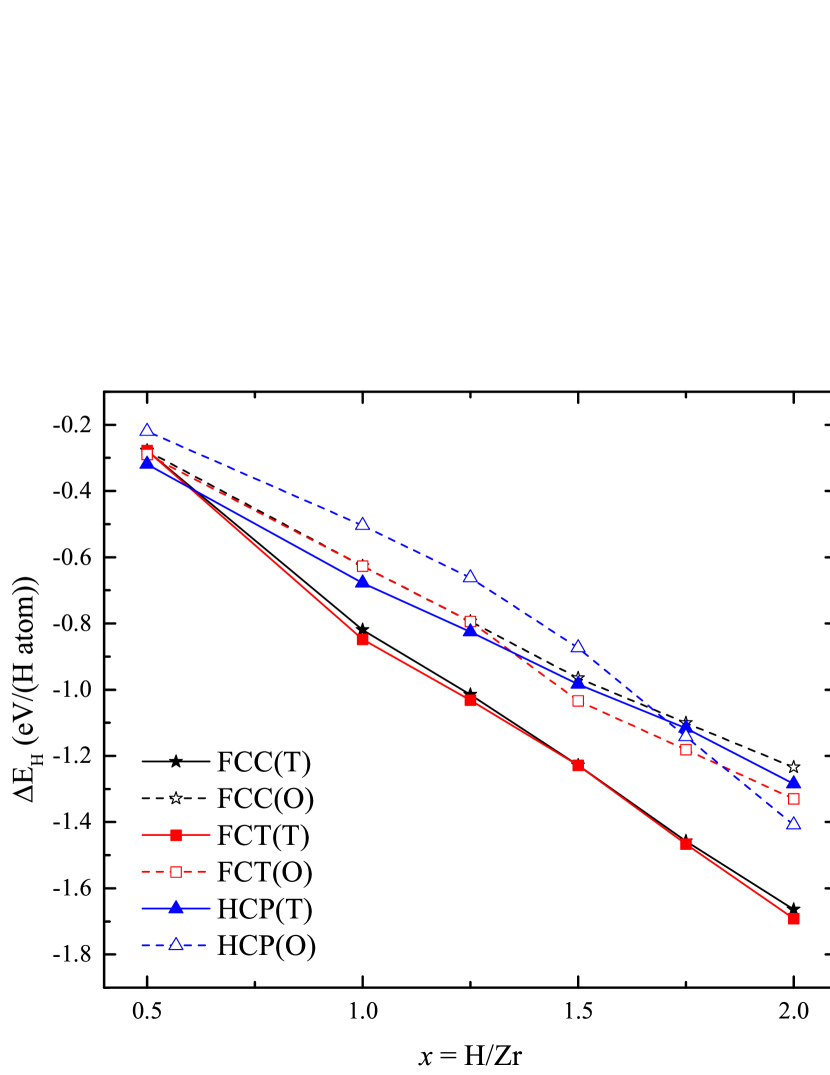
Before the calculation of the electron-phonon coupling in the Zr-H system, we determinated the lattice structure of this system. The lattice structure of Zr-H systems has been well studied in both experimental and theoretical studies Zuzek et al. (1990); Narang et al. (1977); Khoda-Bakhsh and Ross (1982); Bowman Jr et al. (1983); Niedźwiedź et al. (1993); Ackland (1998); Zhao et al. (2008); Wang and Gong (2012a, b). In the present work, for zirconium hydrides (with hydrogen concentration ), we studied the stable configurations which were defined in Ref. Wang and Gong (2012b). For ZrH0.5, according to the results of previous works, there is an ambiguity. The metastable state of ZrH0.5 with a HCP structure with low-symmetry was identified by transmission electron microscopy and first-principles calculations Zhao et al. (2008). However, it was reported in Ref. Wang and Gong (2012a) that ZrH0.5 has a FCC structure in a high-symmetry configuration. Hence, for ZrH0.5 we considered four configurations, C1-C4, to study its structural stability, as shown in Fig. 10.
First, we calculated the dissolution energy of hydrogen in zirconium
| (7) |
where , , and are the total energies of ZraHb, pure HCP Zr (ground state) and a H2 molecule, respectively. of the various ZrHx systems as a function of H concentration are shown in Fig. 11. It can be seen from Fig. 11 that it is energetically most advantageous for the ZrHx system to have the HCP(T) lattice structure at and the FCT(T) structure at . At a concentration of , the dissolution energy of H in Zr with the FCT(T) structure exceeds the dissolution energy in Zr with the FCC(T) structure by an amount not exceeding 0.1 eV/H atom. As a result, under external perturbations (for example, radiation or a high temperature), the ZrHx system can pass from the FCT structure to the FCC structure. It can also be seen that the H concentration dependence of the dissolution energy is linear, particularly with a slope coefficient of eV/H atom. It should be pointed out that configuration C1 of ZrH0.5, which is presented as the HCP(T) structure in Fig. 11, has the lowest total energy; however, this energy is close to the total energies of configurations C3 and C4 with the FCT lattice (the difference in the total energy is less than 0.4 meV/Zr atom). Since the energy difference between the HCP and FCT structures of ZrH0.5 is too small to determinate the stable structure, the phonon spectra of ZrH0.5 with configurations C1-C4 were analyzed to study its structural stability (see Fig. 12). It can clearly be seen that the H location in Zr is important to the structural stability of the Zr-H system: configurations C2-C4 have the imaginary phonon frequency, while configuration C1 does not.
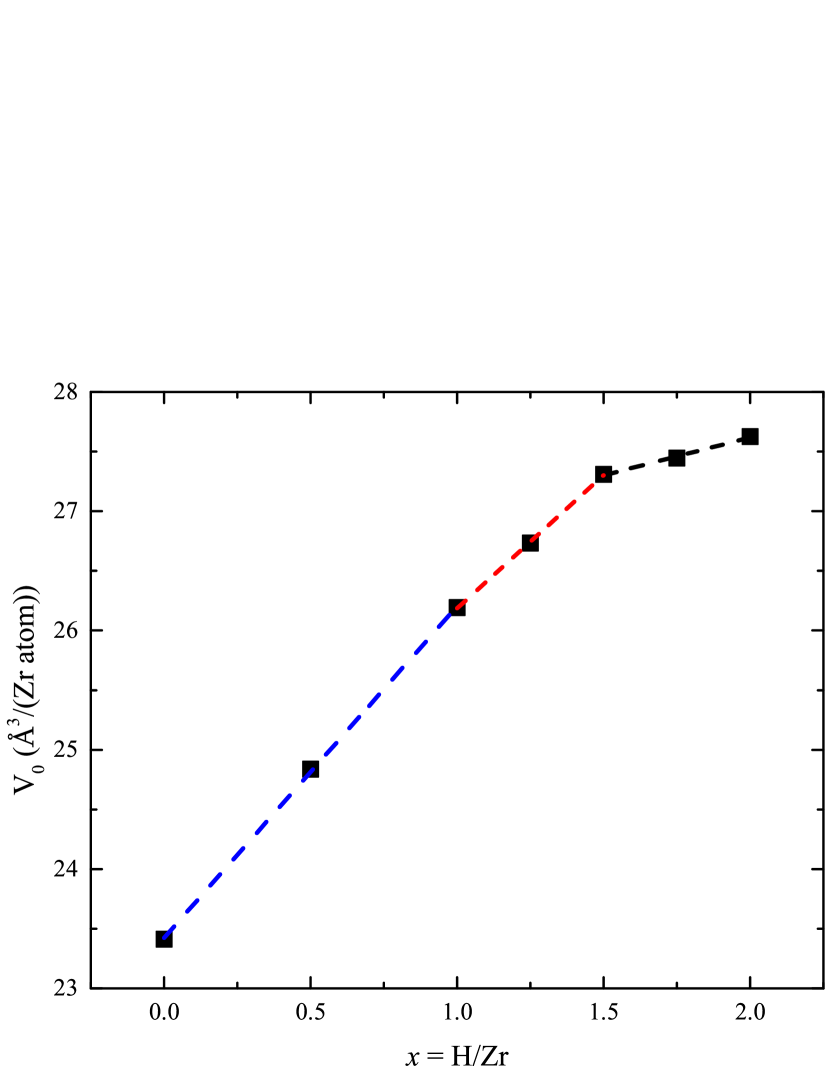
The calculated lattice parameters ( and ) of pure Zr and the ZrHx systems are shown in Table 1 and have very good agreement with the previous calculation results and experimental data Zuzek et al. (1990); Wang and Gong (2012a); Domain et al. (2002); Zhao et al. (2008); Mueller et al. (2013); Bowman Jr et al. (1983); Cantrell et al. (1984); Niedźwiedź et al. (1993); Quijano et al. (2009). It is observed that the ratio decreases with increasing H concentration in Zr, as in experiments Bowman Jr et al. (1983); Cantrell et al. (1984). As the intrinsic electrical resistivity depends on the crystal volume [Eq. 6], it is interesting to study a change in the crystal volume of the Zr-H system depending on the hydrogen concentration (see Fig. 13). This dependence has a linear character with different slopes at hydrogen concentration ranges of , and . The linear approximation by the least-squares method gives lines with slope coefficients of /Zr atom in the range of , /Zr atom in the range of and /Zr atom in the range of . The change in the slope in the dependence of the crystal volume on the hydrogen concentration is due to the phase transition in the Zr-H system.
References
- Mueller et al. (2013) W. M. Mueller, J. P. Blackledge, and G. G. Libowitz, Metal hydrides (Elsevier, 2013).
- Sakintuna et al. (2007) B. Sakintuna, F. Lamari-Darkrim, and M. Hirscher, Int. J. Hydrog. Energy 32, 1121 (2007).
- Fukai (2006) Y. Fukai, The metal-hydrogen system: basic bulk properties, Vol. 21 (Springer Science & Business Media, 2006).
- Satterthwaite and Toepke (1970) C. Satterthwaite and I. Toepke, Phys. Rev. Lett. 25, 741 (1970).
- Skoskiewicz (1972) T. Skoskiewicz, Phys. Status Solidi A 11 (1972).
- Errea et al. (2015) I. Errea, M. Calandra, C. J. Pickard, J. Nelson, R. J. Needs, Y. Li, H. Liu, Y. Zhang, Y. Ma, and F. Mauri, Phys. Rev. Lett. 114, 157004 (2015).
- Drozdov et al. (2015) A. Drozdov, M. Eremets, I. Troyan, V. Ksenofontov, and S. Shylin, Nature 525, 73 (2015).
- Peng et al. (2017) F. Peng, Y. Sun, C. J. Pickard, R. J. Needs, Q. Wu, and Y. Ma, Phys. Rev. Lett. 119, 107001 (2017).
- (9) A. Drozdov, P. Kong, V. Minkov, S. Besedin, M. Kuzovnikov, S. Mozaffari, L. Balicas, F. Balakirev, D. Graf, V. Prakapenka, et al., Nature 569, 528 (2019).
- Geerken and Griessen (1983) B. Geerken and R. Griessen, J. Phys. F: Met. Phys. 13, 963 (1983).
- Sakamoto et al. (1996) Y. Sakamoto, K. Takai, I. Takashima, and M. Imada, J. Phys.: Condens. Matter 8, 3399 (1996).
- Bickel and Berlincourt (1970) P. Bickel and T. Berlincourt, Phys. Rev. B 2, 4807 (1970).
- Wang and Gong (2012a) F. Wang and H. Gong, Int. J. Hydrog. Energy 37, 12393 (2012a).
- Zieliński and Sobieszczyk (2011) A. Zieliński and S. Sobieszczyk, Int. J. Hydrog. Energy 36, 8619 (2011).
- Zuzek et al. (1990) E. Zuzek, J. Abriata, A. San-Martin, and F. Manchester, Bulletin of Alloy Phase Diagrams 11, 385 (1990).
- Grib et al. (2010) A. Grib, G. Khadzhay, B. Merisov, D. Vinogradov, and M. Tikhonovsky, Int. J. Hydrog. Energy 35, 5442 (2010).
- Tsuchiya et al. (2002a) B. Tsuchiya, M. Teshigawara, K. Konashi, and M. Yamawaki, J. Alloy. Compd. 330, 357 (2002a).
- Uno et al. (2004) M. Uno, K. Yamada, T. Maruyama, H. Muta, and S. Yamanaka, J. Alloy. Compd. 366, 101 (2004).
- Tsuchiya et al. (2002b) B. Tsuchiya, M. Teshigawara, K. Konashi, S. Nagata, T. Shikama, and M. Yamawaki, J. Nucl. Sci. Technol. 39, 402 (2002b).
- Khoda-Bakhsh and Ross (1982) R. Khoda-Bakhsh and D. Ross, J. Phys. F: Met. Phys. 12, 15 (1982).
- Narang et al. (1977) P. Narang, G. Paul, and K. Taylor, Journal of the Less Common Metals 56, 125 (1977).
- Lopatina et al. (2015) O. V. Lopatina, L. A. Svyatkin, Y. M. Koroteev, and I. P. Chernov, Phys. Solid State 57, 1719 (2015).
- Svyatkin et al. (2018) L. Svyatkin, Y. M. Koroteev, and I. Chernov, Phys. Solid State 60, 10 (2018).
- Ackland (1998) G. Ackland, Phys. Rev. Lett. 80, 2233 (1998).
- Niedźwiedź et al. (1993) K. Niedźwiedź, B. Nowak, et al., J. Alloy. Compd. 194, 47 (1993).
- Cantrell et al. (1984) J. S. Cantrell, R. J. Bowman, and D. Sullenger, J. Phys. Chem. 88, 918 (1984).
- Bowman Jr et al. (1983) R. Bowman Jr, E. Venturini, B. Craft, A. Attalla, and D. Sullenger, Phys. Rev. B 27, 1474 (1983).
- Yakel (1958) H. Yakel, Acta Crystallogr. 11, 46 (1958).
- Kul’kova et al. (1999) S. Kul’kova, O. Muryzhnikova, and I. Naumov, Phys. Solid State 41, 1763 (1999).
- Miwa and Fukumoto (2002) K. Miwa and A. Fukumoto, Phys. Rev. B 65, 155114 (2002).
- Quijano et al. (2009) R. Quijano, R. de Coss, and D. J. Singh, Phys. Rev. B 80, 184103 (2009).
- Gupta (1982) M. Gupta, Phys. Rev. B 25, 1027 (1982).
- Wolf and Herzig (2000) W. Wolf and P. Herzig, J. Phys.: Condens. Matter 12, 4535 (2000).
- Zhang et al. (2011) P. Zhang, B.-T. Wang, C.-H. He, and P. Zhang, Comp. Mater. Sci. 50, 3297 (2011).
- Wang and Gong (2012b) F. Wang and H. Gong, Int. J. Hydrog. Energy 37, 9688 (2012b).
- Hamann (2013) D. Hamann, Phys. Rev. B 88, 085117 (2013).
- Gonze et al. (2016) X. Gonze, F. Jollet, F. A. Araujo, D. Adams, B. Amadon, T. Applencourt, C. Audouze, J.-M. Beuken, J. Bieder, A. Bokhanchuk, et al., Comput. Phys. Commun. 205, 106 (2016).
- Perdew et al. (1996) J. P. Perdew, K. Burke, and M. Ernzerhof, Phys. Rev. Lett. 77, 3865 (1996).
- Verstraete and Gonze (2002) M. Verstraete and X. Gonze, Phys. Rev. B 65, 1 (2002).
- Eitan et al. (2011) R. Eitan, M. Mundt, and D. J. Tannor, Phys. Rev. A 83, 053426 (2011).
- Giustino (2017) F. Giustino, Rev. Mod. Phys. 89, 015003 (2017).
- Allen (1972) P. B. Allen, Phys. Rev. B 6, 2577 (1972).
- Zaharioudakis (2004) D. Zaharioudakis, Comput. Phys. Commun. 157, 17 (2004).
- Allen (1971) P. Allen, Phys. Rev. B 3, 305 (1971).
- Savrasov and Savrasov (1996) S. Y. Savrasov and D. Y. Savrasov, Phys. Rev. B 54, 16487 (1996).
- Desai et al. (1984) P. D. Desai, H. M. James, and C. Y. Ho, J. Phys. Chem. Ref. Data 13, 1097 (1984).
- Mott (1964) N. F. Mott, Advances in Physics 13, 325 (1964).
- Crespi and Cohen (1992) V. H. Crespi and M. L. Cohen, Solid State Commun. 81, 187 (1992).
- Giannozzi et al. (1991) P. Giannozzi, S. De Gironcoli, P. Pavone, and S. Baroni, Phys. Rev. B 43, 7231 (1991).
- Zhao et al. (2008) Z. Zhao, J.-P. Morniroli, A. Legris, A. Ambard, Y. Khin, L. Legras, and M. Blat-Yrieix, J. Microsc. 232, 410 (2008).
- Domain et al. (2002) C. Domain, R. Besson, and A. Legris, Acta Mater. 50, 3513 (2002).