Resilience of spatial networks with inter-links behaving as an external field
Abstract
Many real systems such as, roads, shipping routes, and infrastructure systems can be modeled based on spatially embedded networks. The inter-links between two distant spatial networks, such as those formed by transcontinental airline flights, play a crucial role in optimizing communication and transportation over such long distances. Still, little is known about how inter-links affect the resilience of such systems. Here, we develop a framework to study the resilience of interlinked spatially embedded networks based on percolation theory. We find that the inter-links can be regarded as an external field near the percolation phase transition, analogous to a magnetic field in a ferromagnetic-paramagnetic spin system. By defining the analogous critical exponents and , we find that their values for various inter-links structures follow Widom’s scaling relations. Furthermore, we study the optimal robustness of our model and compare it with the analysis of real-world networks. The framework presented here not only facilitates the understanding of phase transitions with external fields in complex networks but also provides insight into optimizing real-world infrastructure networks and a magnetic field in a management.
I INTRODUCTION
Robustness is of crucial importance in many complex systems and plays an important role in mitigating damage gao_universal_2016 . It has been studied widely in both single networks cohen_resilience_2000 ; albert2000error ; tanizawa2005optimization , interdependent networks buldyrev_catastrophic_2010 ; leicht_percolation_2009 ; hu_percolation_2011 ; gao2011robustness ; gao_networks_2012 ; shekhtman2015resilience and multiplex networks hackett_bond_2016 ; sole-ribalta_congestion_2016 . Percolation theory has demonstrated its great potential as a versatile tool for understanding system resilience based on both dynamical and structural properties aharony2003introduction ; bunde2012fractals , and has been applied to many real systems saberi2015recent ; li2015percolation ; meng_percolation_2017 . Recently, a theoretical framework has been developed to study the resilience of communities formed of either Erdős-Rényi (ER) and Scale-Free networks that have inter-linkes between them using percolation theory DongPNAS2018 . It has been found that the inter-links affect the percolation phase transition in a manner similar to an external field in a ferromagnetic-paramagnetic spin system. However, many real systems, such as, transportation networks weiss_global_2018 ; strano2017scaling , infrastructure networks hines2010topological and others, are spatially embedded and the influence of this feature has not been considered. Here we study how the inter-links (e.g. air flights) between two spatial networks (e.g., countries) affect the overall resilience. Furthermore, we will search for an optimal structure (or most robust point) of our model and consider it in a real transportation system. We will do so by developing a framework to study the resilience of spatial networks with inter-links and by analysing possible optimal structures for our model/s and in real transport systems.
The structure of our paper is as follows: in the next Chapter, we describe and introduce the model. In Chapter III, the results are presented and discussed. Finally, in Chap. IV a short summary and outlook are provided.
II MODEL
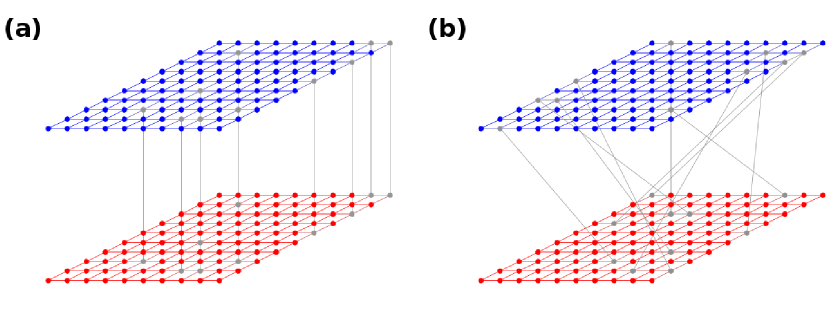
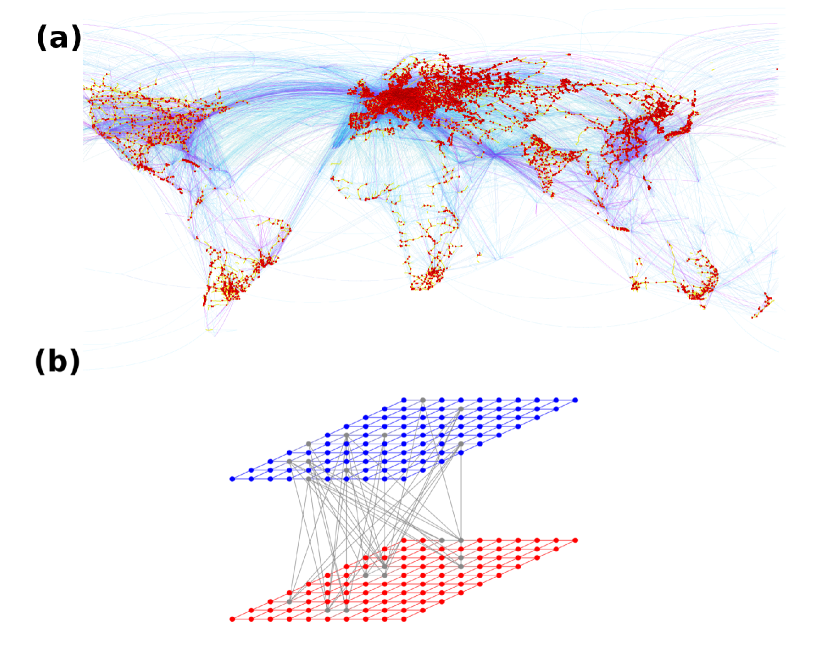
Our model is motived by many real-world networks where nodes and links are spatially embedded within the same region (module), but only some nodes have connections to other regions (modules). We denote the links in the same module as intralinks and the links between different modules as interlinks. Fig. 1(a) demonstrates the topological structure of the global transportation network including railway roads and airline routes DATA . We demonstrate in the figure that the airports are connected via interlinks and can be regarded as interconnected nodes. We show here that the interlinks behave, regarding breakdown of the network, in a manner analogous to an external field from physics near magnetic-paramagnetic phase transition Stanley_1971 ; reynolds1977ghost . To study this effect, for simplicity and without loss of generalization, we carried out extensive simulations on a network of two modules each with the same number of nodes, , where is the linear size of the lattice, representing the spatial networks. Within each module the nodes are only connected with their neighbors in space as defined by a 2-dimensional square lattice. Between different modules, we randomly select a fraction of nodes to be interconnected nodes, e.g, airports, and randomly assign interlinks among nodes in the two modules. A network generated from our model is shown in Fig. 1(b). Our model is realistic and can represent coupled transport systems, i.e, the nodes in the same lattice module are localized railroad or road networks within the same region while the interlinks represent interregional airline routes.
To quantify the resilience of our model, we carried out extensive numerical simulations of the size of the giant connected component after a fraction of nodes are randomly removed. Note that our model is distinct from the case of interdependent networks buldyrev_catastrophic_2010 , where the failure of nodes in one network leads to the failure of dependent nodes in other networks. Our model is also different from the interconnected modules model shai_critical_2015 , where interconnected nodes are attacked. In our model, the interconnections between different communities are additional connectivity links li2014epidemics and randomly chosen nodes are attacked DongPNAS2018 . For a given set of parameters , we carried out 10,000 Monte Carlo realizations and took the average of these results to obtain .
III RESULTS
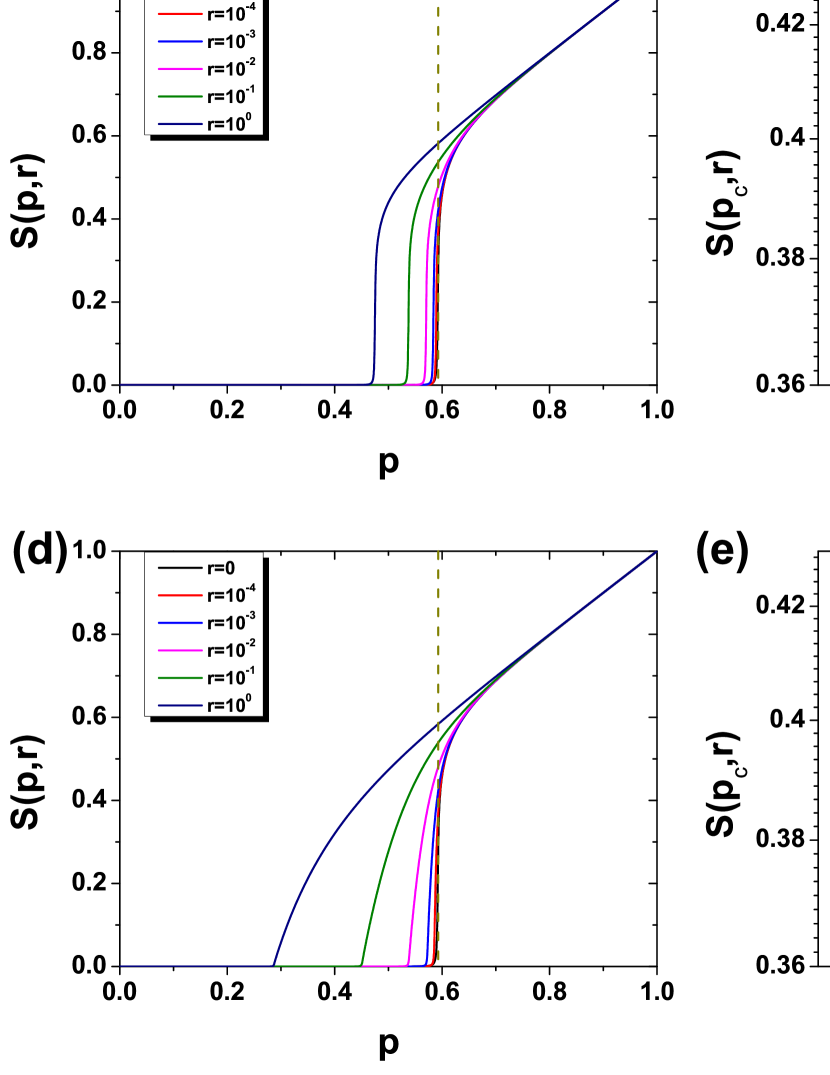
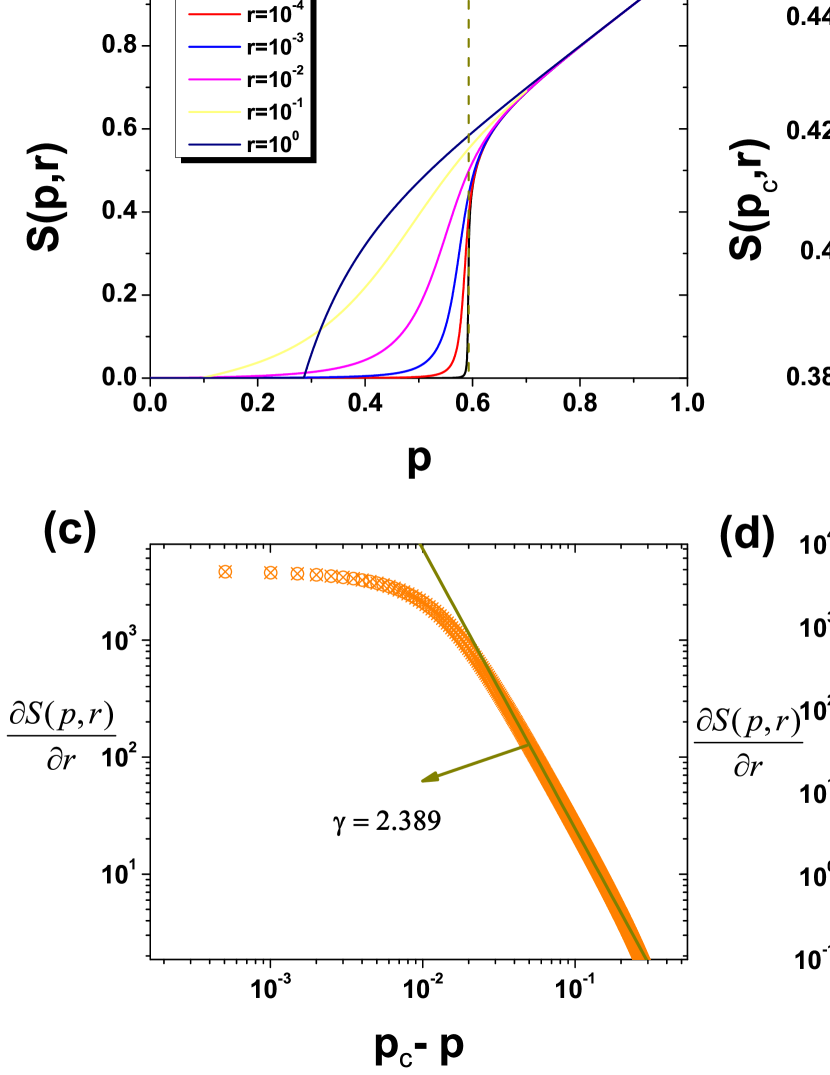
Similar to our earlier studies DongPNAS2018 ; shekhtman_critical_2018 , we find that the parameter , governing the fraction of interconnected nodes, has effects analogous to a magnetic field in a spin system, near criticality. This analogy can be seen through the facts that: (i) the non-zero fraction of interconnected nodes destroys the original phase transition point of the single module; (ii) critical exponents (defined below) of values derived from percolation theory can be used to characterize the effect of external field on . Fig. 2(a) shows our simulation results for the size of the giant component with , for various . We note that in the limit of our model recovers the critical threshold of single square lattices, newman_efficient_2000 . We find that for , showing that the interconnected nodes remove the phase transition of the single lattice.
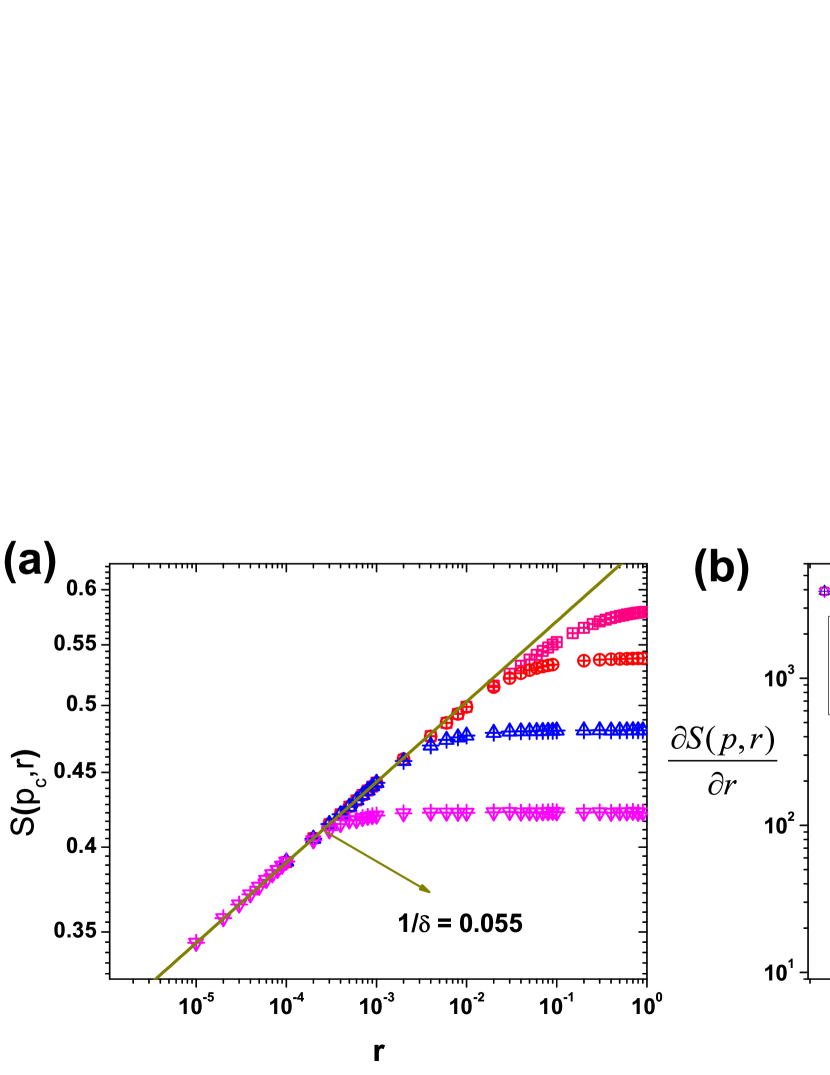
Next, we investigate the scaling relations and critical exponents, with , and serving as our analogy for magnetization (order parameter), temperature, and the external field respectively Stanley_1971 . To quantify how the external field, , affects the phase transition, we define the critical exponents , which relates the order parameter at the critical point to the magnitude of the field,
| (1) |
and , which describes the susceptibility near criticality,
| (2) |
where is the site percolation threshold for a single 2-dimensional square lattice network.
The simulation results for in our model are shown in Fig. 2(b). We obtain from simulations, which agrees very well with the known exponent value for standard percolation on square lattices aharony2003introduction ; bunde2012fractals . The dashed line is the best fit-line for the data with R-Square .
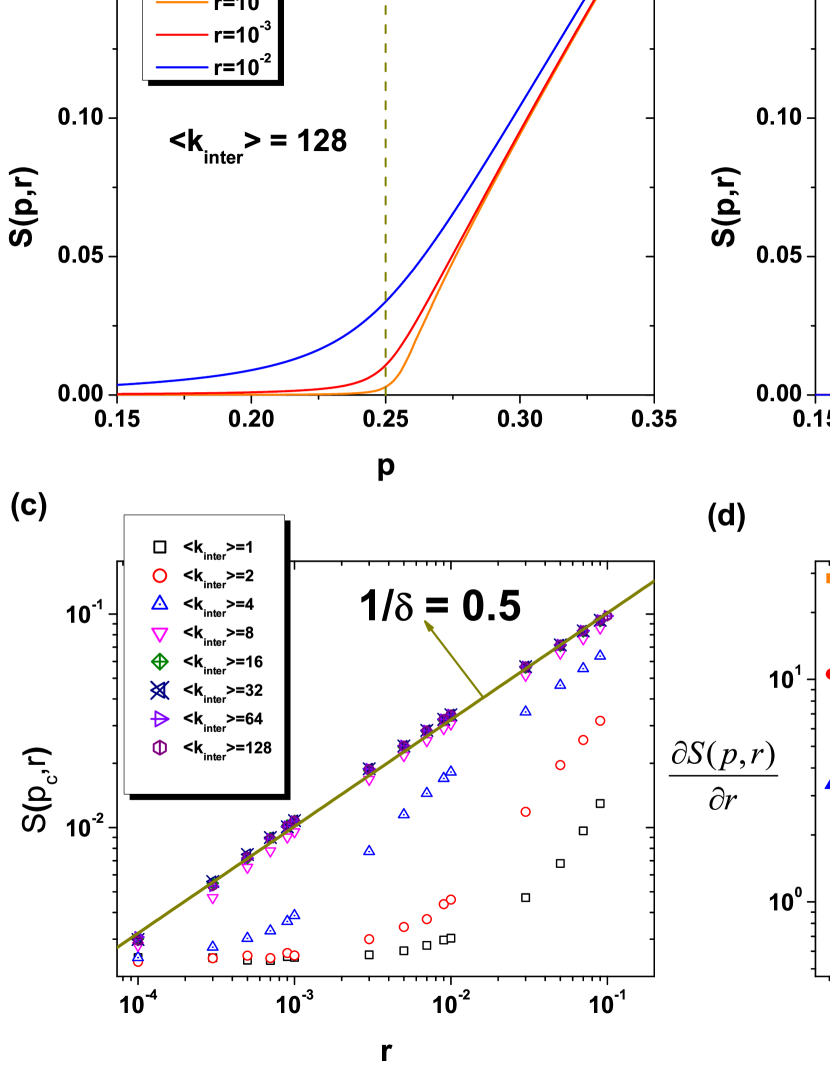
We next investigate the critical exponent, , which we claim to be analogous to magnetic susceptibility exponent with the scaling relation given in Eq. (2). Fig. 2(c) presents our results for . We obtain for and , which agrees again very well with the known value in percolation aharony2003introduction ; bunde2012fractals . In Fig. 2(d) we also plot our results for different values: to highlight the changes in the range of the scaling region. We find that as decreases, the scaling region becomes larger, this is expected since for smaller the system approaches closer to criticality (=0). Similar effects in terms of the scaling range are also observed for changing with respect to the critical exponent and Eq. (1), as seen in Fig. S1 SI .
We note that for a single 2d square lattice, the scaling exponent , defined by the relation , has a value of aharony2003introduction ; bunde2012fractals . The critical exponent together with and characterize the percolation universality class for our model. Since the various thermodynamic quantities are related, these critical exponents are not independent, but rather can be uniquely defined in terms of only two of them domb2000phase . We find that the scaling hypothesis is also valid for our model and note that our values for these exponents are consistent with the Widom’s identity bunde2012fractals .
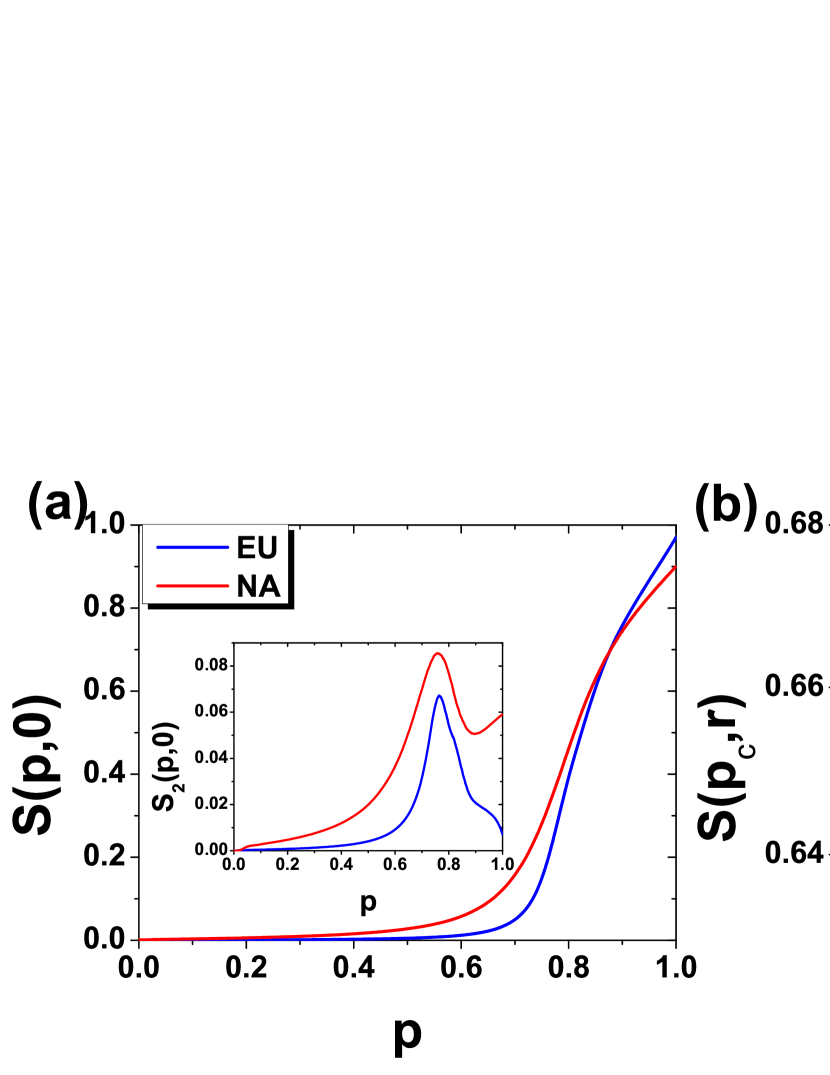
In the following, we test our framework on a real world example involving global transportation networks. We consider two railway networks, one in Europe (EU) and the other in North America (NA). The two railway networks have and nodes (stations), as well as and intralinks respectively. As an example of adding long distance flights, we added interconnected links randomly among fraction of the nodes (airport hubs). We used , which is the actual number of direct flights between the two continents. Fig. 3 shows our results for the system of the two real networks. We find that, the values of the critical exponents and for the real networks [Fig. 3(b) and (c)] are consistent with the results obtained from our model. One should note that the percolation threshold is different in each module when they are separated, since the number of nodes and links is not the same in both modules. To obtain the percolation threshold, for each real railway network, we analyzed the second largest component, . The size of the second largest cluster is known to be at a maximum at margolina_size_1982 . We obtained and by utilizing the peak of for the EU and NA networks respectively [see inset of Fig. 3(a)].
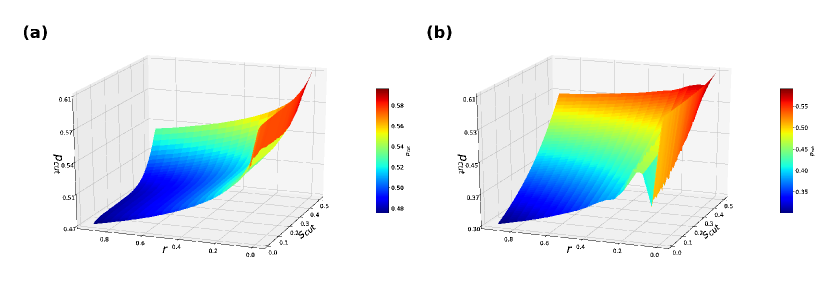
To analyze the robustness of our model, we define an effective percolation threshold, , by using a small cut-off value of the giant component , as shown in Fig. 4(a). The threshold is defined as the point where reaches . We assume that when is very small as or below it is not functional. Interestingly, we find an optimal in our model. It means that for a certain the system is most robust i.e., is minimal. Indeed, Fig. 4(b) shows a specific example with , where we find the optimal point to be . In our framework, this suggests that if of the cities have interconnected flights the network is most robust to random failures. The origin of this optimization phenomenon is due to the percolation competition between the individual lattice module and the interconnected ‘network’ composed of interconnected nodes/inter-links. When is small enough, the behavior of the giant component is dominated by the single lattice module [see Fig. 4(a)], and the threshold is large and close to [see Fig. 4(b), with small ]; when is increasing, the effect of the giant component of a single lattice module becomes weaker, but the effect from the interconnected nodes/inter-links becomes stronger resulting the decreasing of ; however, when is large, the behavior of the giant component is dominated by the interconnected nodes/inter-links, is proportional to [see Fig. 4(b), with large ]. In particular, our model will become like a random network, when . We also find that, in Fig. 4(b), there are no significant finite-size effects for our system since the three curves with are nearly overlapping. The results on how changes with and are shown in Fig. 4(c).
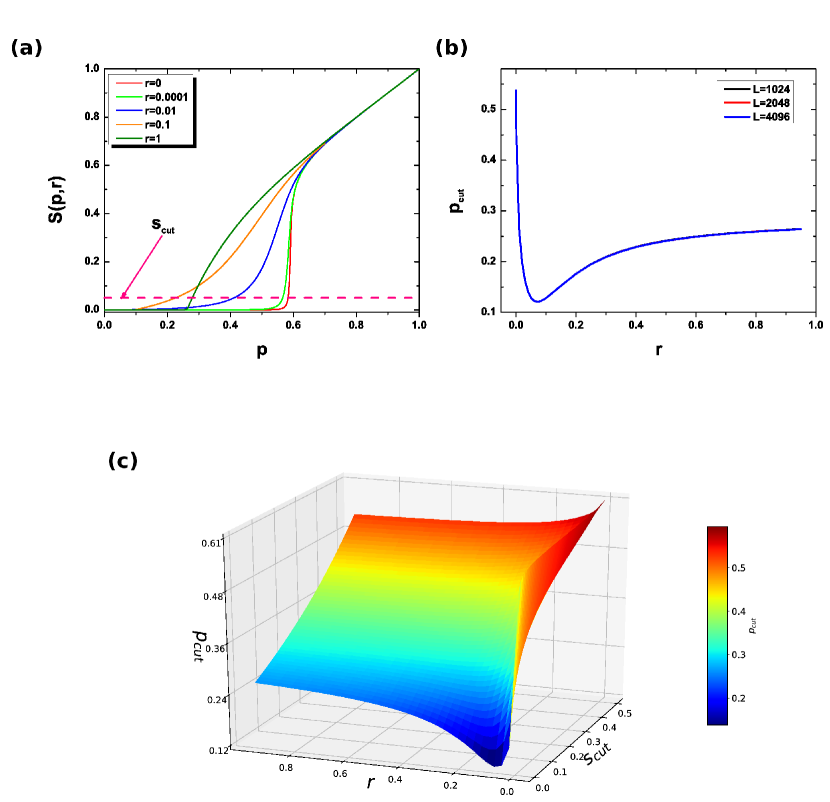
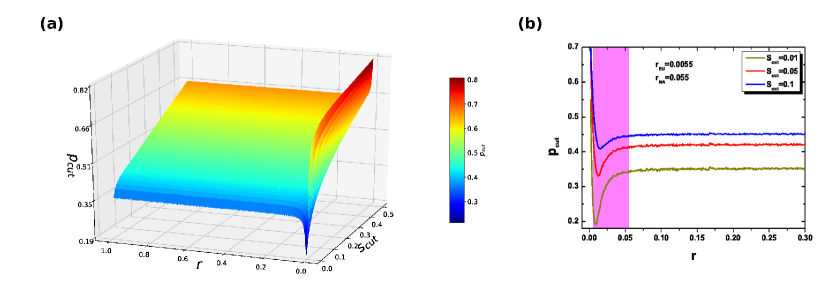
Fig. 5(a) presents how changes with and for a real network. These results are qualitatively similar to our model results [Fig. 4(c)]. We also observe that there exists an optimal value of in the real transportation network. Fig. 5(b) shows three specific cases with . We find that the optimal point is around . Suggesting that if of cities have intercontinental flights the system is optimally robust against random failures. For comparison, we also show in the figure the fraction of interconnected nodes in the real data: and . The lower and upper boundaries of the shadow in Fig. 5(b) are based on these two values.
Note that the number of interconnected links, , is kept constant when we change in our model, i.e, is proportional to . We also performed the same analysis to identify how the external field affects the resilience, i.e., the critical exponents and effective percolation threshold of the spatial and ER networks when is fixed and changes, according to . The results are presented and discussed in Supplemental Materials SI .
IV SUMMARY
We have developed a framework to study the resilience of coupled spatial networks where we show that the inter-links act analogously to an external field in a magnetic-paramagnetic system. Using percolation theory we studied the dynamical evolution of the giant component, and found the scaling relations governing the external field. We defined the critical exponents and using , and , which serve as analogues of the total magnetization, temperature and external field, respectively. The values of the critical exponents are universal and relate well with the known values previously obtained for standard percolation on a 2d lattice. Furthermore, we find that our scaling relations obey the Widom’s identity.
We next defined the effective percolation threshold to quantify the robustness of our model. We found that there exists an optimal amount of interconnected nodes, which is also predicted and observed in real-world networks. Our approach provides a new perspective on resilience of networks with community structure and gives insight on its interlinks response as an external field. Lastly, our model provides a method for optimizing real world interconnected infrastructure networks which could be implemented by practitioners in the field.
Acknowledgements
We acknowledge the Israel-Italian collaborative project NECST, the Israel Science Foundation, the Major Program of National Natural Science Foundation of China (Grants 71690242, 91546118), ONR, Japan Science Foundation, BSF-NSF, and DTRA (Grant no. HDTRA-1-10-1-0014) for financial support. This work was partially supported by National Natural Science Foundation of China (Grants 61403171, 71403105, 2015M581738 and 1501100B) and Key Research Program of Frontier Sciences, CAS, Grant No. QYZDJ-SSW-SYS019. J.F thanks the fellowship program funded by the Planning and Budgeting Committee of the Council for Higher Education of Israel.
References
- (1) Gao, J., Barzel, B. & Barabási, A.-L. Universal resilience patterns in complex networks. Nature 530, 307–312 (2016). URL http://www.nature.com/nature/journal/v530/n7590/abs/nature16948.html.
- (2) Cohen, R., Erez, K., ben Avraham, D. & Havlin, S. Resilience of the Internet to Random Breakdowns. Physical Review Letters 85, 4626–4628 (2000). URL http://link.aps.org/doi/10.1103/PhysRevLett.85.4626.
- (3) Albert, R., Jeong, H. & Barabási, A.-L. Error and attack tolerance of complex networks. Nature 406, 378 (2000).
- (4) Tanizawa, T., Paul, G., Cohen, R., Havlin, S. & Stanley, H. E. Optimization of network robustness to waves of targeted and random attacks. Physical Review E 71, 047101 (2005).
- (5) Buldyrev, S. V., Parshani, R., Paul, G., Stanley, H. E. & Havlin, S. Catastrophic cascade of failures in interdependent networks. Nature 464, 1025–1028 (2010). URL http://www.nature.com/nature/journal/v464/n7291/full/nature08932.html.
- (6) Leicht, E. A. & D’Souza, R. M. Percolation on interacting networks. arXiv:0907.0894 [cond-mat] (2009). URL http://arxiv.org/abs/0907.0894. ArXiv: 0907.0894.
- (7) Hu, Y., Ksherim, B., Cohen, R. & Havlin, S. Percolation in interdependent and interconnected networks: Abrupt change from second- to first-order transitions. Physical Review E 84, 066116 (2011). URL https://link.aps.org/doi/10.1103/PhysRevE.84.066116.
- (8) Gao, J., Buldyrev, S. V., Havlin, S. & Stanley, H. E. Robustness of a network of networks. Physical Review Letters 107, 195701 (2011).
- (9) Gao, J., Buldyrev, S. V., Stanley, H. E. & Havlin, S. Networks formed from interdependent networks. Nature Physics 8, 40–48 (2012). URL http://www.nature.com/nphys/journal/v8/n1/full/nphys2180.html.
- (10) Shekhtman, L. M., Shai, S. & Havlin, S. Resilience of networks formed of interdependent modular networks. New Journal of Physics 17, 123007 (2015).
- (11) Hackett, A., Cellai, D., Gómez, S., Arenas, A. & Gleeson, J. Bond Percolation on Multiplex Networks. Physical Review X 6, 021002 (2016). URL https://link.aps.org/doi/10.1103/PhysRevX.6.021002.
- (12) Solé-Ribalta, A., Gómez, S. & Arenas, A. Congestion Induced by the Structure of Multiplex Networks. Physical Review Letters 116, 108701 (2016). URL https://link.aps.org/doi/10.1103/PhysRevLett.116.108701.
- (13) Stauffer, D. & Aharony, A. Introduction to percolation theory (Taylor & Francis, 2003).
- (14) Bunde, A. & Havlin, S. Fractals and disordered systems (Springer Science & Business Media, 2012).
- (15) Saberi, A. A. Recent advances in percolation theory and its applications. Physics Reports 578, 1–32 (2015).
- (16) Li, D. et al. Percolation transition in dynamical traffic network with evolving critical bottlenecks. Proceedings of the National Academy of Sciences 112, 669–672 (2015).
- (17) Meng, J., Fan, J., Ashkenazy, Y. & Havlin, S. Percolation framework to describe El Nino conditions. Chaos: An Interdisciplinary Journal of Nonlinear Science 27, 035807 (2017). URL http://aip.scitation.org/doi/abs/10.1063/1.4975766.
- (18) Dong, G. et al. Resilience of networks with community structure behaves as if under an external field. Proceedings of the National Academy of Sciences in press (2018).
- (19) Weiss, D. J. et al. A global map of travel time to cities to assess inequalities in accessibility in 2015. Nature 553, 333–336 (2018). URL https://www.nature.com/articles/nature25181.
- (20) Strano, E. et al. The scaling structure of the global road network. Royal Society open science 4, 170590 (2017).
- (21) Hines, P., Blumsack, S., Sanchez, E. C. & Barrows, C. The topological and electrical structure of power grids. In System Sciences (HICSS), 2010 43rd Hawaii International Conference on, 1–10 (IEEE, 2010).
- (22) The global railway and airports data are from natural earth. http://www.naturalearthdata.com/. the airline routes data are from openflights. https://openflights.org/data.html .
- (23) Stanley, H. E. Phase transitions and critical phenomena (Clarendon, Oxford, 1971).
- (24) Reynolds, P., Stanley, H. & Klein, W. Ghost fields, pair connectedness, and scaling: exact results in one-dimensional percolation. Journal of Physics A: Mathematical and General 10, L203 (1977).
- (25) Shai, S. et al. Critical tipping point distinguishing two types of transitions in modular network structures. Physical Review E 92, 062805 (2015). URL https://link.aps.org/doi/10.1103/PhysRevE.92.062805.
- (26) Li, D., Qin, P., Wang, H., Liu, C. & Jiang, Y. Epidemics on interconnected lattices. EPL (Europhysics Letters) 105, 68004 (2014).
- (27) Shekhtman, L. M. et al. Critical field-exponents for secure message-passing in modular networks. New Journal of Physics 20, 053001 (2018). URL http://stacks.iop.org/1367-2630/20/i=5/a=053001.
- (28) Newman, M. E. J. & Ziff, R. M. Efficient Monte Carlo Algorithm and High-Precision Results for Percolation. Physical Review Letters 85, 4104–4107 (2000). URL https://link.aps.org/doi/10.1103/PhysRevLett.85.4104.
- (29) Supplementary materials .
- (30) Domb, C. Phase transitions and critical phenomena, vol. 19 (Academic press, 2000).
- (31) Margolina, A., Herrmann, H. J. & Stauffer, D. Size of largest and second largest cluster in random percolation. Physics Letters A 93, 73–75 (1982). URL http://www.sciencedirect.com/science/article/pii/0375960182902195.
- (32) Li, W., Bashan, A., Buldyrev, S. V., Stanley, H. E. & Havlin, S. Cascading Failures in Interdependent Lattice Networks: The Critical Role of the Length of Dependency Links. Physical Review Letters 108, 228702 (2012). URL https://link.aps.org/doi/10.1103/PhysRevLett.108.228702.
Supplemental Materials: Resilience of spatial networks with inter-links behaving as an external field
Jingfang Fan, Gaogao Dong, Louis M. Shekhtman, Dong Zhou, Jun Meng, Xiaosong Chen and Shlomo Havlin
Appendix A Further results
We present here some further results not given in the main text.
We consider two additional models with . For these models we randomly add inter-links between two lattice networks within a distance (i) [as shown in Fig. S2(a)] and (ii) [as shown in Fig. S2(b)], the definition of can refer in li_cascading_2012 . We repeat our analysis in these two new models and present the results in Fig. S3. We find that the critical exponents and are constant for these cases and do not change with and . However, the optimization phenomenon is absent in both new models in terms of the effective percolation threshold [in Fig. S4].
In addition, we also study the external field effect on two ER networks with a fixed . Distinct from our models, we find that the value of significantly influences the critical exponents: only for large are Eqs. (1) and (2) satisfied with the mean-field values , DongPNAS2018 [see Fig. S5]. The origin of such difference is that, for smaller , the external field is not strong enough to distinguish the percolation threshold for different [see Fig. S5(b)]. In contrast it is easy to distinguish the changes from varying with large [see the Fig. S5(a)].