Simple distance estimates for Gaia DR2 stars with radial velocities
††software: Matplotlib (Hunter, 2007)As noted by numerous authors since Strömberg (1927), the inverse of a measured parallax is a biassed estimate of the distance to a star, increasingly so as the relative uncertainty becomes larger. There are essentially three competing effects that one must consider: 1) the volume at distances between and increases like ; 2) the true spatial distribution of stars is not uniform; and 3) selection effects: the probability of a star at distance entering a catalogue varies with if there is any magnitude limit to the survey (because e.g., intrinsically faint stars become too faint to enter the catalogue). For a discussion see Luri et al. (2018).
Gaia DR2 contains radial velocities (and therefore full 3D velocities) for 7 million of its 1.7 billion sources (Gaia Collaboration et al., 2018; Katz et al., 2018). These stars are therefore of particular interest to people studying Milky Way dynamics. They are selected to have and , and the selection effect that applies for this subset of stars is quite different to that which applies to the complete Gaia sample.
We estimate the distance () to these stars using the Gaia parallax and magnitude (calculated from and using the approximation from Gaia Collaboration et al., 2018), and making the Bayesian estimate
where is the absolute magnitude in the band. We describe this distance pdf in terms of its expectation value and standard deviation. We assume that the uncertainty in is sufficiently small on the scale of the prior that it can be treated as a -function. Gaia DR2 parallaxes have a zero-point offset, and systematic uncertainties. We attempt to compensate for these by ‘correcting’ the parallax estimates for a zero-point of and adding an uncertainty of in quadrature with the quoted value. This reflects values found from the analysis of quasars by Lindegren et al. (2018, table 4).
The density model used to give the prior on position is the same as that used by McMillan et al. (2018, henceforth PM18), plus a bulge component taken from McMillan (2017), normalised to give the same bulge-to-disc mass ratio.

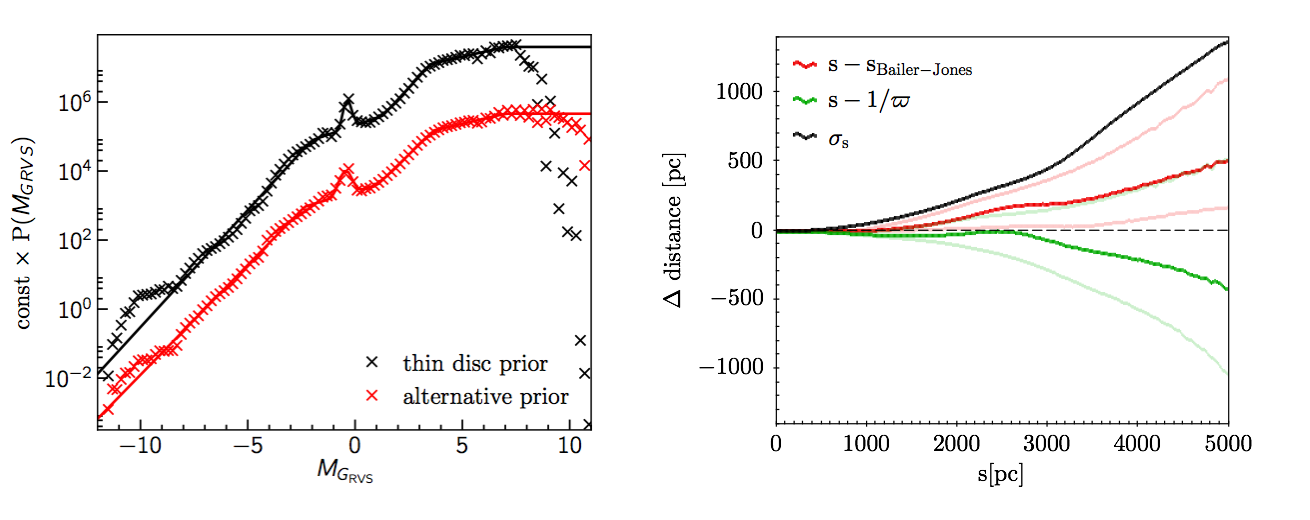
Our prior is an approximation to the distribution of one would expect for stars with , under sensible assumptions about the underlying population, following PM18. We assume that the population has the same IMF and age distribution as in the ‘Age’ prior used by PM18, and because most of these stars will belong to the thin disc, we take a thin-disc-like prior in metallicity ( is a Gaussian with mean and dispersion ). We model this with PARSEC isochrones (Marigo et al., 2017); the results are shown in Figure 1. Our prior is a piecewise linear fit to this in plus a Gaussian red clump component, also shown. Since we are not using colour information to derive the distances, this broad approximation is reasonable, though clearly more precise methods can be used for these data. We have explored the effect of using an alternative prior – derived from a simulated population with flat metallicity and age distributions (also shown in Figure 1). The effects are small, on average a distance increase of % with the flat prior to a distance of about , with the 1 differences being % at .
Bailer-Jones et al. (2018) used Gaia parallaxes, and a prior based on the expected distribution of all stars in the Gaia catalogue to derive distance estimates for 1.3 billion stars. Our study differs because it is specifically designed to apply only to the stars with published Gaia DR2 radial velocities, which means we use the magnitude as input (ensuring we consider the relevant selection effects for this sample). Figure 1 shows a comparison between our distances and those from Bailer-Jones et al.. Our estimates diverge at larger distances as the uncertainties become more significant. We note that, by accident of the selection function, the naïve estimate performs well as a distance estimate out to several – see Schönrich & Aumer (2017) for a similar result.
We note the important caveat that we have not considered dust extinction, though this is much less important than it would be if we had used colour information. The effects will be important in more extinguished regions.
Our code is available through https://github.com/PaulMcMillan-Astro/GaiaRVStarDistances (McMillan, 2018). The distance estimates can be found at http://www.astro.lu.se/~paul/GaiaDR2_RV_star_distance.csv.gz and archived at https://doi.org/10.5281/zenodo.1268353. They have already been used by Quillen et al. (2018) to study velocity substructure.
Acknowledgements
I am grateful to I. Carrillo and A. Quillen who encouraged publication. I am supported by the Swedish National Space Board, and the Swedish research council. This work has made use of data from the European Space Agency mission Gaia (https://www.cosmos.esa.int/gaia), processed by the Gaia Data Processing and Analysis Consortium (DPAC, https://www.cosmos.esa.int/web/gaia/dpac/consortium).
References
- Bailer-Jones et al. (2018) Bailer-Jones, C., et al. 2018 , arXiv:1804.10121.
- Gaia Collaboration et al. (2018) Gaia Collaboration et al. arXiv:1804.09365
- Hunter (2007) Hunter, J. 2007, Computing In Science & Engineering, 9, 3
- Katz et al. (2018) Katz, D. et al. 2018, arXiv:1804.09372.
- Lindegren et al. (2018) Lindegren L., et al., preprint, arXiv:1804.09366
- Luri et al. (2018) Luri, X. et al. 2018, arXiv:1804.09376.
- Marigo et al. (2017) Marigo, P. et al. 2017, ApJ, 835, 77.
- McMillan et al. (2018) McMillan, P. J. et al. 2018, MNRAS, 1016. [PM18]
- McMillan (2017) McMillan, P. 2017, MNRAS, 465, 76.
- McMillan (2018) McMillan, P. 2018, PaulMcMillan-Astro/GaiaRVStarDistances: Publication release, v0.1, Zenodo, doi:10.5281/zenodo.1270548
- Quillen et al. (2018) Quillen, A. et al. 2018, arXiv:1805.10236.
- Schönrich & Aumer (2017) Schönrich R., Aumer M., 2017, MNRAS, 472, 3979
- Strömberg (1927) Strömberg G., ApJ, 1927, 65, 238