The 2175 Å extinction feature in the optical afterglow spectrum of GRB 180325A at ††thanks: Based on observations made with the Nordic Optical Telescope, operated by the Nordic Optical Telescope Scientific Association at the Observatorio del Roque de los Muchachos, La Palma, Spain, of the Instituto de Astrofisica de Canarias. Based on observations collected at the European Organisation for Astronomical Research in the Southern Hemisphere under ESO programme 0100.D0649(A).
Abstract
The UV extinction feature at 2175 Å is ubiquitously observed in the Galaxy but is rarely detected at high redshifts. Here we report the spectroscopic detection of the 2175 Å bump on the sightline to the -ray burst (GRB) afterglow GRB 180325A at , the only unambiguous detection over the past ten years of GRB follow-up, at four different epochs with the Nordic Optical Telescope (NOT) and the Very Large Telescope (VLT)/X-shooter. Additional photometric observations of the afterglow are obtained with the Gamma-Ray burst Optical and Near-Infrared Detector (GROND). We construct the near-infrared to X-ray spectral energy distributions (SEDs) at four spectroscopic epochs. The SEDs are well-described by a single power-law and an extinction law with , , and the 2175 Å extinction feature. The bump strength and extinction curve are shallower than the average Galactic extinction curve. We determine a metallicity of [Zn/H] from the VLT/X-shooter spectrum. We detect strong neutral carbon associated with the GRB with equivalent width of . We also detect optical emission lines from the host galaxy. Based on the H emission line flux, the derived dust-corrected star-formation rate is M⊙yr-1 and the predicted stellar mass is log M∗/M, suggesting the host galaxy is amongst the main-sequence star-forming galaxies.
1 Introduction
Dust plays an important role in the formation and evolution of galaxies. Extinction curves as a function of wavelength provide information on dust grain sizes and compositions (Draine, 2003). Long-duration -ray bursts (GRBs) are powerful probes to study absolute extinction curves of distant star-forming galaxies because of their bright afterglow emission, simple spectral shape (Sari et al., 1998), association with short-lived massive stars (e.g., Cano et al., 2017), and location in star-forming regions (e.g., Fynbo et al., 2000; Starling et al., 2011). Broadband spectroscopy of GRB afterglows allows us to study individual line-of-sight absolute extinction curves (Zafar et al., 2011, 2018), and provides information about chemical abundances (Cucchiara et al., 2015) and gas kinematics (Arabsalmani et al., 2015) in their host galaxies.
A characteristic feature in the Milky Way (MW) extinction curve is an absorption bump centered at 2175 Å, first discovered by Stecher (1965). The feature is ubiquitously seen in MW extinction curves (Fitzpatrick & Massa, 2007). The bump strength drops in the interstellar extinction curves of the Large Magellanic Cloud (LMC; Gordon et al. 2003) and is only seen in a few sightlines towards the Small Magellanic Cloud (SMC; Gordon et al. 2003; Maíz Apellániz & Rubio 2012). The exact origin of the feature is still unclear, although some candidates, such as non-graphitic carbon (Mathis, 1994) or polycyclic aromatic hydrocarbons (PAHs; Draine 2003) have been proposed. The reduction in extinction bump strength for different environments is attributed to low metallicities (Fitzpatrick, 2004) or different radiative environments (Mattsson et al., 2008).
Beyond the local Universe, the 2175 Å extinction feature becomes very uncommon (e.g., Zeimann et al., 2015; Reddy et al., 2018). At , the extinction bump has been detected in the Great Observatories Origins Deep Survey (GOODS)-Herschel field galaxies (Buat et al., 2011). A sample of massive star-forming galaxies at 2 indicates 2175 Å bumps in their spectra (Noll et al., 2007). Weaker bumps for active galaxies have been found from the SEDs of galaxies (Kriek & Conroy, 2013). In a sample of COSMOS galaxies, a 2175 Å bump is reported based on photometry (Scoville et al., 2015). The extinction feature is also detected in several metal-line absorbing systems towards quasar sightlines (e.g., Jiang et al., 2011; Ma et al., 2018). In GRBs, a significant spectroscopic 2175 Å bump has been confirmed only in four GRBs (GRB 070802: Krühler et al. 2008; Elíasdóttir et al. 2009, GRB 080607: Prochaska et al. 2009; Perley et al. 2011, GRB 080605 and GRB 080805: Zafar et al. 2012). The peculiar extinction curve towards GRB 140506A does not seem to be caused by an extreme version of the 2175 Å extinction feature, but a different phenomenon, the nature of which remains unknown (Fynbo et al., 2014; Heintz et al., 2017). In general, by studying a -ray flux limited sample, Covino et al. (2013) found that the 2175 Å feature is required in at least % of cases to account for the broadband photometric afterglow SED.
Here, we report another significant spectroscopic detection of a 2175 Å bump, discovered in the optical spectrum of GRB 180325A, nearly a decade since the last reported unambiguous examples. This dearth is despite the powerful current generation of instruments, in particular, the Very Large Telescope (VLT)/X-shooter (Vernet et al., 2011). The VLT/X-shooter enables near-infrared (NIR) to the ultraviolet (UV) observations in one-shot and is ideally suited to discover such a feature. The Letter is organized as follows: In §2 we describe multi-wavelength observations of the GRB 180325A afterglow carried out with different instruments. In §3 we present our spectral energy distribution (SED) and optical spectrum analysis results. A discussion is provided in §4 and conclusions in §5.
2 Observations and SED construction
At 01:53:02 UT on 2018 March 25, the Neil Gehrels Swift Observatory detected GRB 180325A with its Burst Alert Telescope (BAT) and its X-Ray Telescope (XRT) began observations at 01:54:16.2 UT. At 6 minutes after the burst trigger, the Nordic Optical Telescope (NOT) equipped with the Andalucia Faint Object Spectrograph and Camera (AlFOSC) observed the GRB in the -band. A sequence of sec spectra with a mean time of 2:26 UT using a wide slit and grism 4 (with spectral coverage from 3800–9200 Å and resolution ) were obtained with AlFOSC. A strong 2175 Å bump was immediately obvious (Heintz et al., 2018). Another AlFOSC 2000 sec spectrum was taken with grism 20 (with spectral coverage from 6000–9200 Å and ) using a slit.
The Gamma-Ray burst Optical and Near-Infrared Detector (GROND) mounted at the 2.2-m Max Planck Gesellschaft (MPG) telescope started taking photometric observations of the afterglow in all seven ( and ) bands at 1.05 hrs after the burst. The complete log of GROND, NOT and VLT/X-shooter photometric observations is provided in Table 1. The AB magnitudes provided in Table 1 are not corrected for Galactic extinction. From the photometry we construct multiband optical/NIR lightcurves. The temporal behaviour of the -band lightcurve (between 0.3–8.3 hrs) follows a broken power-law with a break at ks and decay slopes and following the convention where . The lightcurves of all other bands follow a consistent behaviour.
We subsequently observed GRB 180325A at 1.84 hours after trigger with the VLT/X-shooter spectrograph. VLT/X-shooter data were obtained as part of the Stargate VLT proposal (Program ID: 0100.D0649(A)) and the spectra were reduced following the approach outlined in Selsing et al. (2018). The VLT/X-shooter spectrograph covers the spectral wavelength range from 3000–24,800 Å, divided into three spectroscopic arms. The spectroscopic sequence consisted of 2 epochs of sec exposure each and were observed following an ABBA nodding pattern. The slits were aligned with the parallactic angle, and used slit widths are , and for the UVB, VIS and NIR arm, respectively. This corresponds to a spectral resolution of 5,400 (UVB), 8,900 (VIS), and 5,600 (NIR). The spectra were taken under good conditions with a median seeing of at 6700 Å and at airmass ranging from 1.52–1.75. Throughout the paper, the wavelengths are reported in vacuum and are shifted to the heliocentric velocity. All optical data were corrected for a Galactic extinction of mag using the dust maps of Schlafly & Finkbeiner (2011). As it is only a small correction, the uncertainty due to the Galactic extinction correction is negligible. All four, NOT and VLT/X-shooter, spectra in the extinction bump region are shown in Fig. 1. The central redshift obtained from metal lines in the VLT/X-shooter spectrum is and the derived H i column density is log N(H i/cm-2) (see Fig. 1 inset). The spectrum also shows the presence of a strong intervening system at .
| Facility-filter-band | Time since trigger | Exposure time | Observed magnitude |
|---|---|---|---|
| sec | sec | AB (mag) | |
| NOT- | 568.2 | 100.0 | |
| NOT- | 3091.2 | 100.0 | |
| GROND- | 3791.114 | 184.9 | |
| GROND- | 3791.114 | 184.9 | |
| GROND- | 3791.114 | 184.9 |

The X-ray spectra and lightcurves were extracted in the 0.3–10 keV range following the method of Evans et al. (2009). The entire XRT photon counting (PC)-mode dataset does not show strong spectral variations, thus justifying a fit with a single power-law. The best-fit is with a photon index and host galaxy equivalent neutral hydrogen column density, cm-2 where the Galactic H i column density is set to cm-2 and Galactic molecular H2 column density to cm-2 using the tool111http://www.swift.ac.uk/analysis/nhtot/ following the method of Willingale et al. (2013). We construct four XRT spectra around the SED epochs for the SED fitting (see §3). These four spectra are normalized to the photometric SED mid-points by considering the photon-weighted mean times and using the light curve decay power-law () fit. The XRT data show no evidence of spectral evolution around the four spectra so the lightcurve hardness-ratio does not deviate from the mean.
3 Results
3.1 SED fitting and extinction curve
We followed the SED fitting method described in Zafar et al. (2018). We used the spectral fitting package XSPEC (v12.9; Arnaud 1996) to fit the multi-epoch restframe NIR to X-ray SEDs of GRB 180325A. The SEDs were modelled with a single or broken power-law plus Fitzpatrick & Massa (1990) parametric extinction law and soft X-ray absorption. We refer the reader to Zafar et al. (2018) for a more detailed description of the model. Briefly, the Fitzpatrick & Massa (1990) dust law consists of: a UV linear component given as (intercept) and (slope) with defining the far-UV curvature and a Drude component specifying the 2175 Å extinction feature by (bump strength), (central wavelength), and (bump width) parameters. The total Galactic equivalent neutral hydrogen column density () was fixed to the values obtained from Willingale et al. (2013), cm-2. The soft X-ray absorption, , is left as a free parameter and modeled with ztbabs.
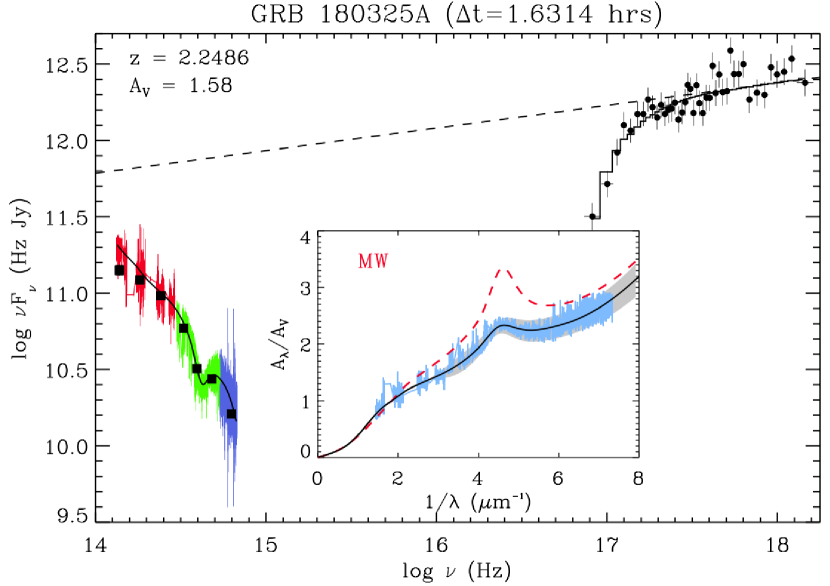
Except for the case of GRB 080605 (two epochs; Zafar et al. 2012), the 2175 Å bump for GRB afterglows has not been spectroscopically observed at more than one epoch in any case. We here for the first time spectroscopically observed the extinction bump at four epochs. We used GROND photometric data and lightcurves (only for first epoch) to construct the X-ray to NIR SEDs around all four spectroscopic epochs. The X-ray data and optical spectra are scaled to the photometric mid-points. For X-shooter SEDs, the GROND data is only used for the normalization of spectra where difference is usually . For NOT SEDs, the GROND data outside the spectral coverage is incorporated in the SED fitting. We find that the SEDs at all epochs are fit well with a single power-law and a 2175 Å extinction curve (see, however, notes in Table 2). We also tested if bump is related to the intervening absorber at and find no evidence. The SED and extinction curve at t hrs are shown in Fig. 2. The best-fit results of the SEDs are reported in Table 2. We find that for all four epochs, the extinction curve parameters are consistent, particularly the total-to-selective extinction () and the total extinction at -band () are consistent within 1.
| SED | t | /dof | NHP% | ||||||||||
|---|---|---|---|---|---|---|---|---|---|---|---|---|---|
| hrs | 1022 cm-2 | m | m2 | m-1 | m-1 | mag | |||||||
| NOTXRT222Note that the spectrum and early photometry are affected by the host contribution. The XRT and multiband photometric data are also not available at that time and SED is generated from lightcurves extrapolation. The lightcurves show signs of evolution, therefore, results should not be considered reliable. | 0.5833 | 0.59 | 1.00/881 | 51 | |||||||||
| NOTXRT | 1.1953 | 0.61 | 0.96/887 | 78 | |||||||||
| XSHXRT | 1.6314 | 0.70 | 0.85 | 0.96/33572 | 100 | ||||||||
| XSHXRT | 2.9866 | 1.20 | 0.89 | 0.99/33291 | 90 |
Note. — Table 1 is published in its entirety in the machine-readable format. A portion is shown here for guidance regarding its format and content.
3.2 Metal absorption lines
Through a Ly voigt profile fit we derive a column density of log N(H i/cm-2) for atomic neutral hydrogen along the GRB sightline. To measure the gas-phase metallicity of the host galaxy, we fit multi-component Voigt profiles to the low-ionization metal lines in the spectrum using VoigtFit (Krogager, 2018). We show the best-fit Voigt profiles in Fig. 3 to some of these metal lines. The derived column densities and abundances are reported in Table 3 where solar photospheric abundances from Asplund et al. (2009) are assumed. The metal lines are all heavily saturated (except for Cr ii and C i), therefore, we report those abundances as lower limits. Note that Cr is depleted onto dust, and therefore its abundance is not indicator of the true metallicity. Using the column density of Zn, we derive a lower limit of for the metallicity of the host galaxy. We also use the low-ionization lines and measure an upper limit of km s-1 for the velocity width of neutral gas in the host galaxy.

| Elemental | Component 1 | Component 2 | Component 3 | Total | Metallicity |
|---|---|---|---|---|---|
| transition | log (cm-2) | log (cm-2) | log (cm-2) | log (cm-2) | [M/H] |
| km s-1 | km s-1 | ||||
| H i | |||||
| Fe ii | : | : | : | ||
| Mn ii | |||||
| Zn ii | |||||
| Si ii | : | : | : | ||
| Cr ii |
3.3 Neutral Carbon
Observationally the presence of a 2175 Å extinction feature is found to be correlated with the detection of neutral atomic carbon (Zafar et al., 2012; Ledoux et al., 2015; Ma et al., 2018) and/or molecules. This is consistent with a link between carbonaceous grain growth and the extinction bump (Henning & Salama, 1998). For a sample of quasar absorbers, Ledoux et al. (2015) found that 30% of the C i absorbers show a 2175 Å bump. Recently Ma et al. (2018) found that all quasar absorbers with C i column densities above 1014 cm-2 show a detectable bump feature in their SEDs. Based on a small sample, Zafar et al. (2012) reported a trend between C i equivalent widths and bump strengths. In the afterglow spectrum of GRB 180325A, we detect strong C i absorption lines with rest-frame equivalent widths of and . Comparing (C i) and the area of the bump (; at the 1.6314 hrs epoch it is ), the present burst follows the trend presented in Ma et al. (2018).
3.4 Host galaxy properties
In the VLT/X-shooter NIR spectrum, we clearly detect H and [O iii] emission lines from the GRB host galaxy. We measure line fluxes of erg s-2 cm-1Å-1 and erg s-2 cm-1Å-1 for these bright emission lines. The H line flux corresponds to a star-formation rate (SFR) of M⊙yr-1, based on the calibration from Kennicutt (1998), and without correcting for dust extinction. Correcting for SED-derived dust extinction (), the host galaxy SFR is M⊙yr-1. We measure a Full-Width-Half-Maximum (FWHM) of km s-1 for the H line. Using the correlation between stellar mass and velocity width of the H line derived for GRB host galaxies in Arabsalmani et al. (2018), we estimate a stellar mass of for the host galaxy of GRB 180325A. The estimated stellar mass and SFR place the host galaxy amongst the main-sequence star-forming galaxies with similar redshifts, though towards higher SFRs on the envelope of the main-sequence SFR- relation (see Fig. 1 of Rodighiero et al., 2011). A larger specific SFRs (SFR per unit mass) than average is shown to be typical of GRB host galaxies (see Arabsalmani et al., 2018, and references therein).
4 Discussion
We compared , , area of the bump (), and maximum height () of GRB 180325A with other unambiguously detected GRB cases (GRB 070802 and GRB 080607: Zafar et al. 2011, GRB 080605 and GRB 080805: Zafar et al. 2012). Based on the 1.6314 hrs SED results, we find this burst has wider bump area (), height (), and than all known GRB cases but has a lower dust content when compared to GRB 080607 (; Zafar et al. 2011). However, the GRB 180325A bump area and height are still not as prominent as the mean MW ( and ; Fitzpatrick & Massa, 2007) and LMC average ( and ; Gordon et al., 2003) bump. The extinction curve of GRB 180325A appears to be shallower than the mean MW (Fitzpatrick & Massa, 2007) and average LMC (Gordon et al., 2003) curves.
Diffuse interstellar bands (DIBs) are a ubiquitous phenomenon in Galactic sightlines, and have been detected in a limited number of extragalactic sightlines (Magellanic Clouds, supernovae, quasar absorbers). Remarkably, the one SMC sightline that exhibits normal strength DIBs includes a 2175 Å feature (Cox et al., 2007). The DIB carriers likely are large carbon-bearing molecules; C has been proposed as the carrier of two (out of about 400) DIBs at 9577 and 9632 Å (Campbell et al., 2015). The measured (anomalous) extinction in GRB 180325A, and the presence of the 2175 Å feature, motivates the search for the presence of the strongest DIBs in its VLT/X-shooter spectrum. Several of them happen to be redshifted into the opaque regions in between the NIR windows, therefore, we cannot find a significant detection.
The presence of CO and H2 molecules is usually correlated with the UV bump (e.g., Prochaska et al., 2009; Ledoux et al., 2015). The spectrum blueward of Ly is strongly suppressed and due to low signal-to-noise around the blue end of spectrum, there is no clear detection of H2 molecules. Neutral chlorine could also be used as a tracer of H2 (Balashev et al., 2015). The afterglow spectrum of GRB 180325A has relatively low signal-to-noise in the Cl i (1347 Å) region. The derived 3 limit of log N(Cl i/cm-2) suggests log N(H2/cm-2) based of correlation presented in Balashev et al. (2015). We also find no convincing detection of CO molecular lines because of low signal-to-noise and partly the spectral regions are blended with the strong intervening system at .
5 Conclusions
We here report the detection of a 2175 Å extinction bump in the spectrum of GRB 180325A afterglow at , the only unambiguous detection over the past decade. For the first time, the extinction bump was spectroscopically observed at four different epochs twice with the NOT/AlFOSC and twice with the VLT/X-shooter. We constructed the X-ray lightcurve from Swift-XRT and optical/NIR photometric lightcurves from GROND, NOT, and VLT/X-shooter. Using these multiband data, we generated SEDs at all four spectroscopic epochs. The SEDs fit well with a single power-law and a 2175 Å extinction bump with , . The bump and extinction curve of GRB 180325A are shallower than the mean MW and LMC law. The derived metallicity of GRB is [Zn/H]. The VLT/X-shooter spectrum exhibits neutral carbon at the GRB redshift, suggesting strong C i is required to yield a 2175 Å bump. The dust-corrected SFR from the H emission-line flux is M⊙yr-1 and the predicted stellar mass is log M∗/M which is representative for long-duration GRB hosts.
References
- Arabsalmani et al. (2015) Arabsalmani, M., Møller, P., Fynbo, J. P. U., et al. 2015, MNRAS, 446, 990
- Arabsalmani et al. (2018) Arabsalmani, M., Møller, P., Perley, D. A., et al. 2018, MNRAS, 473, 3312
- Arnaud (1996) Arnaud, K. A. 1996, in Astronomical Society of the Pacific Conference Series, Vol. 101, Astronomical Data Analysis Software and Systems V, ed. G. H. Jacoby & J. Barnes, 17
- Asplund et al. (2009) Asplund, M., Grevesse, N., Sauval, A. J., & Scott, P. 2009, ARA&A, 47, 481
- Balashev et al. (2015) Balashev, S. A., Noterdaeme, P., Klimenko, V. V., et al. 2015, A&A, 575, L8
- Buat et al. (2011) Buat, V., Giovannoli, E., Heinis, S., et al. 2011, A&A, 533, A93
- Campbell et al. (2015) Campbell, E. K., Holz, M., Gerlich, D., & Maier, J. P. 2015, Nature, 523, 322
- Cano et al. (2017) Cano, Z., Wang, S.-Q., Dai, Z.-G., & Wu, X.-F. 2017, Advances in Astronomy, 2017, 8929054
- Covino et al. (2013) Covino, S., Melandri, A., Salvaterra, R., et al. 2013, MNRAS, 432, 1231
- Cox et al. (2007) Cox, N. L. J., Cordiner, M. A., Ehrenfreund, P., et al. 2007, A&A, 470, 941
- Cucchiara et al. (2015) Cucchiara, A., Fumagalli, M., Rafelski, M., et al. 2015, ApJ, 804, 51
- Draine (2003) Draine, B. T. 2003, ARA&A, 41, 241
- Elíasdóttir et al. (2009) Elíasdóttir, Á., Fynbo, J. P. U., Hjorth, J., et al. 2009, ApJ, 697, 1725
- Evans et al. (2009) Evans, P. A., Beardmore, A. P., Page, K. L., et al. 2009, MNRAS, 397, 1177
- Fitzpatrick (2004) Fitzpatrick, E. L. 2004, in Astronomical Society of the Pacific Conference Series, Vol. 309, Astrophysics of Dust, ed. A. N. Witt, G. C. Clayton, & B. T. Draine, 33
- Fitzpatrick & Massa (1990) Fitzpatrick, E. L., & Massa, D. 1990, ApJS, 72, 163
- Fitzpatrick & Massa (2007) —. 2007, ApJ, 663, 320
- Fynbo et al. (2014) Fynbo, J. P. U., Krühler, T., Leighly, K., et al. 2014, A&A, 572, A12
- Fynbo et al. (2000) Fynbo, J. U., Holland, S., Andersen, M. I., et al. 2000, ApJ, 542, L89
- Gordon et al. (2003) Gordon, K. D., Clayton, G. C., Misselt, K. A., Landolt, A. U., & Wolff, M. J. 2003, ApJ, 594, 279
- Heintz et al. (2018) Heintz, K. E., Fynbo, J. P. U., & Malesani, D. 2018, GRB Coordinates Network, Circular Service, No., 22535
- Heintz et al. (2017) Heintz, K. E., Fynbo, J. P. U., Jakobsson, P., et al. 2017, A&A, 601, A83
- Henning & Salama (1998) Henning, T., & Salama, F. 1998, Science, 282, 2204
- Jiang et al. (2011) Jiang, P., Ge, J., Zhou, H., Wang, J., & Wang, T. 2011, ApJ, 732, 110
- Kennicutt (1998) Kennicutt, Jr., R. C. 1998, ARA&A, 36, 189
- Kriek & Conroy (2013) Kriek, M., & Conroy, C. 2013, ApJ, 775, L16
- Krogager (2018) Krogager, J.-K. 2018, ArXiv e-prints, arXiv:1803.01187
- Krühler et al. (2008) Krühler, T., Küpcü Yoldaş, A., Greiner, J., et al. 2008, ApJ, 685, 376
- Ledoux et al. (2015) Ledoux, C., Noterdaeme, P., Petitjean, P., & Srianand, R. 2015, A&A, 580, A8
- Ma et al. (2018) Ma, J., Ge, J., Prochaska, J. X., et al. 2018, MNRAS, 474, 4870
- Maíz Apellániz & Rubio (2012) Maíz Apellániz, J., & Rubio, M. 2012, A&A, 541, A54
- Mathis (1994) Mathis, J. S. 1994, ApJ, 422, 176
- Mattsson et al. (2008) Mattsson, L., Wahlin, R., Höfner, S., & Eriksson, K. 2008, A&A, 484, L5
- Noll et al. (2007) Noll, S., Pierini, D., Pannella, M., & Savaglio, S. 2007, A&A, 472, 455
- Perley et al. (2011) Perley, D. A., Morgan, A. N., Updike, A., et al. 2011, AJ, 141, 36
- Prochaska et al. (2009) Prochaska, J. X., Sheffer, Y., Perley, D. A., et al. 2009, ApJ, 691, L27
- Reddy et al. (2018) Reddy, N. A., Oesch, P. A., Bouwens, R. J., et al. 2018, ApJ, 853, 56
- Rodighiero et al. (2011) Rodighiero, G., Daddi, E., Baronchelli, I., et al. 2011, ApJ, 739, L40
- Sari et al. (1998) Sari, R., Piran, T., & Narayan, R. 1998, ApJ, 497, L17
- Schlafly & Finkbeiner (2011) Schlafly, E. F., & Finkbeiner, D. P. 2011, ApJ, 737, 103
- Scoville et al. (2015) Scoville, N., Faisst, A., Capak, P., et al. 2015, ApJ, 800, 108
- Selsing et al. (2018) Selsing, J., Malesani, D., Goldoni, P., et al. 2018, arXiv:1802.07727, arXiv:1802.07727
- Starling et al. (2011) Starling, R. L. C., Wiersema, K., Levan, A. J., et al. 2011, MNRAS, 411, 2792
- Stecher (1965) Stecher, T. P. 1965, ApJ, 142, 1683
- Vernet et al. (2011) Vernet, J., Dekker, H., D’Odorico, S., et al. 2011, A&A, 536, A105
- Willingale et al. (2013) Willingale, R., Starling, R. L. C., Beardmore, A. P., Tanvir, N. R., & O’Brien, P. T. 2013, MNRAS, 431, 394
- Zafar et al. (2011) Zafar, T., Watson, D., Fynbo, J. P. U., et al. 2011, A&A, 532, A143
- Zafar et al. (2012) Zafar, T., Watson, D., Elíasdóttir, Á., et al. 2012, ApJ, 753, 82
- Zafar et al. (2018) Zafar, T., Watson, D., Møller, P., et al. 2018, arXiv:1805.07016
- Zeimann et al. (2015) Zeimann, G. R., Ciardullo, R., Gronwall, C., et al. 2015, ApJ, 814, 162