The Multifrequency Behavior of Sagittarius A*
Abstract:
The Galactic Center is the closest galactic nucleus that allows us to determine the multi-frequency behavior of the supermassive black hole counterpart Sagittarius A* in great detail. We put SgrA*, as a nucleus with weak activity, into the context of nearby low luminosity nuclei. Possible hints for galaxy evolution of these sources across the [NII]-based diagnostic diagram can be inferred from dependencies on the masses, excitation ratios, and radio luminosities within this diagram. For SgrA* we also discuss responsible radiation mechanisms covering results from the radio, infrared, and X-ray regime. We also address the question of justifying the hot-spot model for describing flare profiles in light curves. Since the brightness of LLAGN is also linked to star formation we briefly discuss the possibility of having stars formed in the immediate vicinity of supermassive black holes and possibly even in a mildly relativistic environment.
1 Introduction
Sagittarius A* (SgrA*) is located at the Galactic Center of the Milky Way. It has been identified with an extremely underluminous, supermassive black hole (SMBH) with a mass of 4 million solar masses and a quiescent bolometric luminosity of about 1036 erg s-1. This is about eight orders of magnitude lower than the corresponding Eddington luminosity expected for such a black hole (Narayan et al. 1998; Ghez et al. 2008, Eckart et al. 2017). It can, however, not be excluded that SgrA* has been much brighter in the past, e.g., about 400 years ago (Revnivtsev Sunyaev & Churazov 1998; Terrier et al. 2010, Witzel et al. 2012). SgrA* is the closest SMBH and therefore an ideal laboratory to study accretion and associated emission processes of SMBH systems (e.g. Falcke & Markoff 2013). As the origin of these flares two types of models are discussed: electron acceleration processes (Markoff et al. 2001; Liu et al. 2004; Yuan et al. 2004) and transient accretion flows (e.g. Yusef-Zadeh et al. 2006ab, 2009; Eckart et al. 2006; Trap et al. 2011). The emission mechanism is likely dominated by synchrotron and synchrotron self-Compton processes. The exact importance of these processes is still under discussion.
Simultaneous multi-wavelength campaigns suggest that for the bright flares the radio, sub-mm, NIR and X-ray flare emission is correlated. In this picture sub-mm flares follow concurrent NIR and X-ray out-bursts with time delays that depend on the observing frequencies below the sub-mm turnover frequency (Marrone et al. 2008; Trap et al. 2011; Eckart et al. 2012). These delays are probably governed by adiabatic expansion of clouds of relativistic electrons (Subroweit et al. 2017, Yusef-Zadeh et al. 2006ab, 2008 Eckart et al. 2012, 2009; Marrone et al. 2008; van der Laan 1966). Flare emission of up to a few hours duration is due to non-thermal processes and can be studied from the radio to the X-ray domain (see references in e.g. Mossoux et al. 2016, Eckart et al. 2017). The quiescent X-ray emission is due to a thermal plasma extending out to the Bondi radius (about 105 gravitational radii; e.g. Quataert 2002, Baganoff et al. 2001)
In the following we will discuss aspects of the multi-frequency behavior of SgrA* covering results from the radio, infrared, and X-ray regime. We will first compare SgrA*, as a weakly active nucleus, to nearby low luminosity nuclei (LLAGN) and discuss possible hints for galaxy evolution of these LLAGN sources across the [NII]-based diagnostic diagram. Since the brightness of LLAGN is also linked to starformation we briefly discuss the possibility of having stars formed in the immediate vicinity of supermassive black holes. Specifically for SgrA* we also address the question of justifying the hot-spot model for describing flare profiles in light curves.
2 SgrA* as a Galactic Nucleus
The presence of an Active Galactic Nucleus (AGN) or at least a supermassive black hole at the center of a galaxy is a wide spread phenomenon. As the Galactic Center provides highest angular resolution information of a galactic nucleus it is important to compare the source to other nuclei and to compare the different states of activities in these galactic cores.
2.1 Low-luminosity AGN and normal galaxies
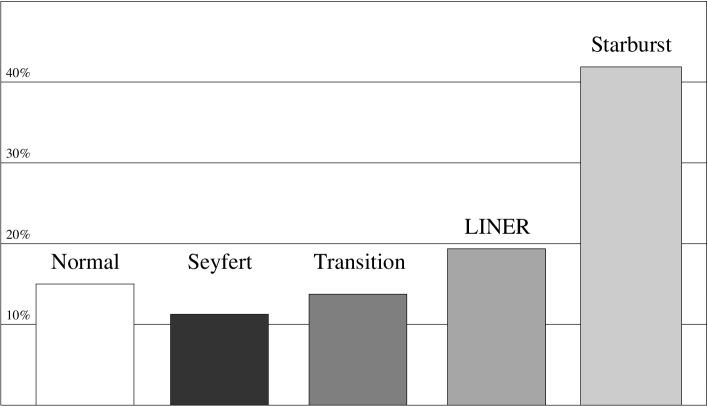
Low-luminosity AGN with L ergs s-1 are found much more frequently than ordinary AGN. Therefore they may be more representative and also relevant to our understanding of the AGN phenomenon and the interplay between active nuclei and their host galaxies. Many normal galaxies are hosting LINER nuclei, starburst nuclei, or in general LLAGN (Low Luminosity AGN). Hence, they form the class of low-activity galaxies. These sources have rather similar X-ray characteristics, despite their apparently different optical classifications. This fact may be taken as an indication for a connection between starburst activity and AGN activity. Following Ptak (2001) and Ho, Filippenko, & Sargent (1997) the demographics of activity in nearby galaxies is shown in Fig. 2.
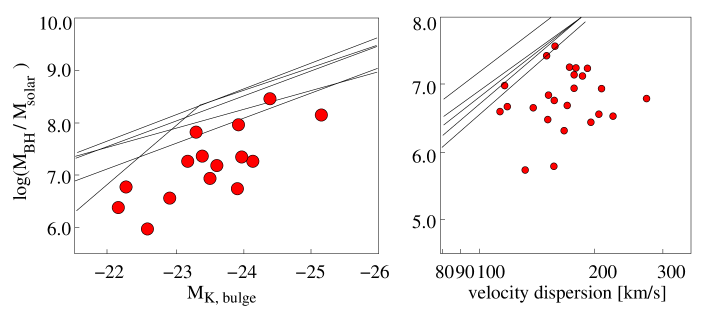
The activity of the very compact active nucleus is most likely due to accretion onto a supermassive black hole. Tight correlations between the BH mass and host galaxy properties, particularly in early-type galaxies, are interpreted as signs for a co-evolution (see Kormendy & Ho, 2013, for a review). There are, however, indications that the supermassive BH in LLAGN do not necessarily fall on the “standard” BH mass correlations for classical bulges and ellipticals (see below). Koliopanos et al. (2017) find that all LLAGN in their list have low-mass central black holes with on average. They find that low surface-brightness AGN tend to have BH masses below the standard relations for spirals and ellipticals. Subramanian et al. (2016) investigate AGN black hole masses and the relation for low surface-brightness galaxies. They compare them to existing relations and find that they are mostly located in the low- regime and below existing relations of inactive galaxies, which could indicate that they are not in co-evolution with their host galaxies (see Fig. 3, right). In Busch et al. (2016a), we determined BH masses for 16 AGN taken from the low-luminosity type-1 QSO sample of the 99 closest () QSOs from the Hamburg/ESO survey for bright UV-excess QSOs. The sources show an offset from the classical relations (see Fig. 3, left). But they show signs of nuclear star formation activity (Busch et al., 2015), which suggests that this offset may be due to an over-luminosity of the bulges. A further analysis promises important insight in the evolution scenarios of supermassive black holes and their surrounding host galaxies (Busch 2016b).
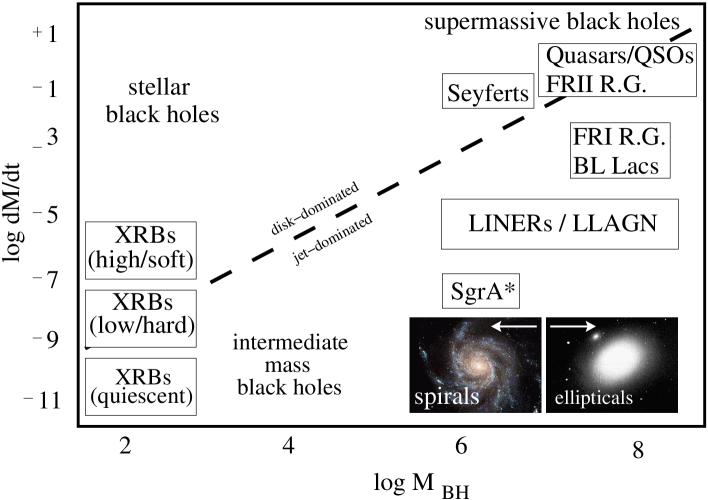
Falcke, Körding & Markoff (2004) use a scheme of an accretion rate-dependent transition between states to explore the evolution in power and the presence of jets for stellar to supermassive black holes (see Fig. 3). For black hole systems that accrete near the Eddington rate the emission will be dominated by the accretion disk. As a common feature the assumption is that below a critical accretion rate value the radiation and accretion mode becomes optically thin as well as radiatively inefficient. If that is the case, the emission of these sub-Eddington systems will be dominated by synchrotron emission from a relativistic jet. These sub-Eddington systems can be found for all black hole masses. Amongst them is the Galactic Center (SgrA*), but also low-ionization nuclear emission-line region galaxies (LINERs; Heckman 1980ab), Fanaroff Riley type I (FR I) galaxies, and BL Lacertae (BL Lac) objects. There also appear to exist scaling relations between stellar (e.g. in X-ray binaries) and supermassive black hole systems. Falcke, Körding & Markoff (2004) place black holes of all masses into a scheme that depends mainly on the black hole mass, the accretion rate, as well as the relative importance of disk and jet structures.
2.2 Hints for evolution
It is currently unclear what role (if any at all) active galactic nuclei (AGN) play with respect to galaxy evolution. Without doubt there is a connection between the central black holes and the bulges in which they are found. In addition to density dependent stellar dynamical effects (like collisional interaction between stars and core collapses of dense stellar systems) AGN feedback is one of the most promising candidates to connect the AGN with the host galaxy, the ISM, and star formation processes that are taking place in these galaxies. However, these influences may also be connected to or covered up by galaxy-galaxy interactions like harassment, collisions and subsequent mergers.
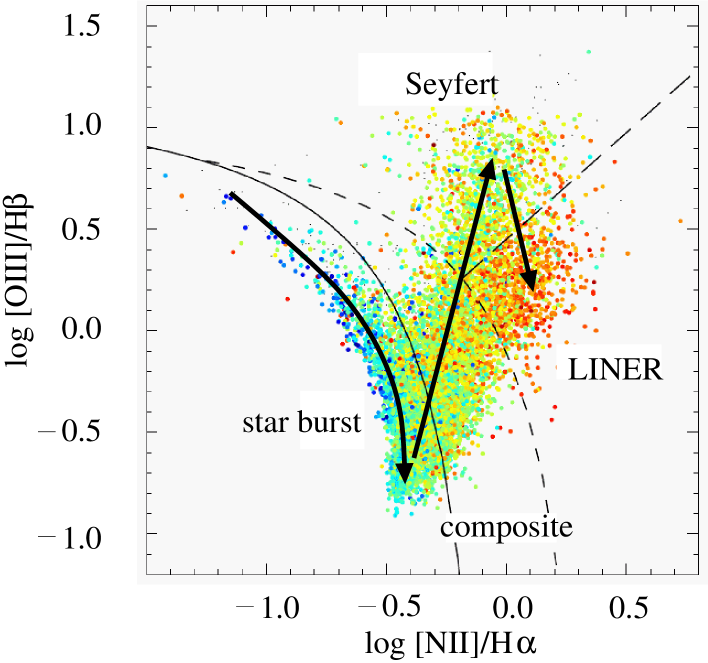
The detected AGN in a combined optical-radio sample show a shift of the AGN region of the diagnostic diagram with increasing L/LHα. The diagnostic diagrams show enhanced starforming or composite region ratios with log(L/LHα)0.716. For LINER regions this enhancement peaks above this value. Vitale et al. (2012) show that a comparison with photo-ionization models and shock models indicates that the LINER phenomenon may be connected to enhanced importance of shocks in and around these nuclei. Our results indicate that it is worthwhile to include the radio properties in the classification scheme in order to better differentiate between Seyferts and LINER sources.
Studies of the AGN populations in the radio-optical domain are therefore crucial if one aims at understanding the importance of AGN feedback. In particular a mass sequence linking the starforming galaxies and the AGN activity has been recently discussed. These processes and dependencies may point at possible evolutionary sequences. As highlighted by Vitale et al. (2015) we observed a sample of 119 intermediate-redshift SDSS-FIRST radio emitters in a redshift interval between z=0.04 and z=0.4 using the Effelsberg 100-m telescope. From observations at 4.85 and 10.45 GHz we obtained flux densities and spectral indices. The sample covers starforming galaxies, composite galaxies (with a line emission contribution from star formation and AGN activity), Seyferts, and low ionization narrow emission region (LINER) galaxies (Fig. 4). The results are discussed in a [NII]-based emission-line diagnostic diagram. We find that the radio spectral index flattens along the increased host and nuclear black hole mass from high-metallicity starforming galaxies via composite galaxies to Seyferts. Hence, the flattening goes along with a hardening of the ionizing field as indicated by the line ratios in the diagnostic diagram. There are also systematic variations in the spectral curvature and the radio structure (i.e. the relative contributions of cores and jet/lobes). These findings by Vitale et al. (2015) are a clear indication for the fact that the galaxies along this sequence are in a transition from star forming galaxies, via a nuclear radio phase, to more passive elliptical galaxies. (Fig. 4). Hence, within this picture it is also supported that the AGN feedback is playing a role in shutting down star formation activity.
The interplay between black hole masses, multifrequency luminosity of the nucleus, and starformation, i.e. a feedback between the nucleus and its immediate vicinity, may also be reflected in the properties of the water maser disks found in the nuclei of these galaxies. Through VLA radio continuum observations Kamali et al. (2017) investigate the nuclear environment of galaxies that have subparsec edge-on accretion disks with observed 22 GHz water megamaser. The black hole masses show stronger correlations with water maser luminosity than with 1.4 GHz, 33 GHz, or hard X-ray luminosities. Furthermore, the inner radii of the water maser disks show stronger correlations with 1.4 GHz, 33 GHz, and hard X-ray luminosities than their outer radii, suggesting that the outer radii may be affected by disk warping, star formation, or peculiar density distributions.
Independent of stellar processes like star formation, a significant part of all nearby galaxies shows some evidence for a weak AGN (e.g. Ho et al. 2008, Eckart et al. 2012). That trend becomes clear with increasing angular resolution and an increased coverage of the overall electromagnetic spectrum. The essential ingredients one needs to set up of specify nuclear activity in the vicinity of a supermassive black hole are (1) a compact radiatively inefficient accretion flow, (2) a possibly truncated thin accretion disk, and (3) a jet or some loosely collimated outflow. Detailed investigations of nearby galaxies, AGN and Low Luminosity AGN indicate that many, maybe all, galactic bulges host a central supermassive black hole. The exception may be dwarf galaxies and some late-type galaxies. This underlines the importance of a deeper understanding of LLAGN, to which studies of SgrA*, the nearest galactic nucleus which also shares many properties of typical LLAGN, can give important contributions.
2.3 Hints for relativistic effects near SgrA*
In order to properly interpret the multi-frequency behavior of SgrA* it is measuring to verify that the large mass associated with SgrA* has the influence on space time as expected. Parsa et al. (2017, Fig. 5) recently suggested that the young S-cluster stars are indeed experiencing relativistic effects due to the large central mass. Here, the authors primarily aimed at a new method to investigate relativistic orbits of stars in a strong gravitational field like we have it close to SgrA*. The authors used a first-order post-Newtonian approximation and calculated stellar orbits with a wide range of impact parameters, i.e. periapse distances to the supermassive black hole (here taken as an impact parameter). Close to a supermassive black hole the orbits start being affected by relativity effects which leads to characteristic changes in the orbital elements.
The significance with which the relativistic environment can be proven is currently limited: Studies of the robustness of the result by Parsa et al. (2017) show that in case of strong noise a positive result would indicate at least a 3-4 detection assuming that the measurement uncertainties follow a Gaussian process. A positive result means: deformations of the orbital shape that are in quality consistent with the expected deformations due to the influence of relativity. Such a result is found by Parsa et al. (2017). The actual magnitude of the effect (i.e. by how much the correct distortion of the shape is realized) has been calculated by tracing the stellar position measurements plus their uncertainties through the reduction and analysis pipeline. The actual values obtained by Parsa et al. (2017) that describe the orbital deformation are in good agreement with recently predicted values from theory. Here, Iorio et al. (2017) studies Post-Keplerian effects on radial velocity in binary systems and the possibility of measuring the effects of General Relativity with the Galactic Center star S2 in 2018.
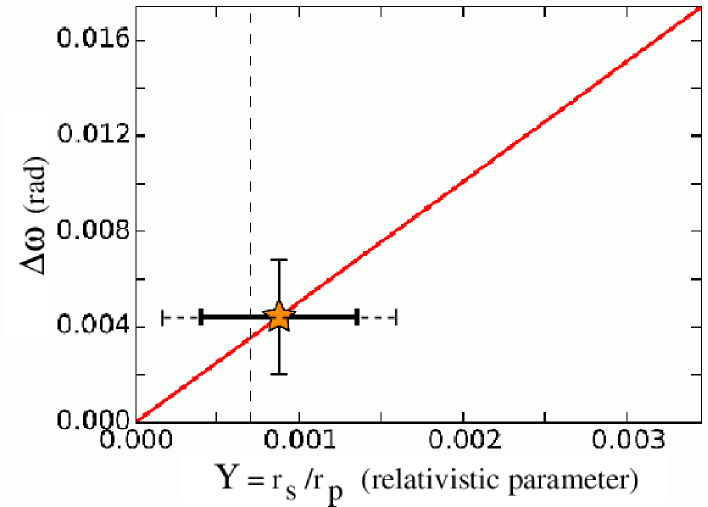
These changes are also correlated with parameters that characterize the degree of relativity present in the distance range covered by the stellar orbits. To express the result though a parameter that measures the degree of relativity that depends on quantities that measure the corresponding distortions Parsa et al. (2017) had to describe the results using truncated normal distributions a method that is often used in statistics and econometrics. It is used if dependent variables can take only a limited number or a limited range of values. The combination of different measures of the distortion does not follow a Gaussian distribution. Hence, Parsa et al. (2017) then used for the final derivation of the relativistic parameter the median and the median deviation rather than the mean and the standard deviation. One of these relativistic parameters can be defined as the ratio between the Schwarzschild radius and the impact parameter . This ratio can be obtained from observational data. For the star S2 Parsa et al. (2017) find a value of . the expectation for S2 is , as it can be derived from the SgrA* mass and the orbit of S2 approximated as a Keplerian orbit. While the results can certainly be improved through the upcoming interferometric measurements in the infrared, it is the first time that a relativistic parameter could be obtained from stellar observational data. The currently obtained value is unlikely to be dominated by perturbing effects like excess noise on the stellar positions, rotation of the field, drifts in black hole mass, or perturbing influences of other masses within the central S-cluster (see discussion by Parsa et al. 2017).
Comparison to Mercury: The relativistic orbit deformations expected and indicated for the star S2 orbiting the 4.3 million solar masses black hole at the center of the Milky Way are indeed the comparable to those detected for the orbit of Mercury around the Sun. There is, however, one difference! The relativistic Mercury pericenter shift is only about 1/12 of the shift that Mercury’s orbit experiences from the forces by the other planets: It is 43 arcseconds out of 532 arcseconds. For the star S2 the interaction with the other stars on a single orbital time scale is much smaller. Depending in the presence of 20 to 30 solar mass black holes the effect is either comparable to or (in case of the absence of such massive scatterers) almost negligible compared to the relativistic effect due to the 4.3 million solar masses of SgrA* (Sabha et al. 2012). For pure, undisturbed relativistic effects, we expect to see for star S2 a pericenter shift of 11 arcminutes (i.e. 660 arcseconds) and we measured 147 arcminutes (i.e. 840420 arcseconds). So - if the measurement can be made more precise in the near future, S2 provides a much clearer case for the relativistic pericenter shift when compared to Mercury.
Precise positional measurements are the key to further progress in proving SgrA*’s relativistic environmemt. Larger telescopes are needed to achieve that. One way of getting to larger telescopes is interfering their received radiation at a single combined focus. GRAVITY is an interferometric beam combiner that allows one to connect the four 8.2 meter diameter unit telescopes of the European Southern Observatory on the Paranal mountain in Chile. This way a 120 m diameter telescope can be realized. Repeated measurements of the position of the NIR counterpart of the SgrA* black hole and the star S2 will allow an exact measurement of the S2 orbit and a much more precise determination of the associated relativistic effects.
2.4 Hints for starformation in a mildly relativistic environment
Currently the most general simultaneously obtained estimates for the mass of and the distance to the supermassive black hole SgrA* involve the three stars that have the the shortest period (i.e. S2, S38, and S55 - alias S0-102) based on Newtonian models are M M⊙ and kpc (Parsa et al. 2017). The presence of this large mass as well as the presence of young stars in the central stellar cluster indicates that stars are being formed (even in the mildly relativistic) in the immediate vicinity of supermassive black holes. The young ages of only a few million years as well as their low orbital eccentricities indicate that the formation of the more massive emission line stars probably took place in-situ in a dense accretion disk of gas and dust (Nayakshin & Cuadra 2005, Levin 2007; Alexander et al. 2008; Bonnell & Rice 2008). In Jalali et al. (2014) we showed how ongoing starformation can be sustained in the vicinity of a very large black hole mass. This may include also of stars like the high velocity S-stars that have masses between 8 and 14 M⊙ (Habibi et al. 2017) or even lower mass stars similar to the Dusty S-cluster Object (DSO) that recently went through a SgrA* periapse (e.g. Zajacek et al. 2014, 2016, 2017, Valencia-S. et al. 2015). Jalali et al. (2014) show that infalling gaseous clumps (possibly from the circum nuclear ring) can be further compressed during periapse (if sufficiently cold i.e. less than 50 to 100 K) such that the formation of main sequence stars is in fact enhanced due to the presence of a large mass. The X-ray footprint (i.e. shadow agains the local Galactic Center X-ray background) of the Circum Nuclear Disk has recently been revealed by Mossoux & Eckart (2017). While this phenomenon indicates that star formation is actually triggered in a mildly relativistic environment this needs to be further supported. The S-star cluster in the Galactic center is a particularly well suited place to study the physical processes in the vicinity of a supermassive black hole. This is also the region where stars can be used to perform dynamical tests of general relativity.
3 Radiation mechanism
3.1 Overall Spectrum
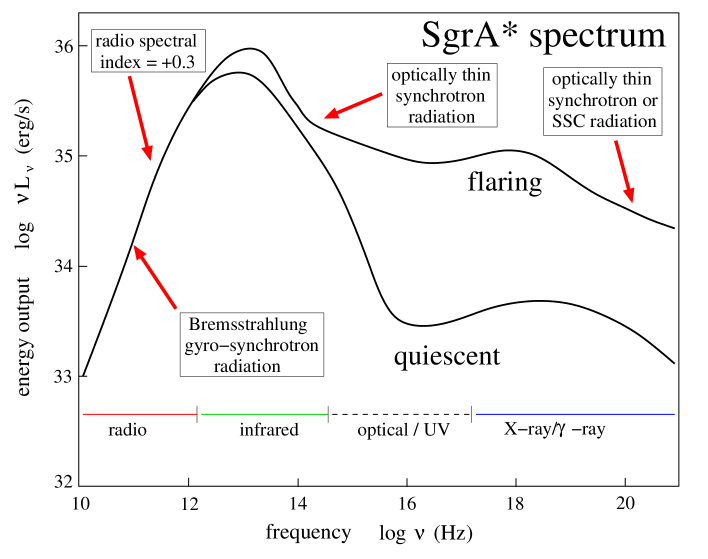
In Fig. 6 we show a sketch of the quiescent and flaring broad band spectrum of SgrA* based on radio data from Falcke et al. (1998) and Zhao et al. (2003), the IR data from the VLT (see e.g. Eckart et al. 2017 and references in there). The X-ray date are from e.g. Baganoff et al. (2001, 2003), Porquet et al. (2003, 2008) and Neilsen et al. (2013). The solid lines are based on ADAF models by e.g. Yuan et al. (2003), Narayan et al. (1998, 2008). The nonthermal variable source associated with SgrA* can only be observed in the radio to longer mid-infrared domain (see e.g. Schödel et al. 2011). During the quiescent phases it is currently below the detection/confusion limit in the NIR to X-ray domain. During its flare phase it is well visible in all spectral domains including harder X-rays (see e.g. Zhang et al. 2017). In Fig. 6 we have highlighted some of the prominent radiation mechanisms from gyro-synchrotron, Bremsstrahlung, synchrotron and synchrotron self-Compton (SSC) radiation.
3.2 Flares
While the flare emission clearly indicates that some accretion, heating, or magnetic acceleration mechanism give rise to enhanced emission, one has to take into account the fact that this emission arises in the immediate vicinity of a supermassive black hole, i.e. a large mass with relativistics effects as a consequence. General Relativistic Magneto Hydrodynamics (GRMHD) allows to understand important basics of the emitting region around SgrA* including mid-planes or disks, jets, outflows and more extended emission zones (e.g. Moscibrodzka et al. 2017, 2014, 2013, Broderick et al., 2011, Shcherbakov, Penna, & McKinney 2012). Short term variability is often explained by hotspot emission from the mid-plane that often forms in GRMHD simulations due to the conservation of angular moment (e.g. Meyer et al. 2006ab, Eckart et al. 2006, Broderick & Loeb, 2005, 2006, Bao & Ostgaard 1995, Bambi 2015). However, close to the black hole relativistic lensing and boosting effects influence the appearance of flare emission (e.g. Broderick & Loeb, 2005, 2006, Eckart et al. 2006). In some bright X-ray flares these characteristic shapes may be visible (see 3.2.3).
Based on the hotspot model, Karssen et al. (2017) address if the observed light curves of X-ray flares can give independent constraints on the mass of the central supermassive black hole. They study the asymmetric flare shapes that arise from temporary flare of a blob orbiting near a supermassive black hole. The inferred mass derived from the flares is in agreement with previous mass estimates based on orbits of stars (e.g. Parsa et al. 2017, and references therein). Karssen et al. (2017) also successfully test the reliability of the method by applying it to lightcurves from the Seyfert I galaxy RE J1034+396.
These characteristic flare shapes are a result of an interplay of relativistic effects that are responsible for the modulation of the observed light curves: Doppler boosting, gravitational redshift, light focusing, and light-travel time delays. In order to see these shapes it is required that the intrinsic hotspot emission stays rather constant during the phase in which the important relativistic amplification effects can take place. In the following we discuss the flare emission mechanisms under this aspect. The goal, here, is to narrow down the relevant time scales on which the intrinsic flux density of the source component varies before experiencing rapid and strong modulations by relativistic effects like Doppler-boosting (beaming) or lensing.
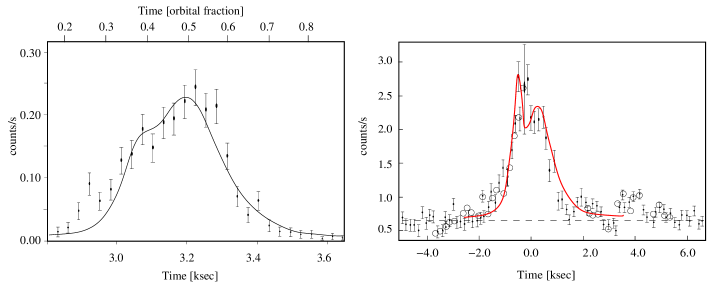
In Fig.8 we show data of two bright flares observed with the Chandra/HETGS instrument in addition with a hotspot flare model with parmeters given in the caption. The shoulder is due to lensing when the hotsopt is behind the black hole and the peak is due to boosting when the hotspot approaches the observer after passing around the backside of the black hole.
Since bright X-ray flares are often seen synchronous with brigh NIR-flares the finding by Karssen et al. (2017) is probably also applicable for NIR-flares. The method by Karssen et al. (2017) indicates that at least for bright flares the flare time scales are coupled to the dynamical time scale of radiation matter colse to SgrA*.
3.2.1 The near-infrared domain
The value of the spectral index for brighter flares which gives us information on the relativistic electron energy distribution is consistent with =-0.7 (S). This is in agreement with optically thin NIR synchrotron radiation. In Bremer et al. (2011; see also references there in) we highlight a possible tendency for weaker flares to exhibit a steeper spectrum. We conclude that the distribution of spectral indices as a function of NIR K-band flux density can successfully be described by an exponential cutoff proportional to exp[-(/)0.5] because of synchrotron losses, with being a characteristic cutoff frequency. Varying between the NIR and sub-mm domain and assuming a sub-mm flux density variation of about one Jansky and optically thin spectral indices of =-0.70.3 explain the observed spectral properties of SgrA* in the NIR (Bremer et al. 2011). The infrared ’flares’ are bright flux density excursions of the variable NIR emission that can be described well by a stationary red-noise flux density distribution of the form with a power-law index (Witzel et al. 2012).
3.2.2 The radio domain
Observational evidences and theoretical modelling show that the synchrotron spectra which are optically thin in the NIR peak in the 300-500 GHz band (Eckart et al. 2008, 2012, Marrone et al. 2006ab, 2006PhDT). In Subroweit et al. (2017) we perform a statistical analysis of both the variable 100 and 345 GHz flux densities of SgrA*. We find that both distributions are also well described by power-laws with 4. Within the framework of a plasmon model we also use the derived power-law indices to constrain the important model parameters: We find the initial synchrotron turnover frequency and the source component expansion velocity to be predominantly above 100 GHz and below 0.01 c, respectively (see details in Eckart et al. 2012).
3.2.3 The X-ray domain
Neilsen et al. (2015) presented a statistical analysis of the X-ray flare flux distribution. They also described the flux counts by a power-law distribution with 2. Neilsen et al. (2015) point out that in case of the X-ray emission being produced via the Synchrotron Self Compton (SSC) effect, this index is fully consistent with the power-law index (Witzel et al. 2012). Hence, it is very likely that the X-ray flare emission is fully dominated by SSC radiation. This is in agreement with the modeling of 8 flares with simultaneous NIR- and X-ray measurements by Eckart et al. (2012). For these flares the caculations indicate that for synchrotron flares in the infrared with the corresponding SSC response in the X-ray domain the volume density of relativistic electrons is larger than 106cm-3 with a typical expectation value of cm-3 high but not excessive (Eckart et al. 2012 and Mossoux et al. 2016).
If one wants to explain the X-ray flare emission by synchrotron radiation only, then the high energy cutoff in the electron energy distribution requires large Lorentz factors of for the emitting electrons and magnetic field strengths in the range of 10-100 G (Baganoff et al. 2001, Markoff et al. 2001, Yuan et al. 2004). However, if electrons are being produced it is very likely that a lot more electrons are available as well. Hence, the SSC emission by those lower energy electrons will already produce a significant portion of the observable X-ray emission such that it becomes hard to justify the need for a significant population of electrons (see discussion by Eckart et al. 2006, 2008, 2012).
Zhang et al. (2017) show in their Fig.4 a decomposition of the NuStar X-ray spectrum of SgrA* as obtained for the inner 30 arcseconds of the Sgr A* emission complex during its X-ray quiescence. They show the data together with the best-fit model. Several components are indicated: two thermal components with kT1.1 keV and kT6.7 keV, a Gaussian model to fit the 6.4 keV neutral Fe-line, and a power-law (blue). The thermal components become very faint above about 20 keV. Then the non-thermal power-law component starts to dominate the spectrum. This spectrum may constrain the SgrA* quiescent luminosity level, however it may also contain contributions from a Pulsar Wind Nebula (PWN) candidate and the diffuse X-ray emission in that region.
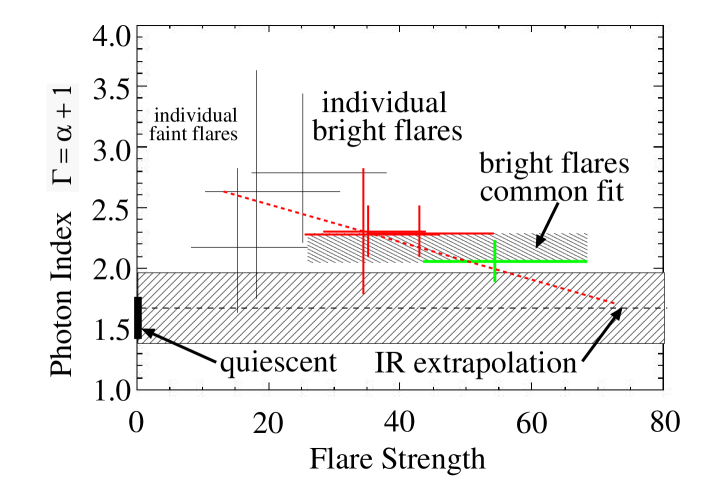
In Fig.7 we show the photon indices versus flare strength for 7 flares detected by NuStar with significance of more than . The flare strength is defined as the ratio of the flare 2-10 keV unabsorbed flux to the quiescent state flux of F(2-10 keV) = . There is no significant correlation between the flare spectral shape and the flare luminosity. For comparison we also show the photon index for the quiescent state (thick bar to the left), the common fit to the three bright NuStar detected flares (shaded box), and the expected photon index using the spectral index from the near-infrared domain (light shaded box). This NIR spectral index would be valid if the spectrum is due to synchrotron radiation and the spectrum extends into the X-ray domain or if the spectrum is due to SSC radiation staying with the same spectral index as the synchrotron spectrum it originates from. There is the tendency that this may indeed be the case for the brightest flares (see dashed line in Fig.7 and in Fig.3 by Zhang et al. 2017).
3.2.4 Cooling time scales in the X-ray domain
Cooling time scales for the synchrotron components peaking in the sub-mm are of the order of 1-2 hours (see also Eckart et al. 2006). In this frequency range the space density of photons scattered by the cospatially present relativistic electrons is highest. This implies that the intrinsic flare light curve in the X-ray domain is dominated through the SSC process by the cooling time scales of the sub-mm synchrotron components. This is contrasted by the expectations for direct synchrotron production of the X-ray emission. In this case the high energy electrons result in short cooling time scales of less than a few hundred seconds. Source variability on these time scales would be expected and longer flares would require repeated injections or acceleration of high energy electrons (Baganoff et al. 2001, Markoff et al. 2001, Yuan et al. 2004, Eckart et al. 2006, 2012).
However, the observational facts described above make it more likely that a population with energetically far less demanding electrons and an upper synchrotron cutoff frequency just short of the NIR provide the dominant portion of the X-ray emission through the SSC process. Such a scenario is also greatly supported by the close statistical relation between the flare flux power-law indices and (Neilsen et al. 2015) and the modelling of individual flares (Eckart et al. 2012). The sub-mm cooling time scales (and adiabatic expansion time scales for the spectral peak emission from the sub-mm to the radio) are also of the same order as the length of the bright X-ray flares.
As the sub-mm to NIR domain is linked to the X-ray domain via SSC scattering, one may also look at the time scales associated with quantities that dominate the scattering efficiency (see equation 4 by Marscher 1983): Quantities like the source size and the synchrotron turnover frequency are governed by the time scales of adiabatic expansion (hours). Quantities like the synchrotron peak flux and the spectral index are governed by the accretion process. Here, for SgrA* the times scales go from the orbital time scale (i.e. typical flare time scales) to many days (specifically for X-ray variability see equation 5 by Ishibashi et al. 2012). Also shocks that may influence the relativistic particle distribution or the source size can be assumed to be significantly slower than 0.01 c which is linked to the corresponding adiabatic expansion time scales.
3.2.5 Conclusion for the modelling approach
From this it can be concluded that the intrinsic flux density evolution of X-ray luminous components is dominated by the time scales of the relevant sub-mm peaking synchrotron components. This then implies that rapid flux density variations in the X-ray domain are more likely a result of relativistic effects like boosting and lensing rather than synchrotron cooling due to high energetic electrons. This is supported by the fact that the time scales for the boosting and lensing events are very short (in the few minutes to 10 minute range - depending on the geometry) compared to those on which the underlying emission is varying. Also (again depending on the geometry) the amplification factors of these relativistic effects can easily be several 10 to 100. In addition, the flare lengths indicate that the flares themselves originate close to the black hole (Baganoff et al. 2001, 2003) making these relativistic modulations also frequent and relevant. This scenario justifies that we model the flare profiles with an orbiting spot model. This model is a generalized surrogate-model to characterize the behavior of (in this case) X-ray emitting matter in the gravitational field of a supermassive black hole.
Of course, we only consider the variable non-thermal part of the SgrA* emission.
This source is embedded in an extended non-variable Bremsstrahlung component
(Baganoff et al. 2001, 2003) and during times the source is not flaring,
the non-thermal flux drops well below the Bremsstrahlung flux level.
This constant component is therefore removed before we fit the flares.
Also is significantly smaller than (see above),
hence, brighter flares in the X-ray domain are much more pronounced.
Restricting the modelling to the brightest flares, therefore essentially
completely avoids the risk of overlapping flare events, such that we
truly model only one flare at a time.
This also supports the choice of spots on circular orbits as a
surrogate model for radiating matter close to the SMBH
as highly elliptical orbits due to in-falling matter are
probably strongly suppressed.
In a viscous environment with multiple gaseous clouds
(as expected for ’central mid-planes’ resulting
from magneto-hydrodynamic accretion models),
clouds on crossing orbits can be excluded as their collisions
are highly dissipative.
As (semi-)stable trajectories in such an environment circular
orbits are preferred.
Hence, cases of freely in-falling matter on highly elliptical trajectories
close to the SMBH are probably rare and will not dominate the
observed flare cases.
But even if they occur and even if the viscosity is small one can state
the following:
Is the distance of the spot equal or shorter than the semilatus rectum
for highly elliptical trajectories and for cases for which the line
of sight passes close to the SMBH so that the relativistic effects
are relevant,
the difference in distance to the SMBH is between a factor 1 to 2,
compared to the circular case. The velocity is less than
higher if the spot is at its priapse.
In proper motion this difference is largely compensated for
if the spot is observed close to the semilatus rectum position.
In line of sight velocity this factor comes fully in only if the
long axis is almost perpendicular to the line of sight.
On the one hand this shows that the expected differences in the
light curve shapes are well covered by differences for light
curves shapes for circular orbits in our experimental setup.
On the other hand the length of the observed light curve
effected by relativistic effects
is only a factor of longer than in the circular case.
For all other orientations (50% in three dimensions)
of the highly eccentric trajectories
the lensing case becomes quickly unlikely and the boosting becomes too small
to effect the spot luminosity.
Hence, while highly eccentric orbits for viscous magneto-hydrodynamic
accretion are not likely anyhow, these cases are also not likely to
play a dominant role if they occurred in the immediate vicinity
of a SMBH.
However, in general, and not necessarily in the current context of hot spots in the framework low luminosity temporary accretion disks, eccentric accretion flows may play an important role on much longer time scales. Eccentric accretion flows are naturally formed after tidal disruption events. The initial eccentricity of tidal debris scales with the ratio of the stellar mass (Mstar) to the black hole mass () approximately as 1-2(Mstar/Mbh)1/3, approaching unity for smaller ratios (Svirski et al. 2017). Hot spots in the eccentric tidal streamers could be formed as shocks as a result of the supersonic collision of the tidal debris with the initial streamer at the apo-center of the orbit. However, such events are rather rare for Sgr A*, since statistically only one disruption of a star per 104 years is expected (Phinney 1989). Other hypothetical source of eccentric synchrotron ’hot spots’ would be young neutron stars, since they wouldn’t be tidally disrupted even at ISCO. So for some time they could orbit SMBH on precessing eccentric orbits until they would plunge through the horizon due to the gravitational-wave losses. This is similar to the original idea of hot spots being stars as studied first by Cunningham and Bardeen (1973). The full relativistic treatment of an eccentric hot spot is given by Bao, Hadrava, & Ostgaard (1994) - they compare the light curves for zero eccentricity and e=0.5 with a similar set-up as used by Karssen et al. (2017).
3.2.6 The -ray domain
While the overall SgrA complex has been detected by ground-based Cherenkov Telescopes (e.g. Aharonian et al. 2004, Kosack et al. 2004, Albert et al. 2006) no unique SgrA* counterpart has been reported in the -ray domain. Ahnen et al. (2017) present results of a monitoring campaign of the Galactic center (GC) using the MAGIC Imaging Atmospheric Cherenkov Telescopes between 2012-2015. This was done with the goal of detecting high-energy flare emission above 100 GeV under the assumption that the passage of the Dusty S-cluster Object leads to enhanced accretion events during and after its SgrA* periapse in mid-2014 (e.g. Valencia et al. 2015). Previous results on the -ray spectrum of SgrA* were confirmed but no significant variability or excess emission was detected. Photons detected from SgrA* in this energy domain would most likely be comptonization NIR of X-ray photons. Future observation with the Cherenkov Telescope Array (CTA) (https://www.cta-observatory.org/) may reveal more information on the -ray spectrum of SgrA* or the central region in general.
4 Summary
SgrA* can be considered as an extremely low luminosity LLAGN. Previous activities may have been higher than today (Fig. 2). For LLAGN there is an indication for a mass dependent positioning or evolution from normal star bursting galaxies to Seyferts and to LINERS, or even via Seyferts to LINERS (Fig. 2). There are several indications that star formation on all mass scales may take place within the central stellar cluster or even close to the supermassive black hole (see section 2.4).
From the orbit of S2 there are close hints at the fact that especially the the very central S-cluster stars are on relativistic orbits around SgrA*. The accretion process and the corresponding emission from SgrA* have characteristic signatures (spectral index, degree of variability) in all wavelength domains from the radio via the infrared to the X-ray regime. These characteristic signatures may in part (at least for the brighter flares) also include the possible flare shapes. Here, the emission of orbiting hot-spots is modulated by boosting and lensing on his orbit around the SMBH. The dominant radiation mechanism for flares in the sub-mm to X-ray domain is synchrotron mechanism in combination with a comptonization of the corresponding photons.
Acknowledgements
We received funding from the European Union Seventh Framework Program (FP7/2013-2017) under grant agreement no 312789 - Strong gravity: Probing Strong Gravity by Black Holes Across the Range of Masses. This work was supported in part by the Deutsche Forschungsgemeinschaft (DFG) via the Cologne Bonn Graduate School (BCGS), the Max Planck Society through the International Max Planck Research School (IMPRS) for Astronomy and Astrophysics, as well as special funds through the University of Cologne and SFB 956 - Conditions and Impact of Star Formation. M. Zajacek, M. Parsa and B. Shahzamanian are members of the IMPRS. Part of this work was supported by fruitful discussions with members of the European Union funded COST Action MP0905: Black Holes in a Violent Universe and the Czech Science Foundation - DFG collaboration (No. 13-00070J).
References
- [1] Ahnen, M. L.; Ansoldi, S.; Antonelli, L. A.; , et al.; 2017, A&A 601, 33
- [2] Aharonian et al. (2004), 2004 A&A 425, L13
- [3] Antonucci, R.; 1993, ARA&A 31, 473
- [4] Albert et al. (2006) 2006, ApJ 638, L101
- [5] Alexander, R.D.; Armitage, P.J.; Cuadra, J.; Begelman, M.C.; 2008, ApJ 674, 927
- [6] Archer, A.; Barnacka, A.; Beilicke, M. et al.; 2014, ApJ 790, 149
- [7] Baganoff, F. K., Bautz, M. W., Brandt, W. N., et al. 2001, Nature, 413, 45
- [8] Baganoff, F. K., Maeda, Y., Morris, M., et al. 2003, ApJ, 591, 891
- [9] Bao, G.; Ostgaard, E., 1995, ApJ 443, 54
- [10] Bao, G.; Hadrava, P.; Ostgaard, E.; 1994, ApJ 425, 63
- [11] Bambi, C., 2015, CQGra 32, 5005
- [12] Bonnell I. A., Rice W. K. M., 2008, Science, 321, 1060
- [13] Bremer, M.; Witzel, G.; Eckart, A.; et al.; 2011, A&A 532, 26B
- [14] Broderick, A.E.; Loeb, A., 2005, MNRAS 363, 353
- [15] Broderick, A.E.; Loeb, A., 2006, MNRAS 367, 905
- [16] Broderick, A.E.; Fish, V.L.; Doeleman, S.S.; Loeb, A., 2011, ApJ 738, 38
- [17] Busch, G.; Smajic, S.; Scharwaechter, J.; Eckart, A.; et al. 2015, A&A, 575, A128
- [18] Busch, G.; Fazeli, N.; Eckart, A.; et al., 2016a, A&A 587, 138
- [19] Busch, G., 2016b, Proceedings of the WDS’16 Prague, MATFYZPRESS, 72-79.
- [20] Cunningham, C.T.; Bardeen, James M.; 1973, ApJ 183, 237
- [21] Eckart, A.; Garcia-Marin, M.; Vogel, S. N.; et al., 2012, A&A 537, 52
- [22] Eckart, A., Baganoff, F. K., Morris, M. R., et al. 2009, A&A, 500, 935
- [23] Eckart, A., Schödel, R.; Garcia-Marin, M.; Witzel, G.; et al. 2008, A&A 492, 337
- [24] Eckart, A.; Schödel, R.; Meyer, L.; et al. 2006, A&A 455, 1
- [25] Eckart, A.; Britzen, S.; Horrobin, M.; Zamaninasab, M.; et al.; Proceedings of Nuclei of Seyfert galaxies and QSOs - Central engine & conditions of star formation (Seyfert 2012). 6-8 November, 2012. Max-Planck-Insitut für Radioastronomie (MPIfR), Bonn, Germany., 2012, nsgq.confE 4
- [26] Falcke, H.; Goss, W.M.; Matsuo, H.; Teuben, P., et al.; 1998, ApJ 499, 731
- [27] Falcke, H.; Körding, E.; Markoff, S.; 2004, A&A 414, 895
- [28] Falcke, H.; Markoff, S. B.; Classical and Quantum Gravity, Volume 30, Issue 24, article id. 244003 (2013)
- [29] Ferrarese L., Merritt D., 2000, ApJ, 539, L9
- [30] Ghez, A.M.; Salim, S.; Weinberg, N.N.; Lu, J.R.; Do, T.; et al.; 2008, ApJ 689, 1044
- [31] Graham, A. W., & Scott, N. 2013, ApJ, 764, 151
- [32] Gültekin K. et al., 2009, ApJ, 698, 198
- [33] Habibi, M.; et al.; ApJ in press; 2017arXiv170806353H
- [34] Heckman, T. M. 1980a, A&A 87, 152
- [35] Heckman, T. M. 1980b, A&A 87, 142
- [36] Ho, L.C.; Filippenko, A.V.; Sargent, W.L.W., 1997, ApJ 487, 568
- [37] Ho, Luis C., 2008, ARA&A 46, 475 Nuclear Activity in Nearby Galaxies
- [38] Iorio, L.; 2017; arXiv:1705.05471
- [39] Ishibashi, W.; Courvoisier, T. J.-L.; 2012, A&A 540, L2
- [40] Jalali, B.; Pelupessy, F. I.; Eckart, A.; Portegies Zwart, S.; Sabha, N.; Borkar, A.; Moultaka, J.; Muzic, K.; Moser, L. 2014, MNRAS 444, 1205
- [41] Kamali, F.; Henkel, C.; Brunthaler, A.; Impellizzeri, C. M. V.; Menten, K. M.; et al., ApJ in press, 2017arXiv170602699K
- [42] Karssen G.D., Bursa M., Eckart A., Valencia-S M., Dovc̆iak M., Karas V., Horák J; et al. 2017, MNRAS in press, 2017MNRAS.472.4422K.
- [43] Kosack et al. (2004), 2004, ApJL 608, L97
- [44] Koliopanos, F.; Ciambur, B.C.; Graham, A.W.; Webb, N.A.; Coriat, M.; Mutlu-Pakdil, B.; Davis, B.L.; Godet, O.; Barret, D.; Seigar, M.S., 2017, A&A 601, 20
- [45] Kormendy J., Ho L. C., 2013, ARA&A, 51, 511
- [46] Levin, Y.; 2007, MNRAS 374, 515
- [47] Liu, B. F.; Meyer, F.; Meyer-Hofmeister, E.; 2004, A&A 421, 659
- [48] Marconi, A., & Hunt, L. K. 2003, ApJ, 589, L21
- [49] Markoff, S.; Falcke, H.; Yuan, F.; Biermann, P. L., 2001, A&A 379, L13
- [50] Marscher, A.P.; 1983, ApJ 264, 296
- [51] Marrone, D.P. 2006, Ph.D. Thesis, Harvard Univ.
- [52] Marrone, D.P., Moran, J.M., Zhao, J.-H., & Rao, R. 2006a, ApJ, 640, 308
- [53] Marrone, D.P., Moran, J.M., Zhao, J.-H., & Rao, R. 2006b, JPhCS, 54, 354
- [54] Marrone, D. P., Baganoff, F. K., Morris, M. R., et al. 2008, ApJ, 682, 373
- [55] Marscher, A. P. 1983, ApJ, 264, 296
- [56] McConnell N. J., Ma C.-P., 2013, ApJ, 764, 184
- [57] Meyer, L.; Eckart, A.; Schödel, R.; Duschl, W. J.; Muzic, K.; Dovciak, M.; Karas, V., 2006, A&A 460, 15
- [58] Meyer, L.; Schödel, R.; Eckart, A.; Karas, V.; Dovciak, M.; Duschl, W. J.; 2006, A&A 458, L25
- [59] Moscibrodzka, M.; Falcke, H.; Shiokawa, H.; Gammie, C.F., 2014, A&A 570, 7
- [60] Moscibrodzka, M.; Falcke, H., 2013, A&A 559, L3
- [61] Moscibrodzka, M., 2017, IAUS 322, 43
- [62] Mossoux, E.; Grosso, N.; Bushouse, H.; Eckart, A.; Yusef-Zadeh, F.; et al., 2016, A&A 589, 116
- [63] Mossoux, E. & Eckart, A.; 2017, MNRAS in press, 2017arXiv171107841M
- [64] Narayan, R., Mahadevan, R., Grindlay, J. E., et al.; 1998, ApJ, 492, 554
- [65] Narayan, R.; McClintock, J.E.; 2008, NewAR 51, 733
- [66] Nayakshin S., Cuadra J., 2005, A&A, 437, 437
- [67] Neilsen, J.; Markoff, S.; Nowak, M. A.; Dexter, J.; Witzel, G.; et al.; 2015, ApJ 799, 199
- [68] Neilsen, J.; Nowak, M.A.; Gammie, C.; Dexter, J.; et al.; 2013, ApJ 774, 42
- [69] Nowak, M. A., Neilsen, J., Markoff, S. B., et al. 2012, ApJ, 759, 95
- [70] Parsa, M.; Eckart, A.; Shahzamanian, B.; Karas, V.; Zajacek, M.; Zensus, J. A.; Straubmeier, C.; 2017arXiv170803507P; 2017, ApJ, 845, 22
- [71] Phinney, E.S.; 1989, IAUS 136, 543
- [72] Porquet, D., Predehl, P., Aschenbach, B., et al. 2003, A&A, 407, L17
- [73] Porquet, D., Grosso, N., Predehl, P., et al. 2008, A&A, 488, 549
- [74] Ptak 2001, AIPC 599, 326
- [75] Quataert, E. 2002, ApJ, 575, 855
- [76] Sabha, N.; Eckart, A.; Merritt, D.; Zamaninasab, M.; Witzel, G.; et al.; 2012, A&A 545, 70
- [77] Schödel, R.; Morris, M. R.; Muzic, K.; Alberdi, A.; Meyer, L.; Eckart, A.; Gezari, D. Y., 2011, A&A 532, 83
- [78] Shcherbakov, R.V.; Penna, R.F.; McKinney, J.C.; 2012, ApJ 755, 133
- [79] Subramanian, S.; Ramya, S.; Das, M.; George, K.; Sivarani, T.; Prabhu, T. P., 2016, MNRAS 455, 3148
- [80] Subroweit, M., Garcia-Marin, M., Eckart, A., Borkar, A., Valencia-S., M., Witzel, G., Shahzamanian, B. , and Straubmeier, C.; 2017, A&A 601, 80S
- [81] Svirski, G.; Piran, T.; Krolik, J.; 2017, MNRAS 467, 1426
- [82] Terrier, R.; 2016, Proc. of the 41st COSPAR Scientific Assembly, 41, 1900
- [83] Trap, G., Goldwurm, A., Dodds-Eden, K., et al. 2011, A&A, 528, A140
- [84] Tremaine S. et al., 2002, ApJ, 574, 740
- [85] Urry, C.M.; Padovani, P.; 1995, PASP 107, 803
- [86] Valencia-S., M.; Eckart, A.; Zajacek, M.; Peissker, F.; Parsa, M.; et al.; 2015, ApJ 800, 125
- [87] Vika, M.; Driver, S.P.; et al.; 2012, MNRAS 419, 2264
- [88] Vitale, M.; Fuhrmann, L.; Garcia-Marin, M.; Eckart, A.; Zuther, J.; Hopkins, A. M.; 2015, A&A 573, 93
- [89] Vitale, M.; Zuther, J.; Garcia-Marin, M.; Eckart, A.; Bremer, M.; Valencia-S., M.; Zensus, A.; 2012, A&A 546, 17
- [90] Witzel, G., Eckart, A.; Bremer, M.; Zamaninasab, M.; et al., 2012, ApJS 203 18
- [91] Yuan, F.; Quataert, E.; Narayan, R.; 2004, ApJ 606, 894
- [92] Yuan, F.; Quataert, E.; Narayan, R.; 2003, ApJ 598, 301
- [93] Yusef-Zadeh, F., Bushouse, H., Dowell, C. D., et al. 2006a, ApJ, 644, 198
- [94] Yusef-Zadeh, F., Roberts, D., Wardle, M., Heinke, C. O., & Bower, G. C. 2006b, ApJ, 650, 189
- [95] Yusef-Zadeh, F., Wardle, M., Heinke, C., et al. 2008, ApJ, 682, 361
- [96] Yusef-Zadeh, F., Bushouse, H., Wardle, M., et al. 2009, ApJ, 706, 348
- [97] Zajacek, M.; Karas, V.; Eckart, A., 2014, A&A 565, 17
- [98] Zajacek, M.; Eckart, A.; Karas, V.; Kunneriath, D.; Shahzamanian, B.; Sabha, N.; Muzic, K.; Valencia-S., M.; 2016, MNRAS 455, 1257
- [99] Zajacek, M.; Britzen, S.; Eckart, A.; et al., 2017, A&A 602, 121
- [100] Zhao, Jun-Hui; Young, K.H.; Herrnstein, R.M.; Ho, P.T.P.; et al.; 2003, ApJ 586, L29
- [101] Zhang, S.; Baganoff, F.K.; Ponti, G.; Neilsen, J.; Tomsick, J.A.; et al., 2017, ApJ 843, 96