Vol.0 (200x) No.0, 000–000
22institutetext: Aryabhatta Research Institute of observational sciencES (ARIES), Manora Peak Nainital 263 002, India;
A Proper Motions Study of the Globular Cluster M12 (NGC 6218)
Abstract
Using astrometric techniques developed by Anderson et al., we determine proper motions (PMs) in 14.6016.53 arcmin2 area of the kinematically “thick-disk” globular cluster M12. The cluster’s proximity and sparse nature makes it a suitable target for ground-based telescopes. Archive images with time gap of years were observed with wide-field imager (WFI) mosaic camera mounted on ESO 2.2 m telescope. The median value of PM error in both components is mas yr-1 for the stars having mag. PMs are used to determine membership probabilities and to separate field stars from the cluster sample. In electronic form, a membership catalog of 3725 stars with precise coordinates, PMs, photometry is being provided. One of the possible applications of the catalog was shown by gathering the membership information of the variable stars, blue stragglers and X-ray sources reported earlier in the cluster’s region.
keywords:
Galaxy: globular clusters, astrometry, catalogs, individual : M121 Introduction
Recent studies have brought a new change to the understanding of the formation and evolution of stars in the globular clusters showing stars with different chemical composition (e.g. Bedin et al. 2004; Anderson et al. 2009; Milone et al. 2012; Khamidullina et al. 2014; D’Orazi et al. 2015). For various reasons, the membership information is useful for evolved stars as well as fainter stars on the main sequence. M12 (= 16h 47m 14s.18, = 56 54.7) is a nearby globular cluster , with the heliocentric distance being 4.8 kpc. The cluster shows a low-density central region making it an ideal globular cluster for the ground-based astronomy. The Galactic location of the cluster places it close to the Galactic disk = (, ); and = 4.5 kpc. M12 is a moderately metal-poor (intermediate metallicity, ) globular cluster. All the mentioned fundamental parameters of M12 are taken from Harris (1996, updated in 2010). Giant branch metallicities of M12 show a spread (Zinn & West 1984; Rutledge et al. 1997). M12 is a “second-parameter” cluster because its horizontal branch (HB) falls blueward of the RR Lyrae instability strip (Johnson & Pilachowski 2006). It has a HB index (Lee et al. 1994) equal to 0.97 (Salaris et al. 2004). It has been suggested that M12 should belong to the thick disk and not Galactic halo based on its kinematical properties (Dinescu et al. 1999; Pritzl et al. 2005).


Photometry of M12 can be found in various research articles (e.g. Nassau & Hynek 1946; Racine 1971; Buonanno et al. 1976; Mironov et al. 1978; Peikov & Rusev 1988; Brocato et al. 1996; Sato et al. 1989; von Braun et al. 2002; Hargis et al. 2004). von Braun et al. (2002) presented extinction map and reported small differential reddening across the cluster. The mean value of reddening in the cluster’s direction is (Harris et al. 1996, 2010 edition). De Marchi et al. (2006) found that M12 has a very flat mass function and also discussed the tidal disruption time for this cluster.
Most of the previous studies of variable stars of M12 suggested that M12 is a variable devoid cluster. Clement et al. (2001) listed only one W Virginis type star summarizing the variable studies done by that time. von Braun et al. (2002) found two W Uma type variables. A recent extensive study by Kaluzny et al. (2015) found 36 variables in M12, 34 of which are new discovery. A review of M12 variables can be found in Kinman (2016) which also includes five variables taken from GUVV2 catalog of GALEX far-ultraviolet variables by Wheatley et al. (2008). Simunovic & Puzia (2014) present dynamical study of the blue straggler stars in M12 and used radial velocity measurements to separate non-members. Lu et al. (2009) detected six X-ray sources inside the half-mass radius (216) of the cluster, of which two are inside the core radius (072). Using Fermi large area telescope, Zhang et al. (2016) provided the evidence of gamma-ray emission from M12. Pietrukowicz et al. (2008) could not detect any dwarf novae in M12. M12 is also known to harbor some “UV bright stars” (Zinn et al. 1972; Harris et al. 1983; Geffert et al. 1991).
M12 is particularly appealing for abundance analysis to evaluate difference between halo and disk cluster systems (Johnson & Pilachowski 2006). Klochkova & Samus (2001) did abundance analysis of three stars and observed the post AGB star K 413. Johnson & Pilachowski (2006) presented chemical abundances and radial velocities for 21 RGB and asymptotic giant branch stars. Carretta el al. (2007) determined O and Na abundances as well as Fe abundances for 79 RGB stars from 1 mag below the RGB bump to near the RGB tip. They also did abundance analysis and found that Na-O anticorrelation must have been established in the early times of the cluster formation. D’Orazi et al. (2014) studied Li and Al abundances for a large sample of RGB stars in M12 and found that first-generation and second-generation stars share the same Li content in M12.
Sollima et al. (2016) presented an observational estimate of the fraction and distribution of dark mass in the innermost region of the cluster. Lehman & Scholz (1997) derived the structural parameters of M12 and compared their results with the values mentioned in literature. Roederer (2011) found that M12 does not show any evidence of -process dispersion.
Radial velocities of the cluster are studied by Rastorguev & Samus (1991); Kiss et al. (2007); Kimmig et al. (2015). Geffert et al. (1991) provided PMs and membership probabilities of 165 stars, including 13 UV-bright stars in the cluster region using photographic plates.
Tucholke et al. (1988) presented orbital parameters for M12. Space motion of the cluster has been studied by various authors (Brosche et al. 1991; Scholz et al. 1996; Odenkirchen et al. 1997; Dinescu et al. 1999). The absolute PM of M12 has been listed as mas yr-1, mas yr-1 by Dinescu et al. (1999). A PM study of M12 was conducted by Zloczewski et al. (2012) (hereafter, Zl12) which presents relative PMs of stars in the cluster’s central region (8.829.04 arcmin2). Recently, Narloch et al, (2017) also provided PMs in the region of M12.
It is obvious from the above discussion that M12 serves as an interesting object for spectroscopy and a membership catalog in the wider region of the cluster will help in selecting the sample for abundance analysis. Mosaic CCDs have enabled PM study of star clusters to deeper magnitudes, in a wider region apart from reducing the required time-gap (e.g. Anderson et al. 2006; Yadav et al. 2008, 2013; Bellini et al. 2009; Sariya et al. 2012, 2017a, 2017b; Sariya & Yadav 2015). In this study, we conduct a PM study of M12 in a wide region (14.6016.53 arcmin2) of the cluster’s field.
| Epoch | Filters | Exposure time | Seeing | Airmass |
|---|---|---|---|---|
| (seconds) | (arcsec) | |||
| First | 2240 | 0.9 | 1.1 | |
| 1240 | 1.0 | 1.1 | ||
| 2240 | 0.9 | 1.1 | ||
| Second | 1300, 2250 | 1.5 | 1.4 | |
| 3250 | 1.8 | 1.5 |
Section 2 discusses the sample of archive data used in this work. Derivation of the PMs and astrometric and photometric calibration is performed in Section 3. We discuss the decontamination of field stars in vector point diagrams (VPDs) and color-magnitude diagrams (CMDs) in Section 4. In Section 5, we outline the method to calculate membership probabilities and compare our results with Zl12. A context of this work is presented in Section 6, where we also briefly summarize the membership catalog. It is followed by the conclusions in Section 7.

2 Sample of Archive Images
The M12 images used in this research are taken from the ESO archive. The data are observed with 2.2 m ESO/MPI telescope at La Silla, Chile. This telescope contains a mosaic camera with a combination of 8 EEV CCDs, each having the dimension of 2k4k pixels. The images used in this work were obtained between 14th May 1999 and 06th June 2010, thus providing an epoch gap of 11.1 years. The observational log of scientific images with observational area of 3433 arcmin2 is provided in Table 1. The seeing conditions for the first epoch images are between 0.9–1.0 arcsec and airmass values are 1.1. The second epoch -band images have seeing values of arcsec and airmass values are . The band images from the second epoch were not used for the PM work. They were used only to include -magnitude in our catalog.
3 Reduction and Calibration of the Data
The data reduction of the WFI archive images was pursued using the exclusive astrometric software presented by Anderson et al. (2006, hereafter A06). Once the images are dealt with initial steps like bias and flat-field corrections, the Point Spread Function (PSF) is the most crucial factor. PSF deals with determination of the star positions and fluxes. Unfortunately, the shape of the PSF changes across the mosaic CCD system, therefore, we can not construct a single PSF model for the entire CCD systems. A06 designed the program in such a way that the choice of number of PSFs per chip can vary from 1 to 15 per CCD chip depending on the richness of the field. We used an array of 15 PSFs (35) for each CCD chip, thus making 120 total PSFs for the entire mosaic system. The PSF we use is an PSF represented by a very fine grid. The fine grid comes from dividing each pixel in 4 equal parts. Each PSF is extended to a radius of 25 pixels, thus giving 201201 grid points for every PSF. The PSF is adjusted so as to be centered on the central gridpoint (101,101).
The second most crucial factor faced by such an analysis is the geometric distortion. The pixel scale across the wide field-of-view does not remain uniform due to geometric distortion in WFI@2.2 m. A06 present a 917 elements look-up table to account for the geometric distortion. A06 derived these corrections by observing Galactic bulge in Baade’s window with optimally dithered observations. To achieve the corrections for a given location on the CCD chip, the routine uses a bi-linear interpolation among the four closest gridpoints. Unfortunately, the distortion correction may not work perfectly owing to the fact that the distortion correction is less reliable towards the edges of the CCDs as well as the distortion may change with time.
To remove the aforementioned uncertainty in geometric distortion, we use a self-calibration process, called the local transformation approach. The basic idea of this approach is similar to the classical “plate-pair method”(e.g., Sanders 1971; Tian et al. 1998). In the local transformation approach, some local reference stars are used around each target star. Cluster stars are preferred to be used because they have a lower value of dispersion. We begin with selecting the stars by making blue and red envelopes to define sequences in the CMD around the main sequence, sub giant and red giant branch. Further, the stars are selected using PMs and the process is iterated. Once the locations of the stars are known in all frames, we use a linear transformation comprising six parameters (three parameters in each of the two coordinates) between frames. The local transformation approach can be used for all possible combinations for the first and second epoch images. Taking average of all possible displacements between different epochs will provide the relative PMs. Because intra-epoch displacements do not play a role in PMs, they are used to determine PM errors.
3.1 Astrometric Calibrations
The astrometric calibration of the pixel positions was carried out using ESO SKYCAT software. IRAF111IRAF is distributed by the National Optical Astronomical Observatory which is operated by the Association of Universities for Research in Astronomy, under contact with the National Science Foundation tasks and were used for this aim and the rms of the transformations was found to be mas. A single plate model consisting of linear and quadratic terms and a small but significant cubic term was used. The precision in defining distortion correction and the stability of intra-chip positions made it possible to use this single plate model. This model also gets rid of the impressions generated by the differential refraction.
3.2 Photometric Calibrations
To convert the instrumental to standard magnitudes we used the secondary standard stars provided by P. Stetson222http://www3.cadc-ccda.hia-iha.nrc-cnrc.gc.ca/community/STETSON/standards/. The number of secondary standard stars used for transformations are 67, 66, 44 and 62 in , , and filters. The magnitudes and colors range of standard stars are 1519.5, 0.11.3, 0.30.6 and 0.21.5.
The transformation equations used to calibrate the magnitudes are
,
where, subscripts “ins” and “std” represent the instrumental and standard magnitudes. and represent the zeropoints in , , and filters respectively. The color term values are 0.39, 0.11, 0.03 and 0.10 while zeropoints are 24.77, 23.83, 24.10 and 23.27 for , and filters respectively. The present values are very close to the values mentioned on the WFI@2.2 m webpage333www.eso.org/sci/facilities/lasilla/instruments/wfi/inst/zeropoints.html.
The photometric rms with calibrated magnitudes is shown in Fig. 1. A few brighter stars have more errors because of saturation and crowding. The bright star at mag is located towards the CCD edge in our catalogue where crowding is not a problem. So, it has relatively less photometric errors. Photometric errors for saturated stars located in the central region of the cluster are higher. However, since the distortion solution is poor towards the outer region for this CCD imager, this bright star () has larger PM errors as shown in Fig. 2. The photometric standard deviations for individual photometric bands were determined using multiple observations, all reduced to a common reference frame. For mag, the mean values of errors are 0.005 mag for and filters, 0.01 mag for band and 0.07 mag for the band magnitudes.
4 M12 PMs, VPD and CMD
To derive the PMs of the stars in the cluster region, we need at least two epochs data. For this cluster M12, we have CCD data available in 1999 and 2010 epoch. The time baseline of 11.1 years for this cluster is suitable for the separation of cluster stars from field stars. Five images in the first epoch and three images in the second epoch in filters are used to determine PMs. Due to poor image quality, R filter images from the 2010 epoch were not used during the PM calculation process. To transform the coordinates from one epoch to second epoch, cluster sequence stars have been used as a first guess. These selected stars have magnitudes range between 13 and 19 mag with PM errors 2 mas yr-1. To minimize the effect of uncorrected distortion residuals, a local transformation approach based on the closest 25 stars on the same CCD was applied. No systematics larger than random errors near the corners or edges of the CCD chips were found. The PM calculating routine was iterated subsequently and it helped in removing some stars from the initial photometric members list. Even if the colors of some stars were such as to place them on the fiducial cluster sequences in the CMD, they were removed from the preliminary members list if their PMs were inconsistent to make them fit for cluster membership.
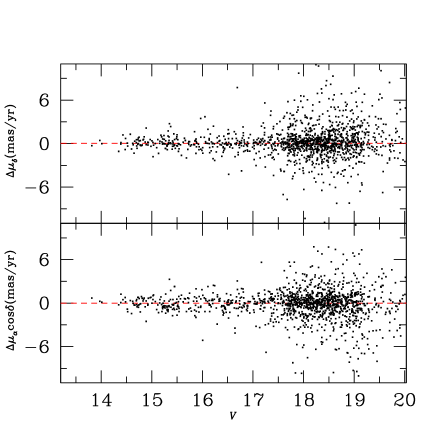
Figure 2 represents the distribution of PMs in both and directions and their standard errors as a function of magnitude. The median values of PM error is 0.7 mas yr-1 for stars brighter than 20 mag.
The underlying beauty of PMs in a globular cluster is to distinguish the cluster sample from the field stars, thereby, producing a CMD with most likely cluster members. This is evident in Fig. 3. PMs in both directions are plotted as the vector point diagrams (VPDs) in the top panels of the figure. The respective CMDs are shown in the bottom panels of Fig. 3. In the left panels of this figure, the entire sample of stars studied here is plotted. In the middle panels, the preliminarily assumed cluster members are shown, while the right panels show the assumed field stars. In the top panels of the VPD, a circle of radius 5.4 mas yr-1 is shown around the centroid of PMs of stars. This serves as a provisional criterion to decide on the cluster member stars. This radius is chosen in such a way to include maximum possible cluster members while noticing its effect on the CMD in decontaminating the field stars. However, some cluster members having poorly measured PMs can be lost and some field stars sharing their motion with M12 may get included as preliminary members. The fact that the distribution of cluster members’ PM is round, gives the implication that the present PM analysis is not influenced by any sort of systematics.
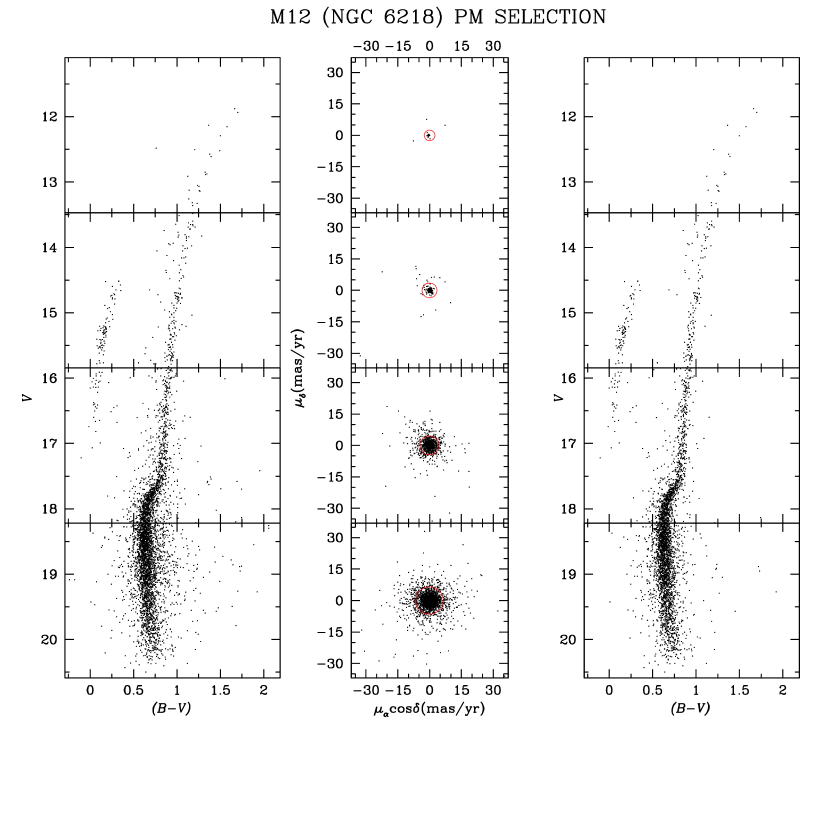
Magnitude-binned versus CMDs and corresponding VPDs are plotted in Figure 4. The point to note here is that we adopted different selection criteria for different magnitude bins such as the criterion becomes less restrictive towards the fainter magnitude bins. The middle panels show the PM VPDs while the binned-CMD of likely cluster members is shown in the right panels. The value of PM errors for the bins increase from 1.2 mas yr-1 to 2.5 mas yr-1 from brightest down to faintest bins. Likewise, the radii of the circle in the VPDs vary from 2.5 mas yr-1 to 6.5 mas yr-1 in the same order. It is evident that we obtained a good separation of field stars up to 18 mag and the measurement errors take over after that.
5 The Cluster Membership
Proper motions are frequently used to determine kinematical membership probabilities. In our study of M12, we used the membership calculation method presented by Balaguer-Núñez et al. (1998). This method has been previously used for WFI data of star clusters (Bellini et al. 2009, Sariya et al. 2012, 2017a; Yadav et al. 2013; Sariya & Yadav 2015). The membership in this method is determined by the superposition of two different frequency distribution functions. For the cluster and field star distributions, two different distribution functions () and () are constructed for a particular ith star. Neglecting the spatial distribution of the stars, the values of frequency distribution functions are given as follows:
exp
and
exp
where (, ) are the PMs of star.
The PM errors are represented by (, ).
The cluster’s PM center is given by
(, )
and (, ) represent the center of field PM values.
The intrinsic PM dispersion for the cluster stars is denoted by
, whereas and provide the
intrinsic PM dispersions for the field populations. The correlation coefficient is calculated as:
.
Only the stars with PM errors 2 mas yr-1 are used in calculating and . As expected from the VPD, the center of the cluster stars is found to be (, )=(0, 0) mas yr-1. The intrinsic PM dispersion for the cluster stars () could not be determined reliably using our PM data. Kimmig et al. (2015) compared their results with the literature values for radial velocity data and listed the best fit value of radial velocity dispersion for M12 as 4.3 km sec-1. Considering the value of distance of M12 as 4.8 kpc (Harris 1996, 2010 edition), the internal PM dispersion () becomes 0.19 mas yr-1. For the field population, we have (, ) = (5.9, 5.8) mas yr-1 and (, ) = (3.6, 3.9) mas yr-1. The mentioned field parameters are determined considering the field stars lying on the top left corner of the VPDs (Fig. 3) as the field stars because the field motion is more significant towards that region. This selection is further justified by looking at the magnitude-binned panels in Fig. 4 where field stars upto magnitude show their clear distribution in the chosen direction. The stars fainter than do not have much clear distribution in a particular direction due to increasing PM errors.
Considering the normalized numbers of cluster stars and field stars as
and respectively
(i.e., ), the total distribution function can be calculated as:
,
As a result, the membership probability for the star is given by:
.


A plot of cluster membership probabilities with magnitude is shown in Figure 5. It is evident from the figure that the cluster stars and field stars show separation as two separate distributions of stars near the membership values 100 and 0. For the stars fainter than 18 mag, the increasing measurement errors make the separation ambiguous with more stars falling at intermediate values of membership probabilities. For these stars, the mean values of Pμ for cluster members is falling, while it is rising for the field stars. A histogram of the membership probabilities is shown in Fig. 6. Total number of stars shown in the histogram are 3725. We have 1320 stars with membership probability value less than 10%. The most probable cluster members, stars with 90 are 1565 in number.
CMD of 1798 stars having membership probabilities is shown in Fig. 7. This CMD exhibits clear cluster sequences for stars brighter than mag. Also, this CMD shows stars of various evolutionary stages like sub-giants, red giants, horizontal branch stars and blue stragglers. All the cluster sequences in this CMD look cleaner with minimal field star contamination. M12 is known to have a CMD very similar to another globular cluster M10 (von Braun et al. 2002). Also, the CMD exhibits an extremely blue horizontal branch. Jasniewicz et al. (2004) list the HB morphology parameter (Buonanno et al. 1997) of this cluster as 0.80.
5.1 Comparison with Zl12
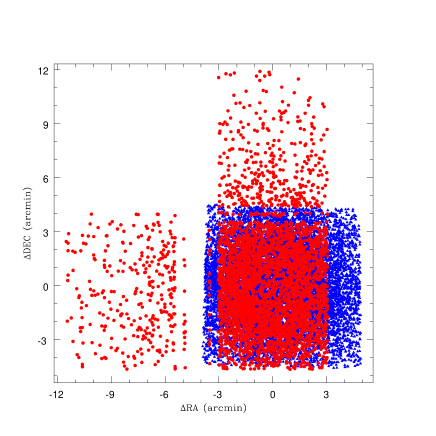
We compared the results of the present work with the catalog provided by Zl12. The comparison was done in the spatial distribution of the stars as well as between the PMs of both catalogs. Figure 8 shows the spatial distributions of both catalogs with different colors. It is evident that our catalog (red filled circles) covers a wider region of the cluster than Zl12 (blue triangles). We have PM information for about 662 stars in the additional area we studied than the field covered by Zl12. The differences in PMs in both directions for the common stars between the two catalogs is presented in Fig. 9. The red dotted lines in the figure show the 3-clipped median of the PM differences as mas yr-1 and mas yr-1. Our PMs are clearly in consistence with those presented by Zl12 up to 20 mag.
| Variables | GUVV2 Variables | ||||
| IDV | Pμ | ID | IDV(UV) | Pμ | ID |
| (%) | (%) | ||||
| V6 | 97.03 | 3561 | 334 | 99.11 | 695 |
| V8 | 98.24 | 460 | 336 | 58.15 | 3022 |
| V12 | 96.97 | 760 | |||
| V18 | 00.00 | 428 | |||
| V22 | 99.04 | 769 | |||
| V23 | 99.22 | 410 | |||
| V24 | 00.54 | 985 | |||
| V25 | 99.04 | 417 | |||
| V28 | 95.40 | 642 | |||
| V29 | 99.39 | 133 | |||
| V36 | 98.70 | 426 |
| X-ray sources | Blue Stragglers | ||||
| IDX | Pμ | ID | IDB | Pμ | ID |
| (%) | (%) | ||||
| CX1 | 98.97 | 570 | BSS1 | 95.96 | 381 |
| CX2 | 99.27 | 548 | BSS3 | 99.22 | 410 |
| CX3 | 00.00 | 1663 | BSS9 | 90.88 | 565 |
| CX4 | 98.48 | 478 | BSS19 | 92.28 | 238 |
| CX8 | 99.44 | 1676 | BSS20 | 98.38 | 299 |
| CX9 | 41.14 | 1957 | BSS22 | 99.04 | 417 |
| CX10 | 00.09 | 2186 | BSS27 | 81.89 | 551 |
| CX12 | 00.09 | 1477 | BSS30 | 99.04 | 769 |
| CX18 | 98.21 | 1922 |
6 Discussion
6.1 Membership of Peculiar Stars
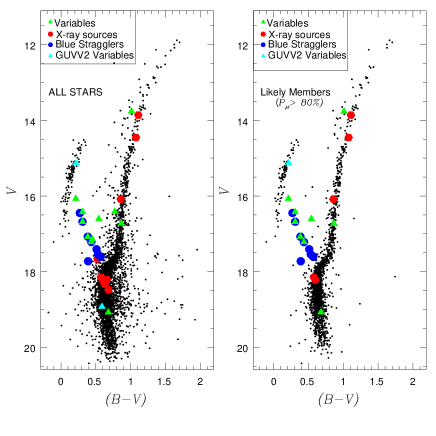
The credit to search most of the variables of M12 goes to the extensive study by Kaluzny et al. (2015). Including two already discovered variables, they reported 36 variables in the region of M12. We found 11 variables out of these and list their membership status in Table LABEL:var01. It can be inferred from the table that except V18 and V24 for which 0, all the other discovered variables (V6, V8, V12, V22, V23, V25, V28, V29 and V36) are most likely cluster members. Kaluzny et al. (2015) also mentioned the membership status of these variables based on the Zl12 catalog. The membership status determined by us agrees with Kaluzny et al. (2015) for all the variables except V24. Wheatley et al. (2008) provided a catalog (GUVV2) of far-ultraviolet variables using . Kinman (2016) presented a list of 4 far-UV variables in the cluster region using GUVV2 catalog. Their membership status is given in Table LABEL:var01 where it can be seen that one of the far-UV variables ( IDV(UV)=334) belongs to the cluster. Lu et al. (2009) detected 20 X-ray sources using Chandra X-ray observatory data in the direction of M12. Their membership status is shown in Table LABEL:var02. Among the X-ray counterparts we found in our catalog, 5 sources (CX1, CX2, CX4, CX8, CX18) have their membership probability 98. They are most likely cluster members. Three X-ray sources (CX3, CX10 and CX12) have zero membership probability. So, they should not be the cluster members. Simunovic & Puzia (2014) carried out medium-resolution spectroscopy of the cluster and reported some blue stragglers in the cluster. As can be seen in Table LABEL:var02, all of the 8 blue stragglers we found are having 81. They all should be belonging to M12 according to our catalog. Figure 10 shows all the above mentioned sources in the CMD of M12. CMD on the left shows all the objects listed in Tables LABEL:var01 and LABEL:var02, whereas the CMD in the right panel is plotted with only the stars with membership probabilities 80%. Variables, blue stragglers and X-ray sources shown in the right panel are most likely cluster members.
6.2 The Electronic Catalog
The electronic catalog provides photometric and kinematical data for 3725 stars in the region of globular cluster M12. The catalog includes relative PMs, PM errors, membership probabilities, photometry with rms errors. For a few stars, band photometry is missing. For those stars, a flag equal to 99.9999 for the magnitude and 0.9999 for the error is set. A small sample from the electronic catalog along with the header information is shown in Table LABEL:cata.
| ID | X | Y | B | V | I | ||||||||||||
|---|---|---|---|---|---|---|---|---|---|---|---|---|---|---|---|---|---|
| (1) | (2) | (3) | (4) | (5) | (6) | (7) | (8) | (9) | (10) | (11) | (12) | (13) | (14) | (15) | (16) | (17) | (18) |
| [h:m:s] | [d:m:s] | [pixel] | [pixel] | [mas/yr] | [mas/yr] | [mas/yr] | [mas/yr] | [mag] | [mag] | [mag] | [mag] | [mag] | [mag] | [mag] | [mag | [] | |
| 1 | 16:47:23.05 | -2:01:32.9 | 232.0060 | 222.3470 | 11.6618 | 0.4078 | 4.2128 | 0.4528 | 18.8176 | 0.0044 | 17.8204 | 0.0074 | 99.9999 | 0.9999 | 16.5937 | 0.0027 | 00.00 |
| 2 | 16:47:07.55 | -2:01:32.1 | 1209.5560 | 228.9769 | -0.6224 | 0.6910 | 0.4657 | 0.1974 | 17.5601 | 0.0011 | 16.7414 | 0.0003 | 99.9999 | 0.9999 | 15.6213 | 0.0033 | 97.45 |
| 3 | 16:46:41.64 | -2:01:33.0 | 2843.5877 | 229.9219 | -3.8028 | 0.3026 | -3.4745 | 0.4292 | 17.9565 | 0.0039 | 17.2342 | 0.0030 | 99.9999 | 0.9999 | 16.2220 | 0.0044 | 00.00 |
| 4 | 16:47:03.98 | -2:01:32.0 | 1434.2728 | 229.9849 | -0.3477 | 0.3026 | 0.4399 | 0.7511 | 14.2924 | 0.0055 | 13.0543 | 0.0041 | 99.9999 | 0.9999 | 11.5623 | 0.0105 | 98.74 |
| 5 | 16:47:12.26 | -2:01:31.1 | 912.3842 | 232.2896 | -0.2361 | 0.4829 | 0.9142 | 0.6395 | 15.6701 | 0.0000 | 14.6978 | 0.0047 | 99.9999 | 0.9999 | 13.4579 | 0.0005 | 97.75 |
| 6 | 16:47:03.83 | -2:01:26.1 | 1443.7522 | 254.8846 | 0.3176 | 0.0751 | -0.0494 | 0.5387 | 16.1591 | 0.0049 | 15.2463 | 0.0047 | 99.9999 | 0.9999 | 14.0490 | 0.0077 | 99.65 |
| 7 | 16:47:14.38 | -2:01:23.2 | 778.2754 | 264.8420 | 2.9659 | 0.2790 | 1.7212 | 0.2768 | 17.6799 | 0.0077 | 16.8928 | 0.0019 | 99.9999 | 0.9999 | 15.9671 | 0.0137 | 00.00 |
| 8 | 16:47:14.57 | -2:01:21.9 | 766.4338 | 270.2744 | 0.3734 | 0.1416 | 0.1652 | 0.3520 | 16.7270 | 0.0022 | 15.8435 | 0.0047 | 99.9999 | 0.9999 | 14.7108 | 0.0005 | 99.65 |
| 9 | 16:47:10.68 | -2:01:21.1 | 1011.7539 | 274.2942 | -1.8306 | 0.8026 | -2.8371 | 1.7212 | 18.5638 | 0.0033 | 17.8655 | 0.0261 | 99.9999 | 0.9999 | 16.9932 | 0.0028 | 43.65 |
| 10 | 16:47:14.13 | -2:01:20.6 | 794.4010 | 276.0190 | 0.3584 | 1.1782 | -0.1438 | 0.5065 | 17.9872 | 0.0005 | 17.1587 | 0.0074 | 99.9999 | 0.9999 | 16.0792 | 0.0016 | 99.04 |
| 11 | 16:47:10.98 | -2:01:20.0 | 992.6786 | 279.0387 | 0.3305 | 0.6245 | -0.3605 | 0.2597 | 18.4346 | 0.0050 | 17.6889 | 0.0003 | 99.9999 | 0.9999 | 16.6920 | 0.0049 | 99.39 |
7 Conclusions
In the present analysis, we have performed an astrometric and photometric investigation on the globular cluster M12. Following conclusions can be drawn from the analysis.
-
1.
A catalog of PMs and membership probabilities for 3725 stars in the region of M12 has been presented.
-
2.
PM catalog produced in the wide field region has been used to isolate cluster stars from field stars and presented a clean CMD of M12.
-
3.
The membership catalog has been used to ascertain the membership status of variable stars, blue stragglers and -ray sources reported earlier in the cluster’s direction.
Acknowledgements.
We are grateful to the reviewer of this paper for very useful and constructive comments. Devesh P. Sariya and Ing-Guey Jiang are supported by the grant from the Ministry of Science and Technology (MOST), Taiwan. The grant numbers are MOST 103-2112-M-007-020-MY3, MOST 104-2811-M-007-024, MOST 105-2811-M-007 -038, MOST 105-2119-M-007 -029 -MY3, MOST 106-2112-M-007 -006 -MY3 and MOST 106-2811-M-007 -051. This research is based on the observations with the MPG/ESO 2.2 m and ESO/VLT telescopes, located at La Silla and Paranal Observatory, Chile, under DDT programs 163.O-0741(C), 085.A-9008(A) and the archive material. This research used the facilities of the Canadian Astronomy Data Centre operated by the National Research Council of Canada with the support of the Canadian Space Agency.References
- (1) Anderson, J., Bedin, L. R., Piotto, G., Yadav, R. K. S., Bellini, A., 2006, A&A, 454, 1029, [A06]
- (2) Anderson, J., Piotto, G., King, I. R., Bedin, L. R., & Guhathakurta, P., 2009, ApJL, 697, L58
- (3) Balaguer-Núñez, L., Tian, K. P., Zhao, J. L., 1998, A&AS, 133, 387
- (4) Bedin, L. R., Piotto, G., Anderson, J., et al. 2004, ApJL, 605, L125
- (5) Bellini, A., Piotto, G., Bedin, L. R., et al., 2009, A&A, 493, 959
- (6) Brocato E., Buonanno R., Malakhova Y., Piersimoni A. M., 1996, A&A, 311, 778
- (7) Brosche P., Tucholke, H.-J., Klemola, A. R., et al., 1991, AJ, 102, 2022
- (8) Buonanno R., Castellani, V. & Smriglio, F., 1976, Ap&SS, 41, 3
- (9) Buonanno R., Corsi C. E., Bellazzini M., Ferraro F. R. et al., 1997, AJ, 113, 706
- (10) Carretta E., Bragaglia A., Gratton R. G. et al., 2007, A&A, 464, 939
- (11) Clement C. M., Muzzin A., Dufton Q., Ponnampalam T., Wang J. et al. 2001, AJ, 122, 2587
- (12) D’Orazi V., Angelou G. C., Gratton R. G. et al., 2014, ApJ, 791, 39
- (13) D’Orazi V., Gratton R. G., Angelou G. C. et al., 2015, MNRAS, 449, 4038
- (14) De Marchi G., Pulone L., & Paresce F., 2006, A&A, 449, 161
- (15) Dinescu D. I., Girard T. M., van Altena W. F., 1999, AJ, 117, 1792
- (16) Geffert M., Tucholke H.-J., Georgiev Ts. B., LeChampion, J.-F., 1991, A&AS, 91, 487
- (17) Hargis J. R., Sandquist, E. L., & Bolte M. 2004, ApJ, 608, 243
- (18) Harris, H.-C., Nemec, J. M., & Hesser J. E., 1983. PASP, 95, 256
- (19) Harris, W. E., 1996, AJ, 112, 1487
- (20) Jasniewicz G., de Laverny, P., Parthasarathy, M. et al., 2004, A &A, 423, 353
- (21) Johnson C. I., & Pilachowski C. A. 2006, AJ, 132, 2346
- (22) Kaluzny J., Thompson, I. B., Dotter A., Rozyczka M., et al., 2015, AcA, 150, 155
- (23) Khamidullina D. A., Sharina M. E., Shimansky V. V., Davoust E., 2014, Baltic Astronomy, 230, 260
- (24) Kimmig B., Seth A., Ivans I. I. et al., 2015, AJ, 149, 53
- (25) Kinman T. D., 2016, Commissions 27 and 42 of the IAU information bulletin on variable stars (IBVS), Number 6159
- (26) Kiss L. L., Szekely, P., Bedding, T. R., 2007, ApJ, 659, L129
- (27) Klochkova V. G., & Samus N. N., 2001, A&A, 378, 455
- (28) Lee Y.-W., Demarque P., & Zinn, R., 1994, ApJ, 423, 248
- (29) Lehmann I., Scholz, R.-D., 1997, A&A, 320, 776
- (30) Lu T.-N., Kong, A. K. H., Bassa, C. et al., 2009, ApJ, 705, 175
- (31) Milone, A. P., Marino, A. F., Piotto, G., et al., 2012, ApJ, 745, 27
- (32) Mironov A. V., Samus N. N., & Shugarov S. Y., 1978, Astron. Tsirk, 1003, 1
- (33) Narloch, W., Kaluzny, J., Poleski, R., et al. 2017, MNRAS, 471, 1446
- (34) Nassau J. J. & Hynek, J. A., 1946, PAAS, 10, 232
- (35) Odenkirchen M., Brosche P., Geffert M., Tucholke H.-J., 1997, New Astronomy. 2, 477
- (36) Peikov Z. I., & Rusev, R. M., 1988, SvA, 32, 21
- (37) Pietrukowicz P., Kaluzny J., Schwarzenberg-Czerny, A. et al. 2008, MNRAS, 388, 1111
- (38) Pritzl B. J., Venn K. A., & Irwin M., 2005, AJ, 130, 2140
- (39) Racine R., 1971, AJ, 76, 331
- (40) Rastorguev A. S., Samus, N. N., 1991, SvAL, 17, 388
- (41) Roederer I. U., 2011, ApJ, 732, L17
- (42) Rutledge G. A., Hesser J. E., & Stetson P. B. 1997, PASP, 109, 907
- (43) Salaris M., Riello M., Cassisi S., & Piotto, G. 2004, A&A, 420, 911
- (44) Sato T., Richer, H. B., & Fahlman, G. G., 1989, AJ, 98, 1335
- (45) Sanders, W. L., 1971, A&A, 15, 368
- (46) Sariya, D. P., Yadav, R. K. S., Bellini, A., 2012, A&A, 543, A87
- (47) Sariya, D. P., Yadav, R. K. S., 2015, A&A, 584, A59
- (48) Sariya D. P., Jiang I.-G., & Yadav R. K. S., 2017a, AJ, 153, 134
- (49) Sariya D. P., Jiang I.-G., & Yadav R. K. S., 2017b, in Proceedings of the international Astronomical Union(IAU) symposium, ‘Astrometry and AStrophysics in the Gaia Era’ held 24-28th April, 2017 at Nice France, vOL. 330, A. Recio-Blanco, P. de Laverny, A.G.A. Brownk & T. Prusti, eds., 2017, p. 251-252.
- (50) Scholz, R.-D., Odenkirchen M., Hirte, S., et al. 1996, MNRAS, 278, 251
- (51) Simunovic, M., & Puzia, T. H., 2014, RevMexAA (Serie de Conferencias), 44, 57
- (52) Sollima, A., Ferraro F. R., Lovisi L., et al., 2016, MNRAS, 462, 1937
- (53) Tian, K.-P., Zhao, J.-L., Shao, Z.-Y., Stetson, P. B., 1998, A&AS, 131, 89
- (54) Tucholke, H.-J., Brosche P., Geffert, M., 1988, in IAUS Symposium 126, Globular Cluster Systems in Galaxies, ed. J. E. Grindlay, A. G. D. Philip, p. 525, drodrecht: Kluwer. 751 pp.
- (55) von Braun K., Mateo M., Chiboucas K., & Athey A., 2002, AJ., 124, 2067.
- (56) Wheatley J., Welsh B., & Browne S., 2008, AJ, 136, 259
- (57) Yadav, R. K. S., Bedin, L. R., Piotto, G. et al., 2008, A&A, 484, 609
- (58) Zhang P. F., Xin, Y. L., Fu, L., et al., 2016, MNRAS, 459, 99
- (59) Zinn R. J., Newell E. B., & Gibbson J. B., 1972, A&A, 18, 390
- (60) Zinn R.; West M. J., 1984, ApJS, 55, 45
- Zloczewski et al. (2012) Zloczewski, K., Kaluzny, J., Rozyczka, M., Krzeminski, W., Mazur, B., Thompson, I. B. 2012, Acta Astronomica, 62, 357