Discovery of OH absorption from a galaxy at 0.05: implications for
large surveys with SKA pathfinders
Abstract
We present the first detection of OH absorption in diffuse gas at , along with another eight stringent limits on OH column densities for cold atomic gas in galaxies at . The absorbing gas detected towards Q0248+430 (=1.313) originates from a tidal tail emanating from a highly star forming galaxy G0248+430 (=0.0519) at an impact parameter of 15 kpc. The measured column density is (OH) = (6.30.8)1013()() cm-2, where and are the covering factor and the excitation temperature of the absorbing gas, respectively. In our Galaxy, the column densities of OH in diffuse clouds are of the order of (OH)1013-14 cm-2. From the incidence (number per unit redshift; ) of H i 21-cm absorbers at and assuming no redshift evolution, we estimate the incidence of OH absorbers (with log (OH)13.6) to be = at . Based on this we expect to detect 10 such OH absorbers from the MeerKAT Absorption Line Survey. Using H i 21-cm and OH 1667 MHz absorption lines detected towards Q0248+430, we estimate () = (5.24.5), where , the fine structure constant, the electron-proton mass ratio and the proton gyromagnetic ratio. This corresponds to () = (1.7 1.4), which is among the stringent constraints on the fractional variation of .
Subject headings:
quasars: absorption lines — galaxies: ISMI. Introduction
The hydroxyl radical (OH) was the first interstellar molecule to be detected at radio wavelengths (Weinreb et al., 1963). Since then there have been extensive surveys of OH emission and absorption from diffuse ((OH)1013-14 cm-2) and dense ((OH)1015-16 cm-2) interstellar clouds in the Galaxy (e.g. Dickey et al., 1981; Wannier et al., 1993; Li et al., 2018), and along with HCO+, it has emerged as one of the best indicators of H2 column densities (Liszt & Lucas, 1999). It is most commonly observed in 18-cm ground state transitions which occur at rest frequencies of 1665.402 and 1667.359 (main lines), and 1612.231 and 1720.530 MHz (satellite lines). The relative strengths of these lines are rarely found to be in the local thermodynamic equilibrium (LTE) ratios i.e. 1612:1665:1667:1720 MHz = 1:5:9:1. They often exhibit maser emission in regions associated with high density and far-infrared (FIR) radiation (Cohen, 1995).
OH Megamasers (OHMs), being a good tracer of extreme starburst activity and merger history, have also been extensively surveyed in luminous infrared galaxies (LIRGs), and already been detected up to (e.g. Baan, 1989; Darling & Giovanelli, 2002; Fernandez et al., 2010). Furthermore, the detection of main lines and the so-called conjugate behaviour of the satellite lines have been reported towards a handful of radio bright AGNs (e.g. van Langevelde et al., 1995; Darling, 2004). But OH has been very rarely searched in normal star-forming galaxies (e.g. Borthakur et al., 2011; Zwaan et al., 2015). Specifically, from the literature there is only one sight line, 4C+57.23 (Zwaan et al., 2015), which satisfies the selection criteria of the study presented here. To date, only three intervening OH absorbers at are known: (i) J01340931 (; Kanekar et al., 2005); (ii) B0218+357 (; Chengalur & Kanekar, 2003); and (iii) PKS 1830211 (; Chengalur et al., 1999). These have led to some of the most stringent () constraints on the fractional variations of fundamental constants of physics (Uzan, 2011). In all three cases, the absorbing gas is from a lensing galaxy and the (OH)1015-16 cm-2 i.e. similar to dense molecular clouds in the Galaxy.
In this paper, we report the first survey of OH main-line absorption from cold atomic gas, as revealed by H i 21-cm absorption (Heiles & Troland, 2003), in a sample of galaxies. Throughout this paper we use the CDM cosmology with =0.27, =0.73 and Ho=71 km s-1 Mpc-1.
| Quasar | Galaxy | (H i) | Ref.∗ | Peak flux | Spectral | Spectral | (OH)◇ | ||
| density | resolution | rms | |||||||
| (km s-1) | (mJy beam-1) | (km s-1) | (mJy beam-1) | (km s-1) | |||||
| (1) | (2) | (3) | (4) | (5) | (6) | (7) | (8) | (9) | (10) |
| Quasar-galaxy pairs | |||||||||
| 3C232 | NGC3067 | 0.530 | 0.0049 | 0.11 | 1 | 1563 | 1.4 | 1.7 | 0.006 |
| Q0248+430 | G0248+430 | 1.313 | 0.0519 | 0.43 | 2 | 1207 | 1.5 | 2.1 | 0.080.01§ |
| J084957.97+510829.0 | J084958.10+510826.6 | 0.584 | 0.3120 | 0.95 | 3 | 200 | 0.9 | 3.9†, 4.4‡ | 0.091 |
| J104257.58+074850.5 | J104257.74+074751.3 | 2.665 | 0.0332 | 0.19 | 5 | 295 | 1.5 | 1.5 | 0.027 |
| J124157.54+633241.6 | J124157.26+633237.6 | 2.625 | 0.1430 | 2.90 | 6 | 67 | 1.6 | 1.2 | 0.099 |
| J124355.78+404358.5 | 124357.15+404346.5 | 1.520 | 0.0169 | 2.24 | 7 | 187 | 1.4 | 1.3 | 0.035 |
| J144304.53+021419.3 | Emission-lines | 1.820 | 0.3714 | 3.38 | 3 | 144 | 2.0 | 1.4 | 0.059 |
| J163956.35+112758.7 | J163956.38+112802.1 | 0.993 | 0.0790 | 15.7 | 8 | 152 | 1.6 | 1.4† | |
| Merging galaxy pair | |||||||||
| J094221.98+062335.2 | - | - | 0.1230 | 49.9 | 4 | 112 | 3.3 | 1.1†, 1.0‡ | 0.070 |
: References for H i absorption data 1: Carilli & van Gorkom (1992); 2: This work; 3: Gupta et al. (2013); 4: Srianand et al. (2015);
5: Borthakur et al. (2010); 6: Gupta et al. (2010); 7: Gupta et al. (2017a); 8: Srianand et al. (2013).
, : rms in the subband covering 1665 and 1667 MHz lines, respectively; : integrated OH optical depth of 1667 MHz line or, in case of
non-detections, 3 upper limit for a spectral resolution of 2 km s-1. ; : the 3 optical depth limit is 0.009 km s-1.
II. Sample, observations and data analysis
We used the Giant Metrewave Radio Telescope (GMRT), the Karl G. Jansky Very Large Array (VLA) and the Westerbork Synthesis Radio Telescope (WSRT) to search for OH 18-cm main lines in 9 H i 21-cm absorbers. In 8 cases, the intervening 21-cm absorption originates from cold atomic gas associated with galaxies at . The names of background quasar and foreground galaxy which we refer to as quasar-galaxy pairs (QGPs), their redshifts and H i 21-cm optical depths are provided in Table 1. This sample essentially represents all the H i 21-cm absorption in QGPs that were known in 2013 either from the literature or our own survey (see Dutta et al., 2017, for the latest), and considering the radio frequency interference (RFI) environment, could be observed for OH with the above-mentioned telescopes. In the case of J1443+0214, the absorption is associated with a low surface brightness galaxy that, unlike other QGPs is identified only via narrow optical emission lines detected on top of the QSO spectrum. We also included the associated 21-cm absorption from the merging pair J0942+0623. This is one of the strongest H i 21-cm absorbers ((H i)1022 cm-2; Srianand et al., 2015), and hence, a promising candidate for molecular line search.
Five quasars, namely 3C232, Q0248+430, J1042+0748, J1241+6332 and J1243+4043, were observed with the WSRT in Maxi-short configuration in December 2010. A baseband bandwidth of 10 MHz split into 2048 frequency channels was used. The on-source time was 10 hrs per QGP. J1443+4043 was observed with the GMRT for 6 hrs on 2012, June, 2 using a bandwidth of 4 MHz split into 512 channels. The remaining three quasars were observed with the VLA in A or AD configurations over October 2012 - January 2013. The WIDAR correlator was set-up to split 16 subbands into 128 frequency channels. The subband bandwidths of 0.5 MHz, 2 MHz and 1 MHz were used for J0849+5108, J0942+0623 and J1639+1127, respectively. The total on-source time was 3-8 hrs per QGP. For GMRT and WSRT observations, same baseband covered both the main lines, whereas for VLA observations these were placed in two separate subbands.
The VLA and GMRT data were reduced using the Automated Radio Telescope Imaging Pipeline (ARTIP; Sharma et al., 2018). The WSRT data were calibrated using AIPS. The continuum and line imaging including self-calibration were performed using ARTIP. For Q0248+430, the continuum-subtracted spectral line cube was deconvolved using CLEAN down to twice the single channel noise using image masks. The OHM emission and OH 1667 MHz absorption detected from this QGP are spatially separated by 15′′, and by 116 km s-1 in velocity space. The CLEANing mask included pixels with OHM emission, and the region over which the radio continuum from the quasar is detected. We also examined the channel maps to ensure that none of the detected signal is due to residual deconvolution errors or continuum subtraction.
The stokes peak flux densities of quasars are provided in Table 1. The spatial resolution of GMRT and VLA images is 2-3′′. For J1042+0748 and the remaining WSRT maps the spatial resolution is and , respectively. The spectral resolution and the corresponding root-mean-square (RMS) values are in the range of 0.9 - 3.3 km s-1 and 1.2 - 4.4 mJy beam-1, respectively (see columns 8-9 of Table 1). For J1639+1127, the VLA subband covering 1667 MHz line was affected by RFI. The 3 optical depth limit for the 1665 MHz line is 0.050 km s-1.
III. OH detection at : QGP 0248+430
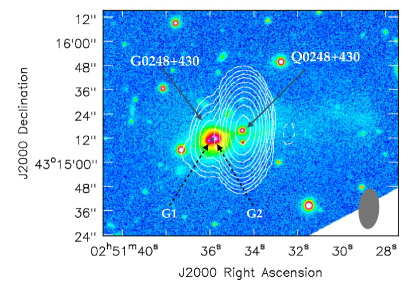
The radio-optical overlay of this QGP is shown in Fig. 1. The QSO Q0248+430 () is at an angular separation of 15′′ (15 kpc at 0.05) from the foreground galaxy G0248+430. The latter is actually a pair of merging spiral () and elliptical () galaxies separated by 3.5′′ (3.5 kpc; Kollatschny et al., 1991). They are labelled as G1 and G2, respectively, in Fig. 1 and constitute a rare system where optical emission lines from both the nuclei indicate non-thermal activity (Borgeest et al., 1991). The tidal tail emanating from G0248+430 has bluer colors compared to the galaxy and extends across the line of sight to Q0248+430 (see Fig. 1; Borgeest et al., 1991). It also shows stellar absorption lines confirming the presence of star formation activity in the tail.
We detect OHM emission coincident with the central region of the galaxy. The OH absorption towards the background quasar is detected from the gas associated with the tidal tail.
III.1. OHM emission in G0248+430
The optical imaging, spectroscopy and strong FIR emission suggest that the system has undergone a very recent and strong starburst. We estimate the IR luminosity of the galaxy using the flux densities from the IRAS Faint Source Catalog (Moshir & et al., 1990), = [6.5410-2, 0.19 0.01, 4.02 0.28, 6.92 0.42] Jy and the following equation from Sanders & Mirabel (1996),
| (1) |
where is the luminosity distance in Mpc, to be .
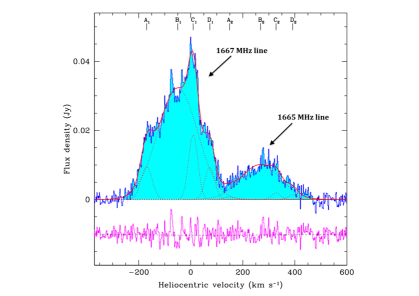
Highly luminous IR galaxies such as G0248+430 are often associated with OHMs. Kazes et al. (1989) report the detection of OHM from this galaxy but do not provide any detail. We present OHM emission from the galaxy in Fig. 2. (see also ‘’ in Fig. 1). Both the main lines are detected. To separate the contributions of two hyperfine lines, we model these using multiple Gaussian components. We note that Gaussian component fitting provides a convenient measure of source/spectral structure even if they do not necessarily represent discrete physical structures. Under the assumption that both the lines originate from the same gas, the centres and widths of the components for 1665 MHz line are tied to those of 1667 MHz line. The overall structure of 1667 MHz line is reasonably modelled by a four-component fit. As discussed below, we believe that the remaining structure in the residuals is an artefact of the limited spatial resolution (2010 kpc2) of the WSRT image. Therefore, we do not attempt to improve it further by adding more components. Noticeably, the components A2, C2 and D2 are barely detected and contribute only 7% to the total integrated flux density of the 1665 MHz line (see Table 2). The integrated flux densities of the 1665 and 1667 MHz lines are 2.1 and 8.0 Jy km s-1, respectively. These correspond to a total OH luminosity of 860 . This is about a factor 6 higher than the luminosity expected from the correlation (cf. equation 4 of Darling & Giovanelli, 2002) but not unusual or significant considering the statistical scatter in the relationship. Here, the FIR luminosity is estimated using the following equation from Sanders & Mirabel (1996)
| (2) |
to be .
The hyperfine ratio of the observed 1667 to 1665 MHz line integrated flux densities is 3.8. The ratios of the flux densities of individual Gaussian components fitted to these lines are also far from the value of 1.8 expected for LTE. In general, Very Long Baseline Interferometry (VLBI) observations often resolve OHMs into multiple components (e.g. Momjian et al., 2006). The detailed modeling of these suggests that the observed differences between 1667 to 1665 MHz line ratios can be explained by the exponential amplification of the background radiation by unsaturated maser clouds overlapping in space and velocity (e.g. Parra et al., 2005; Lockett & Elitzur, 2008; Willett et al., 2011).
| OHM 1667 MHz | OHM 1665 MHz | |||||
| Id. | Centre | Peak | Id. | Centre | Peak | |
| (km s-1) | (km s-1) | (mJy) | (km s-1) | (mJy) | ||
| (1) | (2) | (3) | (4) | (5) | (6) | (7) |
| A1 | -169 1 | 22 1 | 9.5 0.5 | A2 | 149 | 0.7 0.5 |
| B1 | -50 2 | 77 2 | 32.3 0.3 | B2 | 268 | 10.1 0.2 |
| C1 | 10 1 | 18 1 | 18.7 0.8 | C2 | 328 | 1.9 0.5 |
| D1 | 73 1 | 19 2 | 9.3 0.9 | D2 | 392 | 1.4 0.5 |
| OH 1667 MHz absorption | H i 21-cm absorption | |||||
| Id. | Centre | Id. | Centre | |||
| (km s-1) | (km s-1) | () | (km s-1) | () | ||
| X1 | -42 | 72 | 4 1 | X2 | -41 | 20 2 |
| Y1 | 143 | 42 | 2 1 | Y2 | 101 | 9 1 |
| - | - | - | - | Z2 | -204 | 3 1 |
: peak optical depth; the fits to OH absorption are used only for the analysis in Section III.3.
III.2. OH absorption from G0248+430
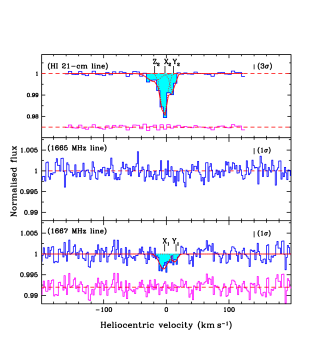
The presence of cold atomic gas and metals in the tidal tail emanating from G0248+430 have been inferred from H i 21-cm, Na i and Ca ii absorption detections towards Q0248+430 (Womble et al., 1990; Hwang & Chiou, 2004). The ratio (Ca ii)/(Na i) is similar to the values observed in the Galactic disk. Here we report the detection of OH absorption towards Q0248+430 implying the presence of molecular gas in the tidal tail. The stokes- OH absorption spectra are shown in Fig. 2. Only the 1667 MHz line is detected. The total optical depth obtained by integrating over the absorption profile is (OH) = 0.080.01 km s-1. The absorption is also consistently reproduced in individual XX and YY spectra. We integrate 1665 MHz spectrum over -20 to +20 km s-1 and obtain (OH) = 0.040.01 km s-1. We consider this to be a non-detection with an upper limit on the integrated optical depth, dv0.04 km s-1. This will be consistent with it being subthermal or in LTE. For an optically thin cloud, the integrated OH optical depth of the 1667 MHz line is related to the OH column density (OH) through,
| (3) |
where is the excitation temperature in Kelvins, () is the optical depth of the 1667 MHz line at velocity , and is the covering factor (e.g. Liszt & Lucas, 1996). For Q0248+430, adopting = 1, = 3.5 K which is the peak of the log-normal function fitted to the distribution of OH absorbers observed in the Galaxy (Li et al., 2018) and (OH) = 0.080.01 km s-1 from Table 1, we get (OH) = (6.30.8)1013()() cm-2. This is similar to the (OH)1013-14 cm-2 observed in diffuse clouds in the Galaxy, but 15550 times lower than the column densities of three previously known intervening OH absorbers from gravitational lenses (cf. Section IV).
We reprocessed the archival VLA data used for H i 21-cm absorption analysis in Hwang & Chiou (2004). We measure the peak flux density to be 944 mJy beam-1 and the total integrated 21-cm optical depth measured from the spectrum, = 0.430.02 kms (see Fig. 2). For an optically thin cloud the is related to the neutral hydrogen column density (H i), spin temperature , and covering factor through,
| (4) |
For 1, as discussed below and adopting 70 K, which is the median column density weighted for the cold neutral medium (CNM) in our Galaxy (Heiles & Troland, 2003), we get (H i) = (5.50.3)(/70)(1.0/) cm-2. The [OH]/[H i] abundance ratio for Q0248+430 is , which although not unusual is about an order of magnitude higher than the typical ratio (10-7) observed in the Galaxy (Li et al., 2018). A much larger (1000 K), as is more commonly seen in H i absorbers (Srianand et al., 2012; Kanekar et al., 2014), and/or would give [OH]/[H i] more in accord with Galactic observations.
In the VLBI image at 2.3 GHz, Q0248+430 is resolved into multiple components with an overall extent of 26 milliarcsecond (27 pc at ; Fey & Charlot, 2000). VLBI spectroscopic observations of low- H i 21-cm absorbers show that for diffuse ISM the extent of CNM gas is 20 pc (Keeney et al., 2005; Gupta et al., 2017a). Therefore, it is quite likely that the H i absorber in front of Q0248+430 fully covers the radio emission i.e. . However, sizes of diffuse H2 components associated with damped Lyman- systems (DLAs) have been inferred to be pc (Srianand et al., 2012; Noterdaeme et al., 2017), implying that probably .
III.3. Variation of fundamental constants
As OH and H i absorption line frequencies depend differently on the fine structure constant, the electron-proton mass ratio and the proton gyromagnetic ratio, relative shifts between the observed frequencies of these lines can be used to constrain the variations of these fundamental constants of physics. But this crucially requires that both the absorption lines originate from the same gas. For Q0248+430, the H i 21-cm absorption is broader compared to the OH absorption. Specifically, the 90% of the total OH and H i optical depths are contained within 301 and 435 km s-1, respectively. The 1667 MHz line clearly shows two absorption components. We use two Gaussian components, X1 and Y1, to model it and determine the frequencies of the two peaks (Table 2). The 21-cm line has much higher signal-to-noise ratio (SNR) but the spectral resolution is coarser by a factor of four. Besides absorption corresponding to X1 and Y1, the 21-cm line also has an additional absorption component at -20 km s-1. Therefore, we model it using three components X2, Y2 and Z2, with the widths of first two components fixed to X1 and Y1, respectively (Table 2). We note that the broad 21-cm absorption () corresponding to Z2 is reported here for the first time (cf. Fig. 7 of Hwang & Chiou, 2004).
We next compare redshifted frequencies of H i and OH absorption components, Xi and Yi, for =1 and 2, to constrain = ()/(1 + ), where (Uzan, 2011). The centres of components fitted to the OH and H i are: = 0.051498 0.000007, = 0.051561 0.000007, = 0.051497 0.000002, and = 0.051551 0.000002. This yields for the two components, ()X = (0.95 6.3) and ()Y = (9.5 6.3). The weighted average of these provides: () = (5.2 4.5). Taking the case of as it has strongest dependence on , and assuming that and are constant, we get () = (1.7 1.4). This is among the stringent constraints on the variation of (Rahmani et al., 2012; Kanekar et al., 2018).
The constraints on and will be weaker but more importantly, here, we assumed that the components X and Y for OH and H i absorption are tracing the gas with same physical conditions and internal motions within the cloud. The same is implicitly assumed for the component Z which is only detected in the higher SNR H i spectrum. This and the uncertainty due to caused either by the different sizes of H i and OH clouds or the proper motion of the radio source components between the epochs of H i and OH observations are the major unaccounted sources of errors in our analysis. More sensitive near-simultaneous observations of this absorber especially using the Very Long Baseline Interferometry (VLBI) are planned to address these uncertainties.
IV. Implications of OH non-detections
Li et al. (2018) recently published observations of OH main lines from the Galaxy towards 44 extragalactic continuum sources. The H i and OH column densities derived by them from the Gaussian component-by-component analysis along with the measurements from our survey are presented in Fig. 3. The top panel of Fig. 3, provides detection rate for different limiting values of OH and H i column densities, (OH)lim and (H i)lim, respectively. For given values of these, is estimated by determining the number of OH detections with OH and H i column densities larger than the limiting values, and dividing it by total number of sight lines with (H i)(H i)lim but considering only those that are sensitive to detect OH down to (OH)lim. It is apparent from the figure that (i) is smaller for larger (OH)lim i.e. absorbers with larger (OH) are rarer, in particular none similar to known absorbers from Gravitational lenses are detected, and (ii) does not depend on (H i)lim. In general, the trends in with respect to (OH)lim or (H i)lim can shed light on the nature of OH absorbers and the conditions in which they are likely to be detected. Due to large statistical errors we are unable to draw any substantial conclusions. At this point, these Galactic measurements provide the minimal context in which to view the detections/non-detections from our survey.
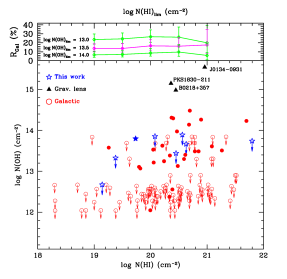
The (OH) upper limits from our sample are in the range: 0.4 - 7.71013 cm-2. These are sensitive to detect OH at higher end of column densities observed in the diffuse ISM (refer to Galactic measurements in Fig. 3). We also note that the highest (H i) absorber in our sample is a non-detection in OH. The associated AGN (J0942+0632) in this case is resolved into multiple components extending over 89 pc (Srianand et al., 2015). The OH non-detection could be due to 1, or that there is no molecular gas along the sight line.
Next we use the method used to estimate to obtain the detection rate, , for our OH survey. For this we adopt log (OH)lim(cm-2) = 13.7 and log (H i)(H i)lim(cm-2) = 19.0. We estimate = 1/4 = 25%. Note that this does not include the measurements for three gravitational lens systems which have column densities in the range of dense molecular gas. From Gupta et al. (2012), for integrated 21-cm optical depths of 0.1-0.5 km s-1are available. We note that for 70K, 0.1 km s-1 corresponds to log (H i)(cm-2) = 19.1. Adopting, = 0.03 from Gupta et al. (2012) for log (H i)(H i)lim(cm-2) = 19.0 and assuming no redshift evolution in , we get the number per unit redshift range of OH absorbers, = = .
Although derived for somewhat arbitrarily chosen limiting values of (H i) and (OH) to include most of the measurements from our survey, the adopted limits are relevant for the upcoming MeerKAT Absorption Line Survey (MALS; Gupta et al., 2017b) which will have the sensitivity to detect cold atomic and molecular gas with (H i) cm-2and (H i) cm-2. Based on the derived and the total MALS redshift path of 1000 towards on-axis (primary) strong radio sources, we expect to detect 10 OH absorbers from diffuse ISM of external galaxies.
V. Concluding remarks
We have used GMRT, VLA and WSRT to perform the first survey of OH absorption from cold atomic gas in galaxies. The survey has led to first detection of OH from diffuse molecular gas ((OH)1013-14 cm-2) at . The absorber is the first one to enable further detailed studies through VLBI spectroscopy to improve our understanding of the physical extent of both cold atomic and molecular gas, and directly address the systematics affecting the constraints on fundamental constants of physics through radio absorption lines. The three previously known intervening OH absorbers are at higher and due to unavailability of suitable low-frequency receivers can not be observed through VLBI spectroscopy. A substantial number of OH absorbers may be detected from large surveys with Square Kilometer Array (SKA) pathfinders allowing these to be used as an effective tool to probe complex gas physics and variations of fundamental constants. The majority of radio absorption line surveys till now have been based on sight lines from optical spectroscopic surveys which are biased against dust. They are indeed tracing diffuse ISM. This will change with upcoming blind radio absorption line surveys which will trace both diffuse and dense ISM. The results from the survey presented here will still be applicable to the part of the survey(s) tracing diffuse ISM.
References
- Baan (1989) Baan, W. A. 1989, ApJ, 338, 804
- Borgeest et al. (1991) Borgeest, U., Schramm, K.-J., Dietrich, M., Kollatschny, W., & Hopp, U. 1991, A&A, 243, 93
- Borthakur et al. (2011) Borthakur, S., Tripp, T. M., Yun, M. S., et al. 2011, ApJ, 727, 52
- Borthakur et al. (2010) —. 2010, ApJ, 713, 131
- Carilli & van Gorkom (1992) Carilli, C. L., & van Gorkom, J. H. 1992, ApJ, 399, 373
- Chengalur et al. (1999) Chengalur, J. N., de Bruyn, A. G., & Narasimha, D. 1999, A&A, 343, L79
- Chengalur & Kanekar (2003) Chengalur, J. N., & Kanekar, N. 2003, Physical Review Letters, 91, 241302
- Cohen (1995) Cohen, R. J. 1995, Ap&SS, 224, 55
- Darling (2004) Darling, J. 2004, ApJ, 612, 58
- Darling & Giovanelli (2002) Darling, J., & Giovanelli, R. 2002, AJ, 124, 100
- Dickey et al. (1981) Dickey, J. M., Crovisier, J., & Kazes, I. 1981, A&A, 98, 271
- Dutta et al. (2017) Dutta, R., Srianand, R., Gupta, N., et al. 2017, MNRAS, 465, 588
- Fernandez et al. (2010) Fernandez, M. X., Momjian, E., Salter, C. J., & Ghosh, T. 2010, AJ, 139, 2066
- Fey & Charlot (2000) Fey, A. L., & Charlot, P. 2000, ApJS, 128, 17
- Gupta et al. (2010) Gupta, N., Srianand, R., Bowen, D. V., York, D. G., & Wadadekar, Y. 2010, MNRAS, 408, 849
- Gupta et al. (2013) Gupta, N., Srianand, R., Noterdaeme, P., Petitjean, P., & Muzahid, S. 2013, A&A, 558, A84
- Gupta et al. (2012) Gupta, N., Srianand, R., Petitjean, P., et al. 2012, A&A, 544, A21
- Gupta et al. (2017a) Gupta, N., Srianand, R., Farnes, J. S., et al. 2017a, ArXiv e-prints, arXiv:1712.03511
- Gupta et al. (2017b) Gupta, N., Srianand, R., Baan, W., et al. 2017b, ArXiv e-prints, arXiv:1708.07371
- Heiles & Troland (2003) Heiles, C., & Troland, T. H. 2003, ApJ, 586, 1067
- Hwang & Chiou (2004) Hwang, C.-Y., & Chiou, S.-H. 2004, ApJ, 600, 52
- Kanekar et al. (2018) Kanekar, N., Ghosh, T., & Chengalur, J. N. 2018, ArXiv e-prints, arXiv:1801.07688
- Kanekar et al. (2005) Kanekar, N., Carilli, C. L., Langston, G. I., et al. 2005, Physical Review Letters, 95, 261301
- Kanekar et al. (2014) Kanekar, N., Prochaska, J. X., Smette, A., et al. 2014, MNRAS, 438, 2131
- Kazes et al. (1989) Kazes, I., Mirabel, I. F., & Combes, F. 1989, IAU Circ., 4856
- Keeney et al. (2005) Keeney, B. A., Momjian, E., Stocke, J. T., Carilli, C. L., & Tumlinson, J. 2005, ApJ, 622, 267
- Kollatschny et al. (1991) Kollatschny, W., Dietrich, M., Borgeest, U., & Schramm, K.-J. 1991, A&A, 249, 57
- Li et al. (2018) Li, D., Tang, N., Nguyen, H., et al. 2018, ArXiv e-prints, arXiv:1801.04373
- Liszt & Lucas (1996) Liszt, H., & Lucas, R. 1996, A&A, 314, 917
- Liszt & Lucas (1999) Liszt, H., & Lucas, R. 1999, in Astronomical Society of the Pacific Conference Series, Vol. 156, Highly Redshifted Radio Lines, ed. C. L. Carilli, S. J. E. Radford, K. M. Menten, & G. I. Langston, 188
- Lockett & Elitzur (2008) Lockett, P., & Elitzur, M. 2008, ApJ, 677, 985
- Momjian et al. (2006) Momjian, E., Romney, J. D., Carilli, C. L., & Troland, T. H. 2006, ApJ, 653, 1172
- Moshir & et al. (1990) Moshir, M., & et al. 1990, in IRAS Faint Source Catalogue, version 2.0 (1990)
- Noterdaeme et al. (2017) Noterdaeme, P., Krogager, J.-K., Balashev, S., et al. 2017, A&A, 597, A82
- Parra et al. (2005) Parra, R., Conway, J. E., Elitzur, M., & Pihlström, Y. M. 2005, A&A, 443, 383
- Rahmani et al. (2012) Rahmani, H., Srianand, R., Gupta, N., et al. 2012, MNRAS, 425, 556
- Sanders & Mirabel (1996) Sanders, D. B., & Mirabel, I. F. 1996, ARA&A, 34, 749
- Sharma et al. (2018) Sharma, R., Gyanchandani, D., Kulkarni, S., et al. 2018, ARTIP: Automated Radio Telescope Image Processing Pipeline, Astrophysics Source Code Library, , , ascl:1802.004
- Srianand et al. (2015) Srianand, R., Gupta, N., Momjian, E., & Vivek, M. 2015, MNRAS, 451, 917
- Srianand et al. (2012) Srianand, R., Gupta, N., Petitjean, P., et al. 2012, MNRAS, 421, 651
- Srianand et al. (2013) Srianand, R., Gupta, N., Rahmani, H., et al. 2013, MNRAS, 428, 2198
- Uzan (2011) Uzan, J.-P. 2011, Living Reviews in Relativity, 14, 2
- van Langevelde et al. (1995) van Langevelde, H. J., van Dishoeck, E. F., Sevenster, M. N., & Israel, F. P. 1995, ApJ, 448, L123
- Wannier et al. (1993) Wannier, P. G., Andersson, B.-G., Federman, S. R., et al. 1993, ApJ, 407, 163
- Weinreb et al. (1963) Weinreb, S., Barrett, A. H., Meeks, M. L., & Henry, J. C. 1963, Nature, 200, 829
- Willett et al. (2011) Willett, K. W., Darling, J., Spoon, H. W. W., Charmandaris, V., & Armus, L. 2011, ApJ, 730, 56
- Womble et al. (1990) Womble, D. S., Junkkarinen, V. T., Cohen, R. D., & Burbidge, E. M. 1990, AJ, 100, 1785
- Zwaan et al. (2015) Zwaan, M. A., Liske, J., Péroux, C., et al. 2015, MNRAS, 453, 1268