Deformation, lattice instability, and metallization during solid-solid structural transformations under general applied stress tensor: example of Si I Si II
Abstract
Density functional theory (DFT) was employed to study the stress-strain behavior, elastic instabilities, and metallization during a solid-solid phase transformation (PT) between semiconducting Si I (cubic A4) and metallic Si II (tetragonal A5 structure) when subjected to a general stress tensor. With normal stresses (, , ) acting along , , and , respectively, dictating the simulation cell, we determine combinations of 6 independent stresses that drive a lattice instability for the Si ISi II PT, and a semiconductor-metal electronic transition. Metallization precedes the structural PT, hence, a stressed Si I can be a metal. Surprisingly, a stress-free Si II is metastable in DFT. Notably, the PT for hydrostatic pressures is at 75.81 GPa, while under uniaxial stress it is 11.03 GPa (or 3.68 GPa mean pressure). Our key result: The Si I Si II PT is described by a critical value of the modified transformation work, as found with a phase-field method, and the PT criterion has only two parameters for a general applied stress. More generally, our findings are crucial for revealing novel (and more economic) material synthesis routes for new or known high-pressure phases under controlled and predictable non-hydrostatic loading and plastic deformation.
I INTRODUCTION
Phase transformations (PTs) in solids are traditionally characterized by temperature-pressure (-) phase diagrams at thermodynamic equilibrium [1], whereas general non-hydrostatic stresses offer novel synthetic routes for new or known high-pressure phases. Here, we augment standard - diagrams of structural (and electronic) instabilities, providing guidance for creating more accessible processing routes of such phases under controlled and predictable non-hydrostatic deformation at significantly lower mean pressures. Indeed, observed PTs occur under significant deviation from equilibrium [2; 3; 4; 5], and most first-order PT exhibit a hysteresis. For carbon, the equilibrium pressure for graphite-diamond PT at room temperature is 2.45 GPa; however, due to hysteresis, the PT is observed to start at 70 GPa [3]. The high-pressure superhard cubic boron nitride (BN) is stable at ambient conditions [4], however, disordered hexagonal BN does not transform even at 52.8 GPa [5]. The actual PT pressure deviates from that of equilibrium due to an enthalpy barrier. When thermal fluctuations can be neglected, e.g., at low temperature and short times, the PT criterion is related to disappearance of the enthalpy barrier, i.e., to the lattice instability. Hence, lattice instability conditions are intensively studied under hydrostatic, uniaxial, and multiaxial loadings [6; 7; 8; 9; 10; 11; 12]. While phase equilibrium under stress tensor can be derived within continuum thermodynamic treatment for elastic [13] and elastoplastic [14] materials, lattice instabilities require a separate consideration.
In experiments, there is a significant reduction in the PT pressure due to the deviatoric (non-hydrostatic) stresses and plastic strains [15; 16; 5; 17; 18]. For example, a large plastic shear reduces the PT from highly disordered to superhard wurtzitic BN from 52.8 to 6.7 GPa [5] – an order of magnitude! This phenomenon is extremely important from fundamental and applied points of view, as it may reduce the PT pressure to a practical level for high-hydrostatic-pressure phases that exhibit unique properties.
The suggested physical mechanism responsible for this reduction is related to dislocation pileups associated with a plastic strain [15]. As stresses at the tip of a pileup are proportional to the number of dislocations in a pileup (typically 10 to 100), local stresses exceed the lattice instability limit and cause nucleation of a high-pressure phase even at relatively small external pressure. This was rationalized based on an analytical model [15] and using a phase field approach [19; 20]. However, the phase field inputs for the forward (direct) and reverse PT instability criteria for an ideal crystal under general stress tensor was assumed hypothetically, as such criteria are not known for any material. In addition, for many materials there is a significant difference between calculated instability pressure (e.g., 64-80 GPa for Si ISi II PT [21; 22]) and experimentally determined PT pressure (e.g., 9-12 GPa for the same PT [23]). This reduction was qualitatively explained by presence of the local stress concentrators around defects (dislocations, grain boundaries, etc.) and the effect of the non-hydrostatic stresses. Quantitative solution of this problem requires knowledge of the lattice instability conditions for a given stress tensor.
Notably, due to the technological importance of Si and its PTs, a huge literature exists. Relevant are the PTs in Si I under hydrostatic and two-parametric nonhydrostatic loadings, studied with DFT [21; 22], and the lattice instability under two-parametric nonhydrostatic loadings (unrelated to a PT) [24; 25; 26; 10]. Importantly, PT in Si under plastic deformations is utilized in the ductile regime for machining [27].
Thus, we perform a DFT-based study of the deformation process under applied general stress. We determine the lattice instabilities, responsible for the cubic-to-tetragonal Si ISi II PT, and metallization. While finding the instability criteria under all six stress components seems daunting, due to the large number of combinations, an unexpected guidance came from the crystal lattice instability criterion formulated within the phase-field method [28; 11; 12; 29]. The key result is that Si ISi II PT can be described by the critical value of the modified transformation work. With normal stress in direction and and acting along and , respectively, the PT criterion is linear in normal stresses, depends on , is independent of and shear stress , acting alone or with one more shear stress, and depends on all shear stresses via theoretically predicted geometric nonlinearity with zero linear term. The PT criterion has only two material parameters for a general applied stress, which can be determined by two DFT simulations under different normal stresses.
II SIMULATION METHODS
We used DFT as implemented in VASP [30; 31; 32] with the projector augmented waves (PAW) basis [33; 34] and PBE exchange-correlation functional [35]. The PAW-PBE pseudo-potential of Si had 4 valence electrons () and 1.9 Å cutoff radius. The plane-wave energy cutoff (ENCUT) was 306.7 eV, while an augmentation charge (ENAUG) was 322.1 eV. We used a Davidson block iteration scheme (IALGO=38) for the electronic energy minimization. Electronic structure was calculated with a fixed number of bands (NBANDS=16) in a tetragonal 4-atom unit cell (a supercell of a 2-atom primitive cell). Brillouin zone integrations were done in -space (LREAL=FALSE), using a -centered Monkhorst-Pack mesh [36] containing 55 to 110 -points per Å-1 (fewer during atomic relaxation, more for the final energy calculation). Accelerated convergence of the self-consistent charge calculations was achieved using a modified Broyden’s method [37].
Atomic relaxation in a fixed unit cell (ISIF=2) was performed using the conjugate gradient algorithm (IBRION=2), allowing symmetry breaking (ISYM=0). The transformation path was confirmed by the nudged elastic band (NEB) calculations, performed using the C2NEB code [38]. We used DFT forces in ab initio molecular dynamics (MD) to verify stability of the relaxed atomic structures. Si atoms were assumed to have mass POMASS=28.085 atomic mass units (amu). The time step for the atomic motion was set to POTIM=0.5 fs. Additionally, our classical MD simulations used a Tersoff potential (TP), as described in [39].
III ENERGY LANDSCAPE
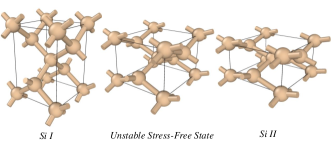
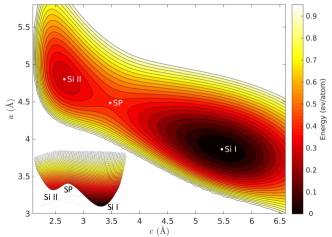
The calculated potential energy (versus the tetragonal lattice constants and ) is shown in Fig. 2. All the primary data of our simulations and data for each figure are placed in Supplemental Material [40]. Using DFT, we found two local energy minima, corresponding to the fully relaxed stress-free Si I and Si II, and a saddle point (SP) – an intermediate unstable state corresponding to the enthalpy barrier, see Fig. 1. The tetragonal cell of Si I is bounded by , , and planes. The calculated energies (and tetragonal lattice constants and ) relative to the stress-free Si I (Å, Å) are eV/atom for Si II (Å, Å), and eV/atom for the SP state (Å, Å). The calculated is within 0.7% of experiment (Å) [41].
IV STRESS-STRAIN CURVES
Tensors are designated with boldface. is the unit tensor. Contractions of tensors and over one and two indices in Einstein notations are and , respectively. The inverse and transpose of are and , respectively.
The deformation gradient , which maps initial undeformed state of a crystal into current deformed state, can be multiplicatively decomposed into elastic and transformational parts. Transformation deformation gradient changes the Si I stress-free cell to the Si II stress-free cell; its diagonal components are and . For comparison, the Tersoff potential in [11; 12] leads to and .
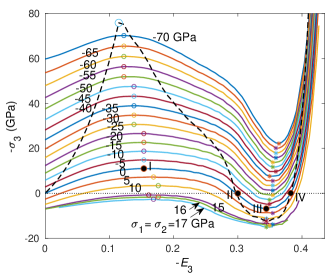
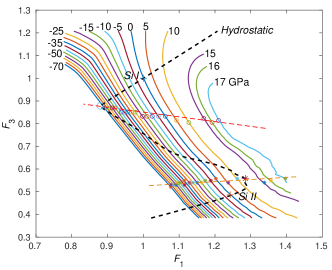
We use true Cauchy stress (force per unit deformed area) and Lagrangian strain . Stress-strain curves – in direction for fixed lateral stresses in and directions are presented in Fig. 3, along with corresponding transformation paths in plane. The elastic instability occurs when determinant of the matrix of the elastic moduli, modified by some geometrically nonlinear terms, reduces to zero [6; 7; 8; 9; 10]. This results in a condition that some elastic moduli (or combination thereof) reduce to zero. We will use an alternative condition, based on the following strict definition. Elastic lattice instability at true stress occurs at stresses above (or below for the reverse PT) which the crystal cannot be at equilibrium. The instability points correspond to the stress maximum for forward PT (and minimum for reverse PT) on the stress-strain curves, see Fig. 3. Both conditions coincide in many cases, although they are not strictly equivalent. The second condition is more general and universal, because it is applicable even to the cases with discontinuous or undefined derivatives of stress with respect to strain. In those cases the elastic moduli are not well-defined, and determinant of the matrix of the elastic moduli cannot be found.
In Fig. 3, a tetragonal stressed lattice of Si I transforms into a tetragonal stressed lattice of Si II, and the lattice instability does not change this tetragonal symmetry. The slope of the stress-strain curve is continuous and is zero at instability points. Under hydrostatic loading (dashed line in Fig. 3), a cubic lattice looses its stability under tetragonal perturbations, i.e., there is a bifurcation from a primary isotropic deformation to a secondary tetragonal deformation; hence, the derivative at the hydrostatic instability point is discontinuous. Both under hydrostatic () and uniaxial () compression there are three stress-free states (Fig. 1): Si I, Si II (stable or metastable enthalpy minima) and an intermediate unstable state at the SP (enthalpy barrier). Interestingly, a stress-free Si II is metastable, with stable phonons [42; 43; 44]. Thus, one could search for a pressure-plastic shear path for arresting the metastable Si II, as suggested in [15] for any metastable phase. In theory, a stress-free cubic Si I is a deep global energy minimum, while a stress-free tetragonal Si II is a shallow local energy minimum (eV/atom above Si I and eV/atom below SP), which can be further destabilized by an internal stress that appear during forward martensitic PT. In experiments, a stress-free Si II was not observed, while a depressurized Si II does not reverse to Si I, but transforms to Si XII and then to Si III under slow unloading, or to amorphous Si under fast unloading [23].
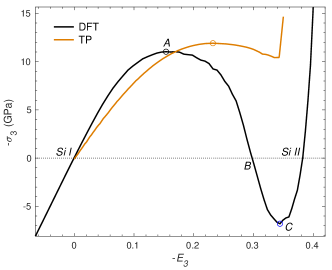
Stress-strain – curves for a uniaxial compression at , obtained with DFT and Tersoff potential, are compared in Fig. 4. While the maximal stresses for Si I corresponding to the elastic lattice instability (see below) are comparable in both approaches, other features differ significantly, including elastic rule for Si I, strain for the lattice instability of Si I, and the transformation strain. The TP-based stress-strain curve does not intersect zero-stress axis, i.e., stress-free Si II is unstable in a classical force field. The same is true for the Stillinger-Weber and modified-Tersoff potentials [12].
V ELASTIC LATTICE INSTABILITY UNDER TWO-PARAMETRIC LOADING
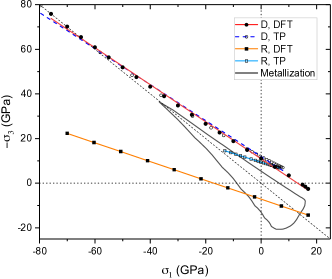
Elastic lattice instabilities at for direct () and reverse () PTs are shown in Fig. 5. Both instability conditions are approximated by linear relationships. Tersoff-potential results from [11; 12] for Si ISi II PT are generally in good agreement with the present DFT results, however there is a difference for tensile and small compressive , where TP results are slightly higher and nonlinear; at a tensile stress GPa, they cross the instability line for the reverse PT. Also, under hydrostatic loading, PT pressure from DFT and TP is 75.81 GPa and 79.58 GPa, respectively.
For uniaxial compression, the PT stress is GPa at . In comparison, DFT simulations in [25] give GPa and (recalculated from engineering strain in [25]); DFT results in [26] using two different methods suggest GPa and (recalculated from logarithmic strain in [26]); and TP in [11; 12] gives GPa and . Note that the pressure for uniaxial loading is GPa, which is times lower than under hydrostatic conditions. This characterizes very strong effect of non-hydrostatic stresses on PT pressure, which can partially explain significantly lower experimental PT pressure than the instability pressure and scatter in experimental data under quasi-hydrostatic conditions. The instability lines are described by for and for . Theoretical strength in [25] is approximated as for . As it is close to our result, instability in [25] is related to Si ISi II PT.
While instability line for forward PT in [11; 12] with TP-MD is quite close to our DFT results, for reverse PT the TP-MD results are completely different from DFT. Consequently none of the classical potentials in [11; 12] (Tersoff, modified Tersoff, and Stillinger-Weber) are able to describe the reverse PT. This also means that phenomena related to coincidence of the forward and reverse PTs in some tensile lateral stress range predicted in [12] are not realistic for Si I. Still, they may be found in other materials.
VI METALLIZATION UNDER BIAXIAL LOADING
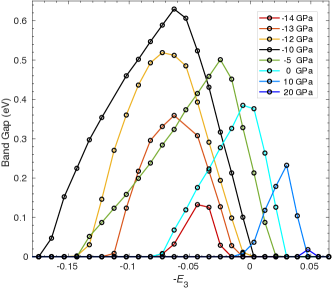
The electronic structure in Si I had been studied under different combinations of and fixed . Examples of the electronic band gap vs. compressive or tensile strain are given in Fig. 6. For each , there is a strain , for which the band gap reaches its maximum, while a substantial deformation in any direction reduces the band gap to zero beyond the metallization curve, shown in Fig. 5. The band gap is maximal near GPa, see Fig. 6.
The Si I Si II PT is accompanied by metallization – an electronic transition from semiconducting to metallic phase. However, the relation between the structural and electronic properties was not established. We found that the electronic transition precedes the structural PT for all combinations of stresses: a sufficiently deformed Si I under stress is metallic, see Fig. 6. Also, this electronic transition does not change the continuity of the stress-strain curves and their first derivatives (Fig. 5); this differs from the stress discontinuity in magneto-structural phase transitions [45]. The metallization curve is closed in the plane; it can be approximated by two straight lines and , and a parabolic section . Metallization can be caused by compressive and tensile stresses (or their combination). While one of the metallization lines is relatively close and approximately parallel to the Si ISi II PT line, the semiconducting (non-metallic) region is compact and its closed boundary surrounds the stress-free Si I. According to Fig. 5, metallization occurs deeply in the region of stability of Si I. Under hydrostatic pressure, metallization occurs at compressive 36.82 GPa and tensile 13.91 GPa. Under uniaxial loading, metallization is at compressive 5.4 GPa and tensile 12.78 GPa, i.e. the effect of non-hydrostatic stresses is extremely strong. Under biaxial loading at , the electronic transition happens at compressive 6.69 GPa and tensile 8.792 GPa. Intersection of the metallization curve with the line for elastic instability of Si II in the stress plane in Fig. 5 does not have any meaning because strains for metallization correspond to the region of stability of Si I (compare Figs. 3 and 6).
VII ELASTIC LATTICE INSTABILITY UNDER TRIAXIAL LOADING
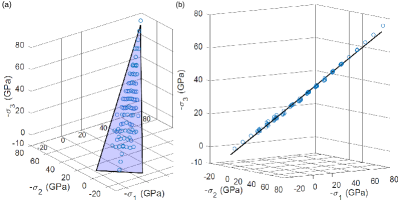
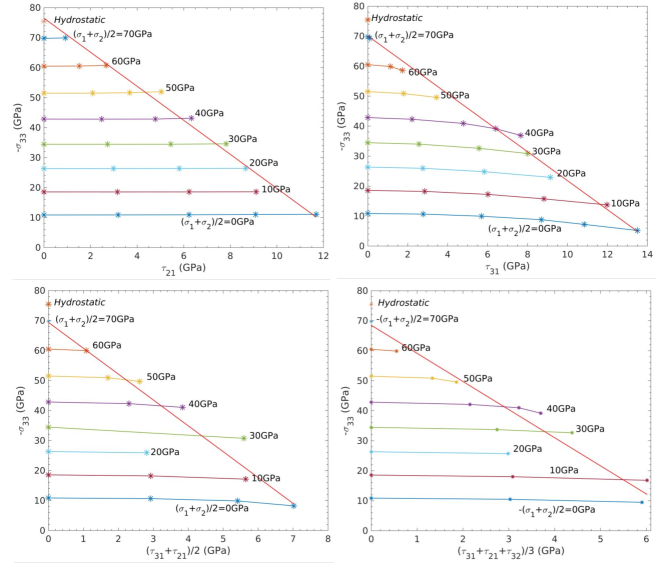
Evidently, DFT results for case in Fig. 7 suggest that the criterion for forward Si ISi II PT can be described accurately in 3D space of normal stresses by a plane
| (1) |
It is very surprising that the elastic instability for a material with strong physical and geometric nonlinearities can be approximated by a linear criterion.
VIII LATTICE INSTABILITY UNDER STRESS TENSOR: THE PHASE FIELD APPROACH
As shown in [28; 11; 12; 29], a PT condition linear in normal stress can be derived within the phase field approach to martensitic PTs. Using several steps and assumptions, the following instability criterion for Si ISi II PT was derived:
| (2) |
where deformation gradient , and other material parameters (e.g., thermal energy, elastic moduli, and transformation strain ) depend on the order parameter , which changes during the transformation process from for Si I [i.e., ] to for Si II [i.e., ]. is called the modified transformation work [11], and is the magnitude of the double-well barrier. For cubic to tetragonal transformation, , where are the coefficients in the interpolation of . For the loading by three stresses normal to the chosen above faces, all tensors in Eq. 2 are coaxial, tensors and eliminate each other, and Eq. 2 reduces to the linear modified transformation work criterion:
| (3) |
The equality is used to describe combination of stresses at the limit of stability and calibrate material parameters. reduces to the transformation work for . The consequence of Eq. 3 for cubic-to-tetragonal PT is that, with , the stresses and contribute to the instability criterion via , i.e., as in Eq. 1. Comparing Eqs. 3 and 1 with and leads to GPa and .
When shear stresses are applied, causing nonzero deformation gradients , , , with rigid-body rotations excluded by imposing a constraint , Eq. 2 reduces to
| (4) | |||
where and the terms proportional to are eliminated. With transformation shears absent in a cubic-to-tetragonal PT, the shear transformation work is absent. The terms proportional to the shear stresses are due to geometric nonlinearity (finite strains); they do not contain any additional material parameters. Shear stresses change geometry of the crystal, and this affects transformation work along the normal components of transformation strain.
Note that Eq. 4 is not invariant under exchange because of imposed kinematic constraint. For the obtained parameters, and because and , when and or and are applied alone, contribution of shear stresses to is positive, i.e., they promote tetragonal instabilities. Shear stress (more exactly, elastic shear strain ) alone or with does not contribute to the instability condition; but contributes when two other stresses, and , are applied simultaneously, and depending on signs of all shear stresses, may promote or suppress tetragonal instability.
IX SHEAR STRESS-STRAIN CURVES AND SHEAR LATTICE INSTABILITY
Increasing simple shears , , and their combinations were applied at various fixed ( before and after tetragonal instability points) and , for which stresses were equal to values given in Fig. 8 before shear loading. Typical shear stress – deformation gradient curves are shown in Fig. 8. Shear instability starts at the maximum shear stress. This instability does not lead to Si II but rather to possible amorphization or hexagonal diamond Si IV (which is beyond our present focus). Here we study the effect of shear stresses on the tetragonal instability mode, responsible for the PT to Si II, which typically happens before the shear instability is reached.
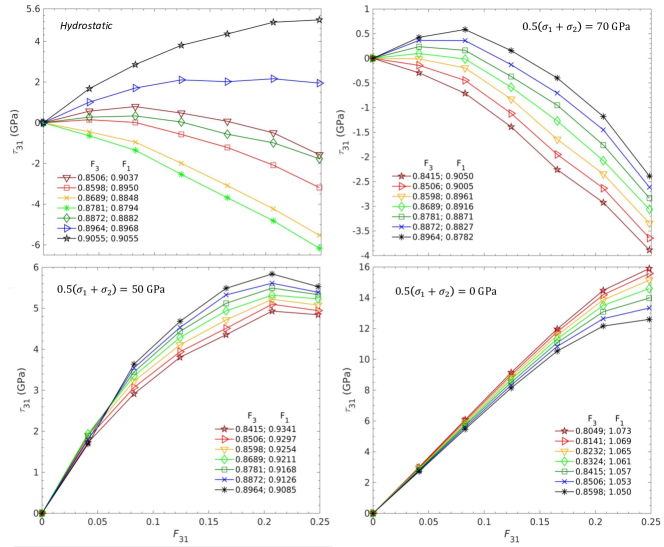
Under an initial (before shear) hydrostatic compression, shear stresses for any in the cubic phase reduce with increasing volumetric strain and pressure (see curves for four lower combinations of and in Fig. 8 (a)), which is qualitatively consistent with the limited results in [24] for the slip system. After reaching the instability pressure for Si I Si II PT and following the tetragonal branch of deformation gradient (see curves for three upper combinations of and in Fig. 8 (a)), a crossover is observed and a shear stress for any increases with further growth of and volumetric strain, while the pressure reduces along the unstable branch of pressure – (or volumetric strain) curve. The shear instability at an infinitesimal shear starts at 72 GPa, i.e., below the tetragonal mode of lattice instability. This may explain amorphization in nanocrystalline Si I under increasing pressure when PT to Si II is kinetically suppressed [46]. Amorphization may be caused by virtual melting [47] after crossing metastable continuation of the melting line, since melting temperature for Si reduces with pressure.
The effect of pressure on the curves is qualitatively similar to that for the curves. However, a shear instability for any starts after the tetragonal instability.
At a non-hydrostatic initial loading, physics is essentially different. At the initial stress GPa, shear instability for an infinitesimal starts practically simultaneously with the tetragonal instability (see green curve for the middle values of and in Fig. 8 (b)). Before tetragonal instability, the shear instability shifts to larger shears. Shear stress decreases with increasing monotonously, in contrast to hydrostatic loading. At the same time, shear instability occurs for after tetragonal instability. Both and decrease with increasing ; for all and equal shears one has . This tendency in stress-strain curves is kept to GPa with increasing shear instability strain and without essential change in the instability strain . Amplitude of both shear stresses increases with reducing . Effect of lateral and corresponding axial compressions on both shear stress-strain curves reduces with decreasing . At GPa a crossover occurs, i.e., shear stresses slightly increase with .
X EFFECT OF SHEAR STRESSES ON TETRAGONAL INSTABILITY
The curves [along the path in the plane corresponding to before shear] have been obtained for different fixed shears. The instability stress in Fig. 9 is determined as the local maximum of , see Fig. 4. While during shear but their sum practically does not change. That is why curves in Fig. 9 are given for the approximately fixed values of .
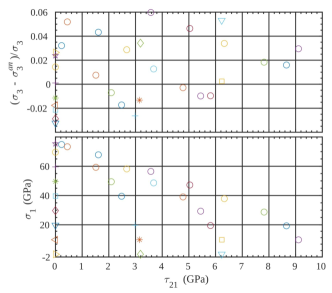
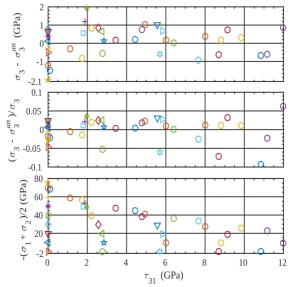
In addition, absolute and relative deviations between the actual instability stress and based on the analytical prediction (4) are presented in Figs. 10 and 11. As we already discussed (see linear Eq. 3), shear stress alone does not contribute to the analytical instability condition (4) and practically (within the relative error of ) does not affect the instability stress in a broad range of shear stresses below the shear instability, which is approximately described by . Shear instability stress varies from 11.09 GPa at to 0 at GPa.
An increasing shear stress causes some reduction in the instability stress (Fig. 9). The relative error of the instability stress with respect to the analytical prediction (4) for most combinations of of and is between and . However, there are three outliers at a large shear stress GPa. At these points, stresses are small (from to GPa) and the corresponding instability stress is also small (10–GPa); a ratio of smaller numbers with finite absolute errors has a larger relative error. The absolute error for these points is just within GPa, see Fig. 11. A larger error of GPa appears for small shear stresses but large and consequently (from to GPa), i.e., close to the shear instability. A relative error there remains within .
Thus, the main effect of a shear stress on the instability stress is due to the theoretically predicted geometric nonlinearity with zero linear term. The combined effect of two and three shear stresses on the instability stress is smaller than the effect of alone (a) because of a smaller averaged shear stress that causes shear instability and (b) because of a small contribution of for two shear stresses and opposite contribution of for three stresses, according to Eq. (4) for all positive shear stresses. Deviation from the prediction (4) does not exceed .
Thus, the tetragonal lattice instability under action of all six components of the stress tensor can be described by the critical value of the modified transformation work, namely, by Eq. (4), which (a) is linear in normal stresses, depends on , and has only two adjustable coefficients ( and ); (b) is independent of and shear stress acting alone or with one more shear stress; (c) contains a geometric nonlinear term describing contribution of all shear stresses without any additional adjustable parameters.
For a neglected effect of shear stresses, an absolute deviation of from the linear expression (3) is within GPa for GPa and within GPa for GPa, while its relative deviation is within for GPa.
XI SUMMARY
We augment standard - equilibrium diagram with the criteria for structural and electronic instabilities under controlled and predictable non-hydrostatic deformation, providing guidance for creating more accessible synthetic processing routes for new or known high-hydrostatic-pressure phases, including those with novel properties. To exemplify this pivotal concept, we performed a comprehensive DFT study of the PT between semiconducting Si I and metallic Si II under the application of a general stress tensor, and investigated the stress-strain curves, elastic lattice instabilities, and metallization. The PT pressure under hydrostatic condition is times larger than under uniaxial loading. Such a strong effect of nonhydrostaticity at least partially explains the significant difference between the experimental PT pressure (9-12 GPa) and the instability pressure of 75.81 GPa, as well as a scatter in the experimental data under quasi-hydrostatic conditions.
Although the stress-strain curves and their first derivatives are continuous, metallization precedes the structural PT. That means that under stresses there is a metallic Si I. Metallization can be caused by compressive or tensile stresses, and the effect of non-hydrostatic stresses is very strong. In the plane in Fig. 5, it is described by a closed contour (given roughly by two straight lines and a parabolic cap). Only one of the metallization lines is relatively close and approximately parallel to the Si ISi II PT line. Notably, along other two lines, metallization occurs deeply in the region of stability of Si I and is not causing the Si ISi II structural PT.
Our key result is that Si I Si II PT can be described by a critical value of the modified transformation work (Eq. 4), obtained from a phase field formalism. From this, a PT criterion was found to be linear in normal stresses and the effect of shear stresses is described via a geometric nonlinear term (with no additional adjustable constants). The PT criterion contains just two adjustable parameters, determined by the instability at two different normal stress states (no shears needed), straightforwardly obtained from DFT. Thus, our criterion accurately describes the lattice instability for a general stress tensor, which can then be assessed for optimal and easiest processing route.
While Si ISi II PT occurs due to elastic instability, the modified transformation work criterion (2), simplified in Eq. (4), is based on completely different principles and assumptions. In particular, it considers the entire dissipative PT process described by the transformation strain tensor and does not include the terms with a discontinuity in elastic moduli, to avoid nonlinearity in normal stresses. Using these paradoxical results, we formulated a problem of finding a fundamental relationship between the lattice instability and modified transformation work criterion, which will be studied in the future. The elastic instability analysis for the simplest model quadratic in energy [48] qualitatively reproduces our main results for relatively low stresses.
The present results are significant for creating new, more practically achievable and economic synthetic processing routes for discovery and stabilizing materials with novel properties, as well as for advancing and calibrating large-strain phase field models, e.g., in [28; 11].
Competition of the instability stresses [rather than the relative enthalpy, or Gibbs free energy, minima] can serve as a basis for phase selection.
Critically, the results enable ways to reduce PT pressure due to non-hydrostatic stresses and plastic strains by an order of magnitude or more [15; 16; 5; 17].
They can also be used for quantitative studies of the influence of crystal defects on phase transitions [19; 20], and quantitatively rationalize connections between PT conditions for ideal and real (defective) crystals.
ACKNOWLEDGEMENTS
For theory-guided synthesis, NAZ and DDJ are supported by the U.S. Department of Energy (DOE), Office of Science, Basic Energy Sciences, Materials Science and Engineering Division. NAZ completed this work under support from Advanced Manufacturing Office of the Office of Energy Efficiency and Renewable Energy through CaloriCool™, focused on applications to first-order phase transitions in caloric materials.
Ames Laboratory is operated for DOE by Iowa State University under contract DE-AC02-07CH11358.
VIL and HC acknowledge support from NSF (CMMI-1536925 and DMR-1434613) ARO (W911NF-17-1-0225), and ONR (N00014-16-1-2079). The MD simulations were performed at Extreme Science and Engineering Discovery Environment (XSEDE), allocations TG-MSS140033 and MSS170015.
References
- Tonkov and Ponyatovsky [2004] E Yu Tonkov and EG Ponyatovsky, Phase transformations of elements under high pressure, Vol. 4 (CRC press, 2004).
- Zarkevich and Johnson [2015a] N. A. Zarkevich and D. D. Johnson, “Coexistence pressure for a martensitic transformation from theory and experiment: Revisiting the bcc-hcp transition of iron under pressure,” Phys. Rev. B 91, 174104 (2015a).
- Schindler and Vohra [1995] T.L. Schindler and Yogesh K Vohra, “A micro-raman investigation of high-pressure quenched graphite,” Journal of Physics: Condensed Matter 7, L637 (1995).
- Solozhenko [1995] Vladimir L Solozhenko, “Boron nitride phase diagram. state of the art,” International Journal of High Pressure Research 13, 199–214 (1995).
- Ji et al. [2012] Cheng Ji, Valery I Levitas, Hongyang Zhu, Jharna Chaudhuri, Archis Marathe, and Yanzhang Ma, “Shear-induced phase transition of nanocrystalline hexagonal boron nitride to wurtzitic structure at room temperature and lower pressure,” Proceedings of the National Academy of Sciences of the U.S.A. 109, 19108–19112 (2012).
- Hill and Milstein [1977] Rodney Hill and Frederick Milstein, “Principles of stability analysis of ideal crystals,” Physical Review B 15, 3087 (1977).
- Milstein et al. [1995] Frederick Milstein, Jochen Marschall, and Huei Eliot Fang, “Theoretical bcc⇆ fcc transitions in metals via bifurcations under uniaxial load,” Physical Review Letters 74, 2977 (1995).
- Wang et al. [1993] Jinghan Wang, Sidney Yip, SR Phillpot, and Dieter Wolf, “Crystal instabilities at finite strain,” Physical Review Letters 71, 4182 (1993).
- Grimvall et al. [2012] Göran Grimvall, Blanka Magyari-Köpe, Vidvuds Ozoliņš, and Kristin A Persson, “Lattice instabilities in metallic elements,” Reviews of Modern Physics 84, 945 (2012).
- Pokluda et al. [2015] J Pokluda, M Černỳ, M Šob, and Y Umeno, “Ab initio calculations of mechanical properties: Methods and applications,” Progress in Materials Science 73, 127–158 (2015).
- Levitas et al. [2017a] Valery I Levitas, Hao Chen, and Liming Xiong, “Lattice instability during phase transformations under multiaxial stress: Modified transformation work criterion,” Physical Review B 96, 054118 (2017a).
- Levitas et al. [2017b] Valery I Levitas, Hao Chen, and Liming Xiong, “Triaxial-stress-induced homogeneous hysteresis-free first-order phase transformations with stable intermediate phases,” Physical review letters 118, 025701 (2017b).
- Grinfelʹd [1991] MJ Grinfelʹd, Thermodynamic Methods in the Theory of Heterogeneus Systems (Longman Scientific and Technical, 1991).
- Levitas [1998] Valery I Levitas, “Thermomechanical theory of martensitic phase transformations in inelastic materials,” International Journal of Solids and Structures 35, 889–940 (1998).
- Levitas [2004] Valery I Levitas, “High-pressure mechanochemistry: conceptual multiscale theory and interpretation of experiments,” Physical Review B 70, 184118 (2004).
- Blank and Estrin [2013] Vladimir Davydovich Blank and Emmanuel Isakovich Estrin, Phase transitions in solids under high pressure (CRC Press, 2013).
- Edalati and Horita [2016] Kaveh Edalati and Zenji Horita, “A review on high-pressure torsion (hpt) from 1935 to 1988,” Materials Science and Engineering: A 652, 325–352 (2016).
- Levitas [2018a] Valery I Levitas, “High pressure phase transformations revisited,” Journal of Physics: Condensed Matter 30, 163001 (2018a).
- Levitas and Javanbakht [2014] Valery I Levitas and Mahdi Javanbakht, “Phase transformations in nanograin materials under high pressure and plastic shear: nanoscale mechanisms,” Nanoscale 6, 162–166 (2014).
- Javanbakht and Levitas [2016] Mahdi Javanbakht and Valery I Levitas, “Phase field simulations of plastic strain-induced phase transformations under high pressure and large shear,” Physical Review B 94, 214104 (2016).
- Mizushima et al. [1994] Kazuki Mizushima, Sidney Yip, and Efthimios Kaxiras, “Ideal crystal stability and pressure-induced phase transition in silicon,” Physical Review B 50, 14952 (1994).
- Gaál-Nagy et al. [2001a] K Gaál-Nagy, M Schmitt, P Pavone, and D Strauch, “Ab initio study of the high-pressure phase transition from the cubic-diamond to the -tin structure of si,” Computational materials science 22, 49–55 (2001a).
- Domnich et al. [2004] Vladislav Domnich, Daibin Ge, and Yury Gogotsi, “Indentation-induced phase transformations in semiconductors,” High Pressure Surface Science and Engineering , 381–442 (2004).
- Umeno and Černỳ [2008] Yoshitaka Umeno and Miroslav Černỳ, “Effect of normal stress on the ideal shear strength in covalent crystals,” Physical Review B 77, 100101 (2008).
- Černỳ et al. [2012] Miroslav Černỳ, Petr Řehák, Yoshitaka Umeno, and Jaroslav Pokluda, “Stability and strength of covalent crystals under uniaxial and triaxial loading from first principles,” Journal of Physics: Condensed Matter 25, 035401 (2012).
- Telyatnik et al. [2016] RS Telyatnik, AV Osipov, and SA Kukushkin, “Ab initio modelling of nonlinear elastoplastic properties of diamond-like c, sic, si, ge crystals upon large strains.” Materials Physics & Mechanics 29 (2016).
- Patten et al. [2004] John A. Patten, Harish Cherukuri, and Jiwang Yan, “Ductile regime machining of semiconductors and ceramics,” High Pressure Surface Science and Engineering , 543–632 (2004).
- Levitas [2013] Valery I Levitas, “Phase-field theory for martensitic phase transformations at large strains,” International Journal of Plasticity 49, 85–118 (2013).
- Levitas [2018b] Valery I. Levitas, “Phase field approach for stress- and temperature-induced phase transformations that satisfies lattice instability conditions. part i. general theory,” Int. J. Plast. (2018b).
- Kresse and Hafner [1993] Georg Kresse and Jürgen Hafner, “Ab initio molecular dynamics for liquid metals,” Physical Review B 47, 558 (1993).
- Kresse and Hafner [1994] Georg Kresse and Jürgen Hafner, “Ab initio molecular-dynamics simulation of the liquid-metal–amorphous-semiconductor transition in germanium,” Physical Review B 49, 14251 (1994).
- Kresse and Furthmüller [1996] Georg Kresse and Jürgen Furthmüller, “Efficiency of ab-initio total energy calculations for metals and semiconductors using a plane-wave basis set,” Computational materials science 6, 15–50 (1996).
- Blöchl [1994] Peter E Blöchl, “Projector augmented-wave method,” Physical review B 50, 17953 (1994).
- Kresse and Joubert [1999] Georg Kresse and D Joubert, “From ultrasoft pseudopotentials to the projector augmented-wave method,” Physical Review B 59, 1758 (1999).
- Perdew et al. [1996] John P Perdew, Kieron Burke, and Matthias Ernzerhof, “Generalized gradient approximation made simple,” Physical review letters 77, 3865 (1996).
- Monkhorst and Pack [1976] Hendrik J Monkhorst and James D Pack, “Special points for brillouin-zone integrations,” Physical review B 13, 5188 (1976).
- Johnson [1988] Duane D Johnson, “Modified broyden’s method for accelerating convergence in self-consistent calculations,” Physical Review B 38, 12807 (1988).
- Zarkevich and Johnson [2015b] N A Zarkevich and D D Johnson, “Nudged-elastic band method with two climbing images: finding transition states in complex energy landscapes,” J. Chem. Phys. 142, 024106 (2015b).
- Balamane et al. [1992] H Balamane, T Halicioglu, and WA Tiller, “Comparative study of silicon empirical interatomic potentials,” Physical Review B 46, 2250 (1992).
- [40] “See supplemental material at http://link.aps.org/supplemental/ for files with primary data of our simulations and data for each figure,” .
- Yim and Paff [1974] WM Yim and RJ Paff, “Thermal expansion of aln, sapphire, and silicon,” Journal of Applied Physics 45, 1456–1457 (1974).
- Gaál-Nagy et al. [2001b] K Gaál-Nagy, M Schmitt, P Pavone, and D Strauch, “Ab initio study of the high-pressure phase transition from the cubic-diamond to the -tin structure of si,” Computational materials science 22, 49–55 (2001b).
- Gaál-Nagy and Strauch [2006] Katalin Gaál-Nagy and Dieter Strauch, “Phonons in the -tin, i m m a, and sh phases of silicon from ab initio calculations,” Physical Review B 73, 014117 (2006).
- Zarkevich et al. [2018] N. A. Zarkevich, Valery I. Levitas, Hao Chen, and D. D. Johnson, to be published (2018).
- Zarkevich and Johnson [2015c] N. A. Zarkevich and D. D. Johnson, “Magneto-structural transformations via a solid-state nudged elastic band method: Application to iron under pressure,” J. Chem. Phys. 143, 064707 (2015c), https://doi.org/10.1063/1.4927778 .
- Deb et al. [2001] Sudip K Deb, Martin Wilding, Maddury Somayazulu, and Paul F McMillan, “Pressure-induced amorphization and an amorphous–amorphous transition in densified porous silicon,” Nature 414, 528 (2001).
- Levitas [2005] Valery I Levitas, “Crystal-amorphous and crystal-crystal phase transformations via virtual melting,” Physical review letters 95, 075701 (2005).
- Levitas [2017] Valery I Levitas, “Elastic model for stress–tensor-induced martensitic transformation and lattice instability in silicon under large strains,” Materials Research Letters 5, 554–561 (2017).