The abundance of satellite galaxies in the inner region of CDM Milky Way sized haloes
Abstract
The concordance CDM cosmology predicts tens of satellite galaxies distributed in the inner region () of the Milky Way (MW), yet at most were discovered at present day, including 3 discovered very recently by Dark Energy Survey (DES) and 5 from other surveys (e.g. PanSTARRS, MagLiteS). We use ultra-high resolution simulations of MW sized dark matter haloes from the Aquarius project, combined with GalForm semi-analytical galaxy formation model, to investigate properties of the model satellite galaxy population inside of MW sized haloes. On average, in each halo this model predicts about inner satellite galaxies, among them are comparable to the classic satellites in the luminosity, these are in stark contrast to the corresponding numbers in observations. We further investigate the survivability of these model inner satellites in the presence of a central stellar disk with a set of ideal simulations. These are done by re-evolving a quarter (30) of the whole Aquarius inner satellite galaxies (121) by including a static disk potential in addition to the MW halo. Our finding is that the additional disk completely disrupt 40 percents of these satellites and results in satellite galaxies within the of each Aquarius at the end, in reasonably well agreement with observations.
keywords:
method: numerical – cosmology: theory – galaxies: haloes – galaxies: dwarf – dark matter.1 Introduction
The Cold Dark Matter model (dubbed CDM) has been extremely successful to predict various observational properties and the evolution of the large-scale structure of the Universe. However, it is not equally well to predict the galaxy properties on the galactic scale and below. For instance, there has been a long debate on whether the CDM theory can accommodate the observed abundance and internal structure of satellite galaxies in our Milky Way, namely the so-called “missing satellite”(Klypin et al., 1999; Moore et al., 1999), “core and cusp”(Simon et al., 2005; de Blok, 2010; Strigari et al., 2010; Walker & Peñarrubia, 2011; Martinez, 2015) and “too big to fail”(Boylan-Kolchin et al., 2011, 2012) problems.
Gao et al. (2010) (hereafter G10) put forward a related problem on this regard. In G10, the authors use a set of ultra-high resolution dark matter only simulations of Milky Way (MW) sized haloes, and find there are quite abundant dark matter subhaloes residing in the inner of their host haloes, among these about should be relics of the first galaxies shining light at present day because they were massive enough to cool by atomic hydrogen cooling before reionization. On the contrary, among the observed MW satellite galaxies from SDSS, DES and other surveys (PanSTARRS, MagLiteS) combined, 12 are within the same distance at present time, including not conclusively confirmed ones. Hence, the results may point out a discrepancy in the abundance of satellites in the inner region of the MW between observation and theory.
The galaxy formation model used in G10 is robust yet simple by using atomic cooling argument to judge whether or not a halo can form stars, but make no prediction on properties of the satellite galaxies. In this short paper, we compensate G10 by taking advantage of the power of a sophisticated galaxy formation model GalForm (Bower et al., 2006; Font et al., 2011), to make more detailed predictions of properties of inner satellite galaxies in the MW sized dark matter haloes, and compare with observations to investigate whether or not the abundance of inner satellite galaxy is a problem of CDM Cosmology. Moreover, we will take into account the impact of a stellar disk in the centre of MW halo on the survivability of these inner satellite galaxies. Hydrodynamic simulations from previous studies on this subject often have a much poorer resolution, we compensate these studies by performing a sequence of ideal simulations with varying resolutions in order to carry out numerical convergence study.
The organization of this paper is as follows. In Section 2, we briefly introduce the numerical simulations and galaxy formation model used in this study. In Section 3, we use GalForm to predict the satellite population within of MW and compare them with observations. In Section 4, we present ideal simulations in order to assess the impact of a stellar disk on the survivability of the model inner satellite galaxies. In Section 5, we summarize our results and draw conclusions.
2 The Cosmological simulations
Numerical simulations used in this work comprise high resolution re-simulations of 5 individual MW sized dark matter haloes and their surroundings from the Aquarius Project (Springel et al., 2008). These dark matter haloes have masses in the range , comparable to typical values of our MW. These haloes are randomly selected samples from a large cosmological simulation, imposing a weak isolation criterion by requiring the candidate halo to have no companion with the mass greater than half of its own at a distance less than at (Navarro et al., 2010). No further additional constraints (e.g. the chance to find MW-like haloes with LMC and SMC liked satellites in a cosmological simulation (Busha et al., 2011a, b)) are applied.
Each Aquarius halo has been re-simulated with “zoom in” technique with various resolutions to carry out numerical convergence studies. Here we use the simulations with level 2 resolution which contains about particles inside the virial radius of each halo. Five of the six haloes (Aq-A to Aq-E) are used for our analysis, except for Aq-F which experienced a recent major merger event at (Wang et al., 2015).
The Aquarius simulation suits assume cosmological parameters as , , , and . These values deviate from the latest Planck results (Planck Collaboration et al., 2014, 2016), but this small offset has a negligible effect on our main results.
At each recorded snapshot, dark matter haloes are identified with the friends-of-friends (FoF) algorithm by linking particles separated by 0.2 times the mean inter-particle separation (Davis et al., 1985). Based upon the FoF group catalogue, the Subfind (Springel et al., 2001) is applied to identify local over-dense and self-bound dark matter subhaloes; merger trees are constructed by linking each subhalo at successive snapshots to its unique descendant using the algorithm described in Helly et al. (2003). We follow the baryonic evolution using the semi-analytic model GalForm developed by Font et al. (2011). The model explicitly follows the evolution of the dark matter halo within which a galaxy forms, and after the halo is accreted to a larger object and becomes a satellite galaxy.
Compared to an earlier version of GalForm (Bower et al., 2006), there are quite a few improvements in Font et al. (2011), including the use of a higher yield, a modified supernova feedback model and an earlier reionization epoch model. The model (fbk:sat/rei:G+L) matches a large body of observational data on the MW satellite galaxies, whilst the authors did not carry out a detailed comparison of the inner satellite galaxy population in observation and their model as we study it here.
3 The inner satellite galaxies in simulations and observations
| Name | ||||
|---|---|---|---|---|
| (mag) | ||||
| Classic / SDSSa | ||||
| Sagittarius dSph | 18.0 / 26.0 | -13.5 | ||
| Segue I | 28.0 / 23.0 | -1.5 | ||
| Ursa Major II | 38.0 / 32.0 | -4.2 | ||
| Bootes II | 40.0 / 42.0 | -2.7 | ||
| DES | ||||
| Tucana III (DES J2356-5935) | 23.0 / 25.0 | -2.4 | — | |
| Ret II (DES J0335.6-5403) b,c | 32.0 / 30.0 | -3.6 | ||
| Cetus II (DES J0117-1725) | 32.0 / 30.0 | 0.0 | — | |
| DECam | ||||
| Hydrus Id | 20.0 / 27.6 | -4.7 | ||
| Pan-STARRS | ||||
| Draco II | 22.0 / 20.0 | -2.9 | — | — |
| Triangulum IIf | 36.0 / 30.0 | -1.8 | — | — |
| MagLiteS | ||||
| Carina IIIg | 29.0 / 27.8 | -2.4 | — | — |
| Carina II g | 37.0 / 36.2 | -4.5 | — | — |
a McConnachie (2012), b Drlica-Wagner et al. (2015), c Koposov et al. (2015), d Koposov et al. (2018), e Laevens et al. (2015b), f Laevens et al. (2015a), g Torrealba et al. (2018)
† Dwarf galaxy whose identity has not been conclusively confirmed (private communication with Josh Simon).
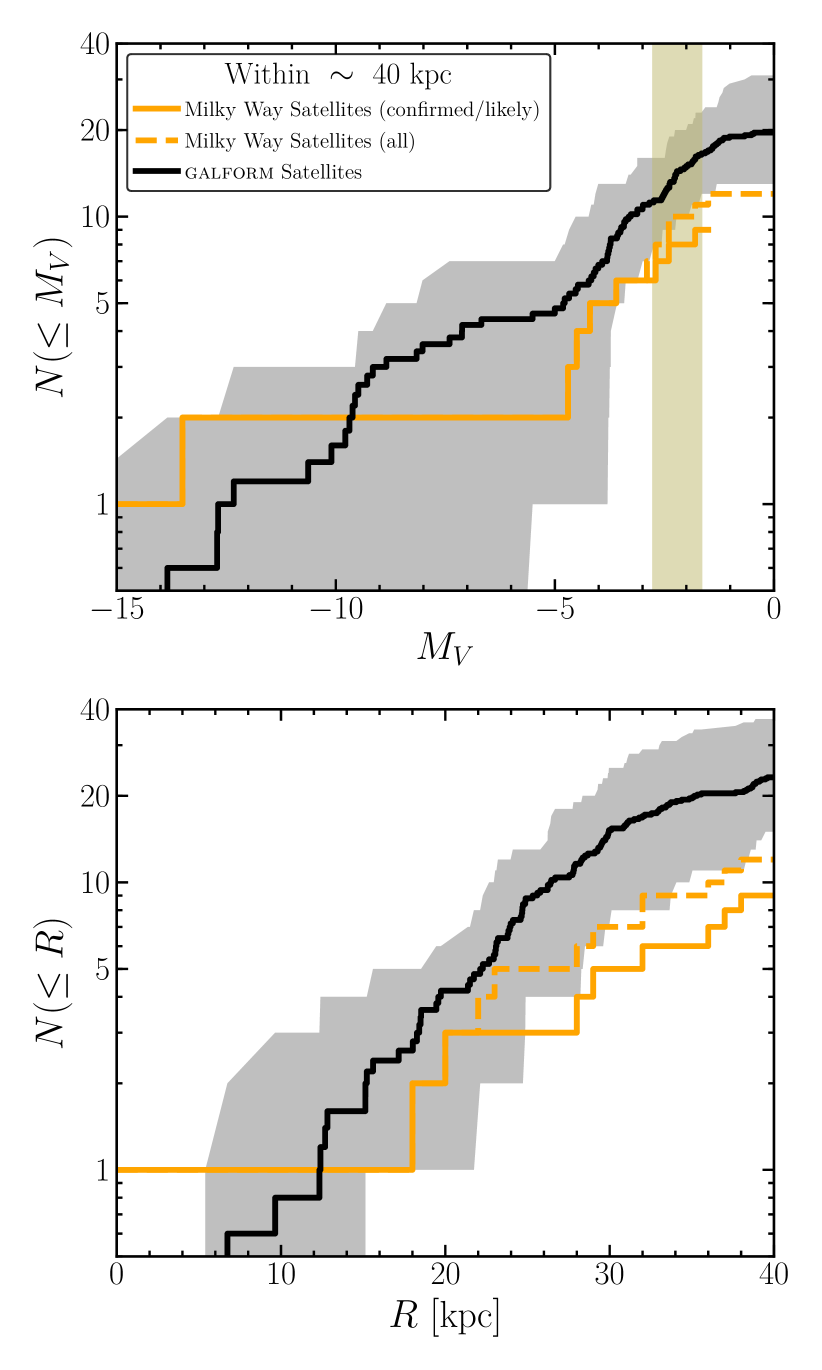
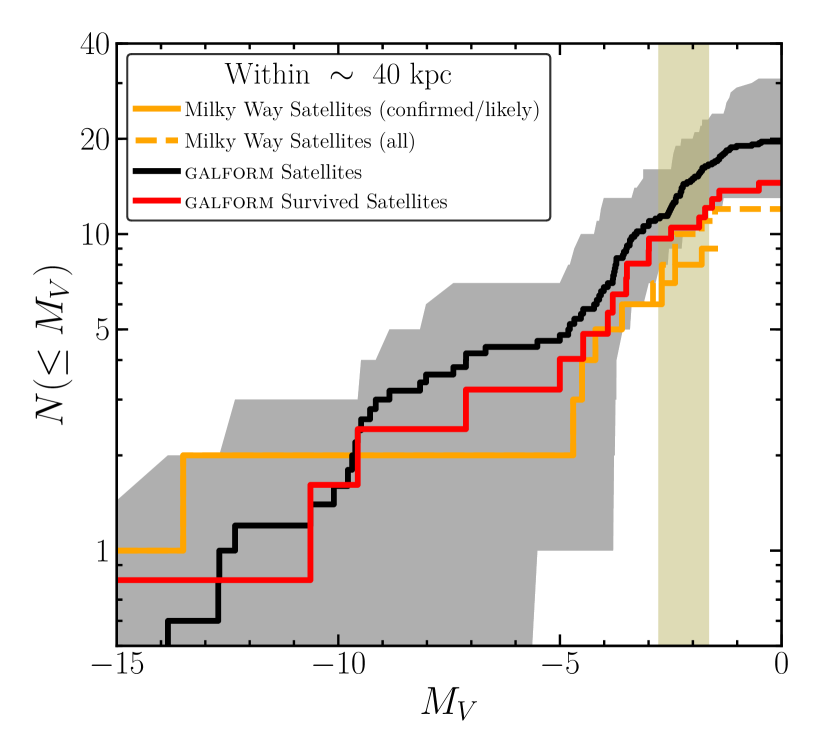
In Figure 1 we present the cumulative band luminosity function and the spatial distribution of the model satellite galaxies within of five Aquarius haloes. The dark solid line shows the averaged count and the light shaded area displays the whole scatter of five haloes. We also show results for the known satellite galaxies within the same distance in the same figure with orange solid line. These known satellite galaxies are collected from SDSS (McConnachie, 2012, Table1-3), DES (Drlica-Wagner et al., 2015; Koposov et al., 2015, 2018), PanSTARRS (Laevens et al., 2015a, b), and MagLiteS (Torrealba et al., 2018). We list the properties of these satellite galaxies in Table 1. Note, 3 of them are not conclusively confirmed as dwarf galaxies. Including these 3, the luminosity function of the observed inner satellite galaxies is shown as orange dashed line. The vertical yellow shaded area indicates the observational detect limits of satellite galaxy of the SDSS survey (Koposov et al., 2008; Koposov et al., 2009; Tollerud et al., 2008).
Apparently, most of these inner model satellite galaxies are detectable with SDSS survey. On average, our simulations predict about 20 satellite galaxies within of the MW, in agreement with the simple model of G10. of them are as bright as classic satellites identified in observations with . Comparing with observations, our simulations predict 2 times more inner satellite galaxies than the known ones in current observations. In particular, our model predicts about 2 times more satellite galaxies more bright than .
The cumulative spatial distribution of these model and observational inner satellite galaxies are presented in the lower panel of the same figure. Comparing the two, they only roughly agree with each other within . But the model predicts much more satellite galaxies beyond it. Note, almost no satellite galaxies are founded within this distance in the latest highest resolution hydrodynamic simulations of the MW, e.g. the APOSTLE project (Sawala et al., 2016; Sawala et al., 2017) and the Latte simulation (Wetzel et al., 2016; Garrison-Kimmel et al., 2017). In the later section, we will show that this is very likely due to a poor numerical resolution of these simulations.
The Aquarius haloes are simulated with dark matter only, without considering the central gaiant disk like MW. The presence of a disk may have a substantial impact on the abundance of satellite galaxies, especially in the inner region at which we are discussing in this paper. The impact of a disk on the abundance of inner satellite galaxies has been investigated in previous studies (e.g. D’Onghia et al., 2010; Yurin & Springel, 2015; Errani et al., 2017; Jethwa et al., 2016; Garrison-Kimmel et al., 2017). We compensate these studies in the following sections by performing a series of much higher resolution numerical experiments.
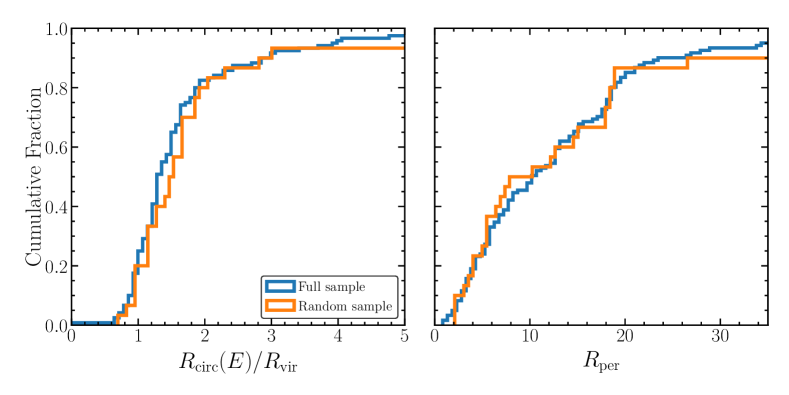
Before resorting to the numerical experiments, we first make a rough assessment of the impact of disk on the tidal disruption of these model inner satellite galaxies by examining their orbit parameter distribution. If their pericentric radius is within the size of the MW disk, the impact due to disk is expected to be strong and vice versa (Nadler et al., 2017; Errani et al., 2017). In Figure 2, we present the cumulative distribution function of the orbital properties for the inner satellite galaxies in Aquarius simulations. Here we characterise the orbit properties with the first pericentric radius since infall, and , the radius of the circular orbit corresponding to the orbital energy of the satellite at the time of infall, expressed in virial radius of the host halo. 111Defined as the radius within which the mean density is 200 times of the critical density at the time of infall.
Clearly, about 50 per cent of satellite galaxies have their first pericentric radius within , indicating that these satellites are prone to be affected by the disk. Apart from the pericentre, orbital energy is also an important parameter to the tidal disruption of satellite galaxy, we show the orbital energy distribution of our whole sample in the right-hand panel of the same figure.
4 The impact of a stellar disk on the abundance of inner satellite galaxies
4.1 Models and numerical experiments
Model of the MW. The MW comprises a dark matter halo, a disk and a bulge. For simplicity, we neglect the bulge component and treat the dark matter halo and disk components as rigid background potentials and thus neglect the effect of dynamical friction. We assume that dark matter distribution of the MW follows the NFW (Navarro et al., 1996) profile. The potential corresponding to a NFW halo reads
| (1) |
is defined as the virial radius within which the mean over-density is 200 times of the critical density and the corresponding mass within it is defined as the virial mass . In this work, the MW sized halo is modelled with , and concentration . These parameters are chosen according to previous works (Kazantzidis et al., 2004a; Peñarrubia et al., 2010; Wang et al., 2012).
We model the disk as an embedded potential in cylindrical coordinates which follows an axisymmetric disk model (Miyamoto & Nagai, 1975):
| (2) |
with radial and vertical scale lengths and , and mass .
Model of satellite galaxy. The orbiting satellite galaxy is discretized with N-body model by generating an equilibrium particle realisation, the density distribution follows a truncated NFW profile (Kazantzidis et al., 2004b)
and are the characteristic density and the concentration of the satellite respectively. is a parameter that controls the sharpness of the slope transition towards an exponential cutoff and is set to 0.3 times of satellite’s virial radius . To obtain a continuous logarithmic slope, is defined as
| (3) |
Throughout this work, we adopt a cuspy NFW density profile with .
| Run | |||||
|---|---|---|---|---|---|
| (1) | (2) | (3) | (4) | (5) | (6) |
| halo.m1e8 | 7.548 | 13.127 | 0.34 | ||
| 0.10 | |||||
| 0.03 | |||||
| 0.01 |
The coordinate system is centred on the MW halo. The disk potential is fixed on the plane. The N-body simulations presented in this study were carried out with the P-GADGET3 code (Springel, 2005) under isolated boundary conditions.
| Run | |||
|---|---|---|---|
| Orbit I | 1.34 | 16.26 | (-1.19,0,0.04) |
| Orbit II | 3.25 | (-1.18,0,0.14) |
4.2 Resolution Test
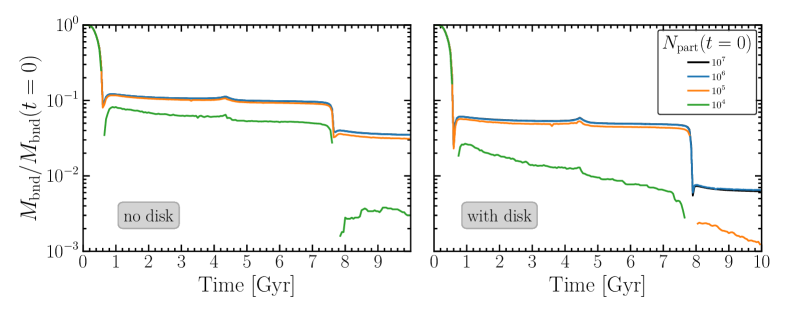
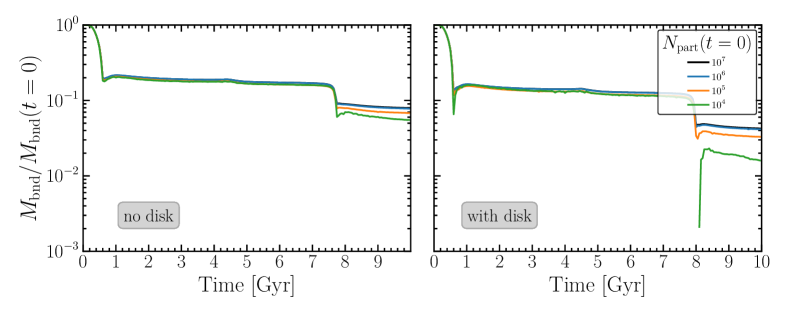
It is important to first identify the required numerical resolution to reliably resolve the dynamics of satellite galaxies. To this end, we evolve a satellite galaxy at varying numerical resolutions and assume two sets of orbital parameters. The mass and orbital energy parameter of the satellite are assumed to be and , respectively. These parameters are chosen to closely match the typical values of the satellite galaxies in the Aquarius simulation suits. We adopt two pericentres for the tests by choosing values of to be 10 and 50 percentiles of the distribution function shown in the right panel of Figure 2, representing an extreme and a typical case to examine the impact of the disk on the tidal disruption of the galaxy.
We assume the total mass profile of the galaxy following a NFW profile. Note, some observational results suggest that MW satellite galaxies may have cored profiles (e.g. Gilmore et al., 2007; Adams et al., 2014; Oh et al., 2015). As shown by Peñarrubia et al. (2010) and Errani et al. (2017), the survivability of satellite galaxy in numerical simulations does depend on the inner profile of their dark matter halo. Galaxies with cored inner density profile are more prone to be disrupted than their cuspy counterparts. However, some recent theoretical works (Fattahi et al., 2016; Genina et al., 2018) argued that the results of the cored profiles suggested in observation are not convincing. Hence we adopt the cuspy NFW profile in this study for simplicity. The concentration parameter of the halo is set to be , corresponding to the value estimated by the halo mass-concentration relation given by Duffy et al. (2008).
The model galaxies are starting from the virial radius of the MW halo with the coordinates , and are evolved for 10 Gyrs which corresponds to the typical infall redshift of satellite galaxies in the Aquarius simulation suits.
We carried out numerical experiments with different particle numbers, and . For the galaxy, we follow its evolution in the MW halo model with and without a disk component under two sets of orbital parameters. Subfind (Springel et al., 2001) is applied to calculate the residual bound mass of each galaxy.
In Figure 3, we present the evolution of the bound mass fraction of the satellite galaxy with different resolutions and different orbital parameters. Upper panels show results for the extreme orbit case Orbit I and bottom panels are for the typical one, Orbit II. Simulations excluding and including the disk are shown in the left-hand and right-hand panels, respectively. In both cases, the numerical resolution has a large effect on the tidal distribution of the satellite galaxy. Using a number of particles like , as similar to the most up-to-date highest resolution hydrodynamic simulations, severely underestimate the survivability of the galaxy, particularly in the cases including the disk. For the extreme orbital parameter, our numerical experiments converge at a particle number . The particle number for the convergence is less for the typical case of Orbit II, which is about . From a conservative consideration, in the follows, we will perform all our experiments with a particle number for each satellite galaxy. This number is compatible with that used in previous works (Chang et al., 2013; Errani et al., 2017; Frings et al., 2017) and is much larger than the highest resolution hydrodynamic simulation in the community. This should partially account for the fact that these simulations nearly have no satellite galaxies near the centre.
4.3 The impact of the MW disk on the abundance of the inner satellite galaxies
To explore the impact of the disk on the tidal disruption of the model inner satellite galaxies, we randomly select 30 galaxies from our full 121 inner satellite galaxy sample. The orange lines in Figure 2 display distributions of orbital parameters of this sub-sample. As can be seen, they agree very well with the whole sample, suggesting that they are a fair representative sample of the Aquarius inner satellite galaxies. For each galaxy in the randomly selected sample, we follow its evolution from its infall time with particles in the MW model with the disk we described in the previous section. The mass distribution of each galaxy is assumed to follow a NFW profile. Its mass, orbital parameters, concentration parameter and position are set to be the corresponding values at infall extracted from the Aquarius simulation suits. The disk is fixed on the plane. We also re-run 10 of these galaxies by varying the disk plane to be and , and find the results hardly change. In the final outcome of our 30 simulations, 12 (40%) galaxies are completely disrupted due to the presence of the disk. Here we define a galaxy is completely disrupted when Subfind is not able to find more than 32 bound particles. Applying the result to the whole Aquarius inner galaxy sample, 73 out of 121 model inner satellite galaxies should survive to the present day. Namely on average, each Aquarius halo contains 14 inner satellite galaxies after taking into account the effect of the disk. We present the corrected cumulative band luminosity function of the model satellite galaxy in Figure 4, it agrees with observations reasonably well when considering the scatter among 5 Aquarius haloes.
5 Conclusions
In this work we make use of the Aquarius project–a set of ultra-high resolution simulations of MW sized dark matter haloes, combined with a sophisticated semi-analytical galaxy formation model-GalForm, to investigate the abundance of satellite galaxies residing within of halo centre. Using a simple atomic cooling argument, G10 suggested that the abundance of MW inner satellite galaxies may be incompatible with observations. We use GalForm to predict properties of these CDM model inner satellite galaxies. On average, about 20 satellite galaxies reside within of each Aquarius halo, about a factor of times exceeding the observed number. Most of these model inner satellite galaxies are brighter than the detection limit of SDSS survey, 5 of them are as bright as classic satellite galaxies.
Given the apparent inconsistency between the CDM prediction and observations, we perform a series of numerical experiments to examine the impact of the disk on the abundance of the inner model satellite galaxies. To this end, we randomly select a quarter of the Aquarius inner satellite galaxies. For each of them, we follow its evolution from the infall time to the present day, with the orbital parameters and positions taken from the original Aquarius simulation suits. Our finding is that the MW disk has a strong effect to disrupt satellite galaxies with very close pericentric parameters. As a result, in the presence of the disk, the number of the model inner satellite galaxies can be reduced by per cent when compared with the case without the disk. For each Aquarius halo, the model predicts satellite galaxies within , in reasonable well agreement with observations.
Note, when we evolve each galaxy in the simulation, we assume static potentials for the MW halo and the disk with present-day values during its entire evolution. This neglects facts that the MW only acquires a fraction of its present-day mass by then and the MW disk may grow significantly after the infall of the satellite galaxy. Hence, our results may overestimate the impact of the disk on the disruption of the inner satellite galaxies. On the other hand, we may underestimate the tidal disruption of satellite galaxies due to baryonic effect as discussed in Garrison-Kimmel et al. (2017). However, the strong impact on the disruption of satellites by disk shown in this work certainly reduces the number of the model inner satellite galaxies by a large factor, which significantly relieves the large discrepancy between the theory and observations. A fully convincing work on this requires an ultra-high resolution and realistic hydrodynamic simulation of the MW galaxy. According to our numerical experiments, at least particle is required to follow each satellite galaxies, thus in order to resolve a typical MW inner dwarf galaxy with a mass , a dark matter particle mass resolution is required, far beyond the highest resolution achieved at present day.
Acknowledgement
We appreciate the help of the anonymous referee to improve this manuscript. We thank Andrew Cooper for providing us GalForm galaxy catalogue of the Aquarius simulation suits. We are grateful to Josh Simon for clarifying the abundance of the inner MW satellite galaxies. We are also grateful to Juntai Shen for useful discussions. We acknowledge support from the National Key Program for Science and Technology Research and Development (2015CB857005,2017YFB0203300) and NSFC grants (11390372,11425312,11503032,11573031,11851301 and 11873051). ML also acknowledges support from CPSF-CAS joint Foundation for Excellent Postdoctoral Fellows No.2015LH0014.
References
- Adams et al. (2014) Adams J. J., et al., 2014, ApJ, 789, 63
- Bower et al. (2006) Bower R. G., Benson A. J., Malbon R., Helly J. C., Frenk C. S., Baugh C. M., Cole S., Lacey C. G., 2006, MNRAS, 370, 645
- Boylan-Kolchin et al. (2011) Boylan-Kolchin M., Bullock J. S., Kaplinghat M., 2011, MNRAS, 415, L40
- Boylan-Kolchin et al. (2012) Boylan-Kolchin M., Bullock J. S., Kaplinghat M., 2012, MNRAS, 422, 1203
- Busha et al. (2011a) Busha M. T., Marshall P. J., Wechsler R. H., Klypin A., Primack J., 2011a, ApJ, 743, 40
- Busha et al. (2011b) Busha M. T., Wechsler R. H., Behroozi P. S., Gerke B. F., Klypin A. A., Primack J. R., 2011b, ApJ, 743, 117
- Chang et al. (2013) Chang J., Macciò A. V., Kang X., 2013, MNRAS, 431, 3533
- D’Onghia et al. (2010) D’Onghia E., Springel V., Hernquist L., Keres D., 2010, ApJ, 709, 1138
- Davis et al. (1985) Davis M., Efstathiou G., Frenk C. S., White S. D. M., 1985, ApJ, 292, 371
- Drlica-Wagner et al. (2015) Drlica-Wagner A., et al., 2015, ApJ, 813, 109
- Duffy et al. (2008) Duffy A. R., Schaye J., Kay S. T., Dalla Vecchia C., 2008, MNRAS, 390, L64
- Errani et al. (2017) Errani R., Peñarrubia J., Laporte C. F. P., Gómez F. A., 2017, MNRAS, 465, L59
- Fattahi et al. (2016) Fattahi A., Navarro J. F., Sawala T., Frenk C. S., Sales L. V., Oman K., Schaller M., Wang J., 2016, preprint, (arXiv:1607.06479)
- Font et al. (2011) Font A. S., et al., 2011, MNRAS, 417, 1260
- Frings et al. (2017) Frings J., Macciò A., Buck T., Penzo C., Dutton A., Blank M., Obreja A., 2017, MNRAS, 472, 3378
- Gao et al. (2010) Gao L., Theuns T., Frenk C. S., Jenkins A., Helly J. C., Navarro J., Springel V., White S. D. M., 2010, MNRAS, 403, 1283
- Garrison-Kimmel et al. (2017) Garrison-Kimmel S., et al., 2017, MNRAS, 471, 1709
- Genina et al. (2018) Genina A., et al., 2018, MNRAS, 474, 1398
- Gilmore et al. (2007) Gilmore G., Wilkinson M. I., Wyse R. F. G., Kleyna J. T., Koch A., Evans N. W., Grebel E. K., 2007, ApJ, 663, 948
- Helly et al. (2003) Helly J. C., Cole S., Frenk C. S., Baugh C. M., Benson A., Lacey C., 2003, MNRAS, 338, 903
- Jethwa et al. (2016) Jethwa P., Belokurov V., Erkal D., 2016, preprint, (arXiv:1612.07834)
- Kazantzidis et al. (2004a) Kazantzidis S., Magorrian J., Moore B., 2004a, ApJ, 601, 37
- Kazantzidis et al. (2004b) Kazantzidis S., Mayer L., Mastropietro C., Diemand J., Stadel J., Moore B., 2004b, ApJ, 608, 663
- Klypin et al. (1999) Klypin A., Kravtsov A. V., Valenzuela O., Prada F., 1999, ApJ, 522, 82
- Koposov et al. (2008) Koposov S., et al., 2008, ApJ, 686, 279
- Koposov et al. (2009) Koposov S. E., Yoo J., Rix H.-W., Weinberg D. H., Macciò A. V., Escudé J. M., 2009, ApJ, 696, 2179
- Koposov et al. (2015) Koposov S. E., et al., 2015, ApJ, 811, 62
- Koposov et al. (2018) Koposov S. E., et al., 2018, Monthly Notices of the Royal Astronomical Society, 479, 5343
- Laevens et al. (2015a) Laevens B. P. M., et al., 2015a, The Astrophysical Journal, 802, L18
- Laevens et al. (2015b) Laevens B. P. M., et al., 2015b, The Astrophysical Journal, 813, 44
- Martinez (2015) Martinez G. D., 2015, MNRAS, 451, 2524
- McConnachie (2012) McConnachie A. W., 2012, AJ, 144, 4
- Miyamoto & Nagai (1975) Miyamoto M., Nagai R., 1975, PASJ, 27, 533
- Moore et al. (1999) Moore B., Ghigna S., Governato F., Lake G., Quinn T., Stadel J., Tozzi P., 1999, ApJ, 524, L19
- Nadler et al. (2017) Nadler E. O., Mao Y.-Y., Wechsler R. H., Garrison-Kimmel S., Wetzel A., 2017, preprint, (arXiv:1712.04467)
- Navarro et al. (1996) Navarro J. F., Frenk C. S., White S. D. M., 1996, ApJ, 462, 563
- Navarro et al. (2010) Navarro J. F., et al., 2010, MNRAS, 402, 21
- Oh et al. (2015) Oh S.-H., et al., 2015, AJ, 149, 180
- Peñarrubia et al. (2010) Peñarrubia J., Benson A. J., Walker M. G., Gilmore G., McConnachie A. W., Mayer L., 2010, MNRAS, 406, 1290
- Planck Collaboration et al. (2014) Planck Collaboration et al., 2014, A&A, 571, A1
- Planck Collaboration et al. (2016) Planck Collaboration et al., 2016, A&A, 594, A1
- Sawala et al. (2016) Sawala T., et al., 2016, MNRAS, 457, 1931
- Sawala et al. (2017) Sawala T., Pihajoki P., Johansson P. H., Frenk C. S., Navarro J. F., Oman K. A., White S. D. M., 2017, MNRAS, 467, 4383
- Simon et al. (2005) Simon J. D., Bolatto A. D., Leroy A., Blitz L., Gates E. L., 2005, ApJ, 621, 757
- Springel (2005) Springel V., 2005, MNRAS, 364, 1105
- Springel et al. (2001) Springel V., White S. D. M., Tormen G., Kauffmann G., 2001, MNRAS, 328, 726
- Springel et al. (2008) Springel V., et al., 2008, MNRAS, 391, 1685
- Strigari et al. (2010) Strigari L. E., Frenk C. S., White S. D. M., 2010, MNRAS, 408, 2364
- Tollerud et al. (2008) Tollerud E. J., Bullock J. S., Strigari L. E., Willman B., 2008, ApJ, 688, 277
- Torrealba et al. (2018) Torrealba G., et al., 2018, Monthly Notices of the Royal Astronomical Society, 475, 5085
- Walker & Peñarrubia (2011) Walker M. G., Peñarrubia J., 2011, ApJ, 742, 20
- Wang et al. (2012) Wang Y., Zhao H., Mao S., Rich R. M., 2012, MNRAS, 427, 1429
- Wang et al. (2015) Wang W., Han J., Cooper A. P., Cole S., Frenk C., Lowing B., 2015, MNRAS, 453, 377
- Wetzel et al. (2016) Wetzel A. R., Hopkins P. F., Kim J.-h., Faucher-Giguère C.-A., Kereš D., Quataert E., 2016, ApJ, 827, L23
- Yurin & Springel (2015) Yurin D., Springel V., 2015, MNRAS, 452, 2367
- de Blok (2010) de Blok W. J. G., 2010, Advances in Astronomy, 2010, 789293