Also at ]Albert Einstein Center for Fundamental Physics, University of Bern, Bern, SwitzerlandAlso at ]Kobayashi-Maskawa Institute, Nagoya University, Nagoya, JapanAlso at ]Coimbra Polytechnic - ISEC, Coimbra, PortugalXENON Collaboration
Dark Matter Search Results from a One TonneYear Exposure of XENON1T
Abstract
We report on a search for Weakly Interacting Massive Particles (WIMPs) using 278.8 days of data collected with the XENON1T experiment at LNGS. XENON1T utilizes a liquid xenon time projection chamber with a fiducial mass of t, resulting in a 1.0 tyr exposure. The energy region of interest, [1.4, 10.6] ([4.9, 40.9] ), exhibits an ultra-low electron recoil background rate of events/. No significant excess over background is found and a profile likelihood analysis parameterized in spatial and energy dimensions excludes new parameter space for the WIMP-nucleon spin-independent elastic scatter cross-section for WIMP masses above 6 GeV/c2, with a minimum of cm2 at 30 GeV/c2 and 90% confidence level.
pacs:
95.35.+d, 14.80.Ly, 29.40.-n, 95.55.VjAn abundance of astrophysical observations suggests the existence of a non-luminous, massive component of the universe called dark matter (DM) wimp_hooper ; wimp_review . The Weakly Interacting Massive Particle (WIMP) is one of the most promising DM candidates, motivating numerous terrestrial and astronomical searches teresa_review ; indirect . The most successful class of direct detection experiments searching for WIMPs with masses between a few GeV/c2 to TeV/c2 have utilized liquid xenon (LXe) time projection chambers (TPCs) and set stringent limits on the coupling of WIMPs to matter, excluding the WIMP-nucleon spin-independent elastic cross-section, , for a 30 GeV/c2 WIMP to below xe_sr0 ; lux_dm ; panda_dm .
The XENON1T experiment xe_instrument , located at an average depth of 3600 m water-equivalent at the INFN Laboratori Nazionali del Gran Sasso (LNGS), is the largest such detector to date containing t of ultra-pure LXe with 2 t employed as the target material in the active volume. This PTFE-lined, diameter cylinder is instrumented above and below by arrays of 127 and 121 Hamamatsu R11410-21 3” photomultiplier tubes (PMTs) xe_pmts ; pmt2 . A particle incident on the LXe target deposits energy that produces a prompt scintillation signal (S1) and ionization electrons. The active volume is defined by a cathode and a grounded gate electrode separated by to provide a drift field for the electrons. These electrons are extracted into gaseous xenon (GXe) where they produce proportional scintillation light (S2) via electroluminescence through a kV/cm multiplication field. The S2/S1 size ratio allows for discrimination between nuclear recoils (NRs; from WIMPs or neutrons) and electronic recoils (ERs; from or ). The time delay between S1 and S2 and the localization of the S2 pattern in the top PMT array indicate the vertical and horizontal position of the interaction, respectively. The detector is surrounded by an active water Cherenkov muon veto system xe_muonveto .
This DM search combines data from two science runs which spanned from November 22, 2016 to January 18, 2017 (SR0 xe_sr0 , re-analyzed in this work) and February 2, 2017 to February 8, 2018 (SR1), with the brief interruption due to an earthquake. The livetime is reduced by 7.8% (1.2%) for SR0 (SR1) when the data acquisition system was insensitive to new events, 1.2% when the muon veto was either disabled or triggered in coincidence with the TPC, and 4.4% after high-energy events in the TPC that induced photo-ionization and delayed electron extraction activity sorensen , resulting in 32.1 days and 246.7 days for SR0 and SR1, respectively. The two science runs differ in the cathode voltage of kV (SR0) and kV (SR1), corresponding to drift fields of V/cm and V/cm, with position-dependent variations of 2.2 V/cm RMS based on a field map derived with the KEMField simulation package kemfield and cross-checked by a data-driven method. The LXe level is maintained at above the gate electrode, within sensor reading fluctuations of 2% RMS. The LXe temperature and GXe pressure were constant at ∘C and 1.94 bar, both with 0.02% RMS. For this analysis, 36 PMTs are ignored due to vacuum leaks or low single photo-electron (SPE) acceptance xe_instrument .
Several internal and external radioactive sources were deployed to calibrate the detector. 83mKr calibration data kr were collected every 2.5 weeks to monitor various detector parameters. Low-energy ERs are calibrated with 17.1 days of data taken with an internal 220Rn source xe_rn220 , split into seven periods spread throughout the science runs. NR calibration is performed with 30.0 days of exposure to an external 241AmBe source, roughly split between science runs, and 1.9 days of exposure to a D-D neutron generator xe1t_ng in SR1.
Each PMT channel is continuously digitized at a rate of 100 MHz. The PMT gains range from and signals above a minimum threshold of 2.06 mV are recorded as “hits” resulting in a mean SPE acceptance of 93% with a standard deviation of 3% across all active channels. A software trigger searches in time for clusters of hits compatible with S1 or S2 signals and saves the duration corresponding to the maximum drift time (700s) around them. This data is simultaneously backed up to tape and transferred to external grid sites where it is processed pearc_computing with the PAX reconstruction software package xe_instrument ; pax .
PMT signals are corrected for time-dependent gains. The gains are monitored weekly with a pulsed LED configured to produce signals of a few photoelectrons (PE) pmt_calibration and are stable within 1-2% throughout each science run, except in a small number of PMTs whose voltages were intentionally lowered due to diffusive leaks or which experienced dynode deterioration. S1 signals are corrected () for position-dependent light collection efficiency (LCE) due to geometric effects, measured in 83mKr calibration data and showing a maximum deviation of 80%. While drifting through LXe, electrons can be captured by electronegative impurities and thus the S2 size must be corrected for electron lifetime, which is measured with high time-granularity using -decays from 222Rn daughters during DM search data-taking as well as with 83mKr calibration data. The electron lifetime increased from s at the beginning of SR0 to a plateau of 650 s at the end of SR1 due to decreased outgassing over time and continuous GXe purification through hot getters. S2 signals are additionally corrected () for position-dependent LCE and inhomogeneous electroluminescence amplification, a maximum effect of 32% from the edge of the TPC to center. The bottom PMT array () is used for S2 energy reconstruction due to a more spatially homogeneous LCE.
Position reconstruction in the horizontal plane employs an artificial neural network trained with simulated S2 top-array PMT hit-patterns. This Monte Carlo (MC) simulation includes the full detector geometry, optical photon propagation, PMT quantum efficiencies, multiple-PE emission by one photon double_pe , and gains. Optical parameters are tuned to match the S1 LCE and the fraction of the S2 signal in the top-array in 83mKr data. Drift field distortion causes an inward shift of the reconstructed position and is corrected using 83mKr data to obtain the horizontal (X and Y, giving radius, R) and vertical (Z) interaction positions. The bottom of the TPC (Z cm) shows the largest radial bias of 7.7 cm (12.2 cm) at the beginning (end) of DM search data taking, with time-dependence mostly due to gradual charge accumulation on the PTFE surfaces, similar to the observation by lux_field . The resulting position distributions of both spatially homogeneous 222Rn-chain -decays and 131mXe decays, as well as localized NRs from external 241AmBe and neutron generator calibration data, agree well with MC and validate this correction procedure.
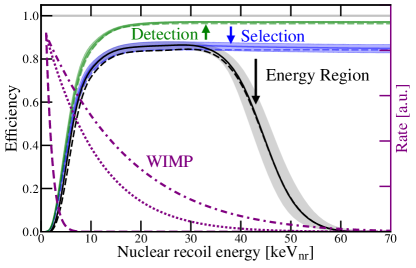
The DM search data was blinded (SR0 re-blinded after the publication of xe_sr0 ) in the signal region above the S2 threshold of 200 PE and below the ER quantile in (, ) space, prior to the tuning and development of event selection criteria and signal and background models. Data quality criteria are imposed to include only well-reconstructed events and to suppress known backgrounds. All events must contain a valid S1 and S2 pair. S1s are required to contain coincident signals from at least 3 PMTs within 100 ns. The energy region of interest (ROI) is defined by between 3 and 70 PE, corresponding to an average [1.4, 10.6] (ER energy) or [4.9, 40.9] (NR energy). Furthermore, in order to suppress low-energy accidental coincidence (AC) events, S1 candidates must not have shape properties compatible with S2 signals produced by single electrons. The resulting S1 detection efficiency, estimated by simulation, is shown in Fig. 1 and is smaller than that in xe_sr0 due to a wider S1 shape in the simulation tuned to 83mKr and 220Rn data as well as properly accounting for mis-classification as S2. This efficiency is consistent with that obtained by a data-driven method where small S1s are simulated via bootstrapping PMT hits from 20-100 PE S1s.
The signal ratio between the top and bottom PMT arrays is dependent on the depth at which the light is produced. For an S1 at a given interaction position, a p-value is computed based on the observed and expected top/bottom ratio and p-values are rejected. S2s are produced at the liquid-gas interface and thus must have a compatible fraction of light seen in the top array of 63%. To reject events coming from occasional light emission from malfunctioning PMTs, a threshold is placed on the maximum fractional contribution of a single PMT to an S1 signal.
The likelihoods of both the S1 and S2 observed hit-patterns compared to those expected from simulation, given the reconstructed position, are used to reject events that may be a result of multiple-scatters or AC. The low-, = 68 PE, event found in xe_sr0 did not pass event selection criteria in this analysis due to improvements to the MC simulation used for the S2 hit-pattern likelihood. To suppress events with poorly reconstructed hit-patterns that occur in regions with a high density of inactive PMT channels, the difference between the neural network and a likelihood-fit algorithm is required to be less than 2 to 5 cm, tighter towards larger S2 where fluctuations become negligible. As in xe_sr0 , the width of the S2 signal in time must be compatible with the depth of the interaction, and the multiplicity of S1 and S2 signals must be consistent with a single-scatter event. The efficiency of all selection conditions is shown in Fig. 1, estimated using a combination of simulations and calibration control samples.
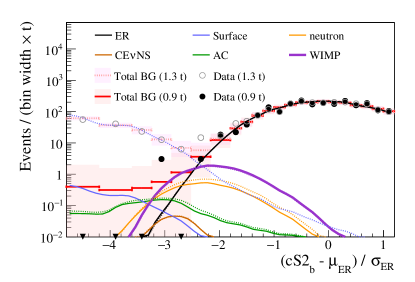
This analysis expands on that in xe_sr0 by modeling the radial distribution in the statistical inference procedure and categorizing events at inner radii based on Z, such that the analysis space is , , R, and Z. Each background component described below, and the WIMP NR signal, are modeled as a probability density function of all analysis dimensions. For WIMP NR energy spectra, the Helm form factor for the nuclear cross section lewin and a standard isothermal DM halo as in xe_sr0 are assumed, with , , , and Earth velocity of . These spectra are converted into the analysis space via the detector model described below. Figures 2 and 3 show the background and signal model shapes in various 2D projections of the analysis space compared to data. The 1D projection in Fig. 4 and integrals in Table 1 show the absolute rate comparisons. An NR signal reference region is defined between the 200 GeV/c2 WIMP median and quantile in (, ) space.
The natKr concentration in LXe is reduced via cryogenic distillation xe_kr to a sub-dominant level of , as determined from regular mass-spectrometry measurements xe_sebastian , and contributes an ER background rate of events/. The background contribution from the natural radioactivity of detector materials is suppressed within the fiducial volume to a similar level. Thus, the dominant ER background is from -decays of originating from emanation. The maximum and minimum decay rate of is and , estimated from -decays and time-coincident - decays, respectively, similarly to the method used in xe_rn . The corresponding event rates in the ROI are and events/. The total ER background rate is stable throughout both science runs and measured as events/ after correcting for efficiency, which is the lowest background achieved in a dark matter detector to date.
The NR background includes contributions from radiogenic neutrons originating from detector materials, coherent elastic neutrino nucleus scattering (CENS) mainly from 8B solar neutrinos, and cosmogenic neutrons from secondary particles produced by muon showers outside the TPC (negligible due to the muon veto xe_muonveto ). The CENS rate is constrained by 8B solar neutrino flux solarflux and cross-section coherent measurements. The rate of radiogenic neutrons is modeled with Geant4 MC geant4 ; xenon1t_mc_paper using the measured radioactivity of materials xe_screen , assuming a normalization uncertainty of 50% based on the uncertainty in the Sources 4A sources4a code and the difference between the Geant4 and MCNP particle propagation simulation codes mcnpx . Fast neutrons have a mean free path of 15 cm in LXe and produce 5 times more multiple-scatter than single-scatter events in the detector, allowing for background suppression. A dedicated search for multiple-scatter events finds 9 neutron candidates, consistent with the expectation of () derived from the Geant4 and detector response simulation described below, which is used to further constrain the expected single-scatter neutron event rate in DM search data.
The detector response to ERs and NRs is modeled similarly to the method described in Refs. xe_sr0 ; xe100_tritium . All 220Rn, 241AmBe, and neutron generator calibration data from both science runs are simultaneously fitted to account for correlations of model parameters across different sources and runs. To fit the 220Rn data, the parameterization of the ER recombination model is improved from xe_sr0 by modifying the Thomas-Imel model ti_model . These modifications include a power law field-dependence similar to NEST_v1 to account for the different drift fields in each science run, an exponential energy dependence to extend the applicability to high-energy (up to 20 ), and an empirical energy-dependent Fermi-Dirac suppression of the recombination at low-energy (). The resulting light and charge yields after fitting are consistent with measurements xe100_tritium ; lux_tritium ; pixey_ar37 ; lux_xe127 . The fit posterior is used to predict the ER and NR distributions in the analysis space of the DM search data, achieving an ER rejection of 99.7% in the signal reference region, as shown in Table 1. ER uncertainties in (, ) are propagated for statistical inference via variation of the recombination and its fluctuation, as these show the most dominant effect on sensitivity (here defined as the median of an ensemble of confidence intervals derived under the background-only hypothesis feldmancousins ; PDG ). For WIMP signals, the uncertainties from all modeled processes are propagated into an uncertainty of 15% (3%) on the total efficiency for 6 (200) GeV/c2 WIMPs.
| Mass | 1.3 t | 1.3 t | 0.9 t | 0.65 t |
|---|---|---|---|---|
| (, ) | Full | Reference | Reference | Reference |
| ER | 62718 | 1.620.30 | 1.120.21 | 0.600.13 |
| neutron | 1.430.66 | 0.770.35 | 0.410.19 | 0.140.07 |
| CENS | 0.050.01 | 0.030.01 | 0.02 | 0.01 |
| AC | 0.47 | 0.10 | 0.06 | 0.04 |
| Surface | 1068 | 4.840.40 | 0.02 | 0.01 |
| Total BG | 73520 | 7.360.61 | 1.620.28 | 0.800.14 |
| WIMP | 3.56 | 1.70 | 1.16 | 0.83 |
| Data | 739 | 14 | 2 | 2 |
Energy deposits in charge- or light-insensitive regions produce lone S1s or S2s, respectively, that may accidentally coincide and mimic a real interaction. The lone-S1 spectrum is derived from S1s occurring before the main S1 in high energy events and has a rate of [0.7, 1.1] Hz. The uncertainty range is determined from differing rates of single electron S2s and dark counts in the time window before the event. The lone-S2 sample is composed of all triggered low-energy events containing S2s without a validly paired S1 and has a rate of mHz (without requiring the S2 threshold). The AC background rate and distribution are estimated by randomly pairing lone-S1s and -S2s and simulating the necessary quantities for applying the event selection defined above.
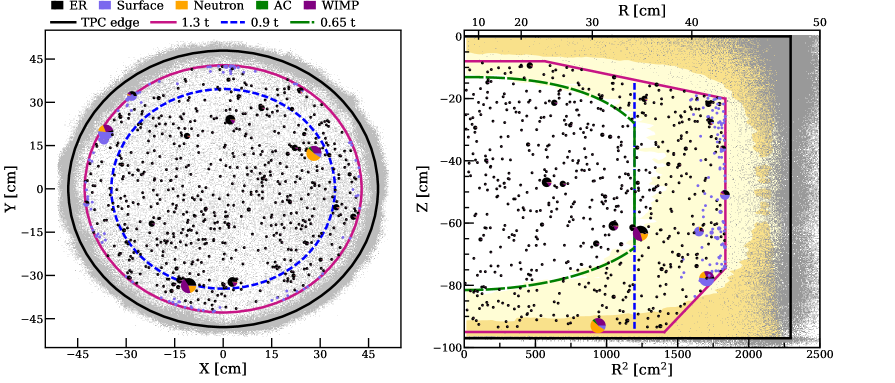
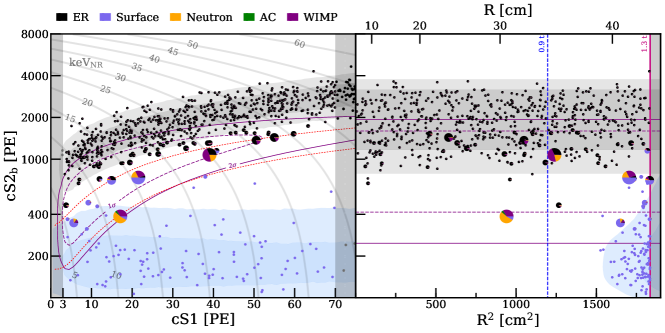
222Rn progeny plate-out on the inner surface of the PTFE panels may decay and contaminate the search region if the reconstructed position falls within the fiducial mass, herein referred to as “surface” background. Decays from and its daughters that occur directly on the surface of the PTFE exhibit charge-loss due to S2 electrons being trapped on the surface and produce an S2/S1 ratio compatible with NR, as shown in Fig. 3. Several control samples are selected to derive a data-driven surface background model: DM search data reconstructed outside the TPC radius (due to position resolution) are used to predict the distribution in (, , Z) via a kernel density estimator; the reconstructed R distribution of surface events depends only on the size of S2 and is modeled by fitting to a control sample composed of events as well as surface events with abnormally small S2/S1 from 220Rn calibration and DM search data ( 200 PE). The (R2, ) projection in Fig. 3 shows a correlation that provides additional discrimination power in the likelihood analysis. Uncertainties in the radial shape are estimated by varying fitting methods. The normalization of the surface background is constrained by the bulk of surface events in DM search data shown in Fig. 3.
The fiducial mass, shown as a magenta line in Fig. 2, is 8.0 cm below the liquid level to avoid mis-reconstructed interactions in the GXe and 2.9 cm above the cathode to avoid interactions in this region with a larger and less-uniform electric field. The corners of the fiducial mass are restricted further by requiring that the predicted total background rate in the ROI is flat to in Z across slices of R, such that the contribution from radioimpurities in detector materials to the ER background is sub-dominant relative to the uniform internal 214Pb contribution. The maximum radius (42.8 cm) was chosen to expect surface-like events from the background model, to avoid over-constraining the corresponding tail prediction with these bulk events (Fig. 3, right). This fiducial mass contains t of LXe, determined from the total target mass of t and the fraction of 83mKr events contained inside. An inner region containing 0.9 t mass with R cm is shown as a blue line in Fig. 2 and is used to illustrate a reference region with negligible surface background rate. Neutron interactions in the fiducial mass occur mainly at extreme Z near the gate electrode or cathode as shown in Fig. 2, while WIMP NRs are expected to be uniformly distributed. This prompted designation of a 0.65 t core mass, marked in green in Fig. 2, which contains a significantly lower neutron rate. Table 1 shows the number of events predicted in these regions by the post-fit models as well as the number of observed events after unblinding.
The data in the whole 1.3 t is interpreted using an unbinned extended likelihood with profiling over nuisance parameters James:1980ci ; Bartlett:1953 . Modeling the surface background and adding the R dimension allows for the expansion of the 1 t fiducial mass in xe_sr0 to 1.3 t, resulting in a 10% sensitivity gain. In addition to the three unbinned analysis dimensions (, , R), events are categorized as being inside or outside the core mass (dependent on (R, Z). All model uncertainties described above are included in the likelihood as nuisance parameters. A mis-modeling “safeguard” safeguard (WIMP-like component) is added to the ER model and constrained by the 220Rn calibration data. This term prevents over- or under-estimation of the ER model in the signal region due to modeling choices. The “anomalous leakage” background component used in xe_sr0 is not supported by the high statistics 220Rn calibration data in SR1 and is no longer included. SR0 and SR1 are simultaneously fitted by assuming only the following parameters are correlated: electron-ion recombination in ER, neutron rate, WIMP mass and . The best-fit in Fig. 4 and Table 1 refers to the set of parameters that maximizes the likelihood.
Confidence intervals () for (, mass) space were calculated by “profile construction” PDG ; feldmancousins using MC simulations and the coverage was tested for different values of nuisance parameters. This unifies one- and two-sided confidence interval constructions and avoids undercoverage that can result from applying asymptotic assumptions (Wilks’ theorem). This asymptotic assumption was applied in the analysis of xe_sr0 and caused a 38% (44%) decrease in the upper limit (median sensitivity) at a WIMP mass of 50 GeV/c2. A pre-unblinding decision was made to only report two-sided intervals if the detection significance exceeds , which leads the analysis to conservatively overcover signals below the 68% sensitivity band at 50 GeV/c2. Two independent inference codes were developed and used to cross-check the result.
Event reconstruction and selection criteria were fixed prior to unblinding. However, four aspects of the models and statistical inference were modified after unblinding PE, which together caused a 2% (4%) increase in the final limit (median sensitivity). First, the ER recombination parameterization, previously described, contains improvements implemented to solve a mis-modeling of the ER background in the NR ROI. The pre-unblinding parameterization included a sharp drop at 1.5 , which was sufficient for modeling the SR0 220Rn calibration data in xe_sr0 but caused an enhancement to the safeguard term in a post-unblinding fit of the larger statistics SR1 220Rn and DM search data. The event at low-Z and low-, indicated as mostly neutron-like in Figs. 2 and 3, motivated scrutiny of the neutron model. The second modification improved this model to correctly describe events with enlarged S1s due to additional scatters in the charge-insensitive region below the cathode. These events comprise 13% of the total neutron rate in Table 1. Third, we implemented the core mass segmentation to better reflect our knowledge of the neutron background’s Z distribution, motivated again by the neutron-like event. This shifts the probability of a neutron (50 GeV/c2 WIMP) interpretation for this event in the best-fit model from 35% (49%) to 75% (7%) and improves the limit (median sensitivity) by 13% (4%). Fourth, the estimated signal efficiency decreased relative to the pre-unblinding model due to further matching of the simulated S1 waveform shape to 220Rn data, smaller uncertainties from improved understanding and treatment of detector systematics, and correction of an error in the S1 detection efficiency nuisance parameter. This latter set of improvements was not influenced by unblinded DM search data.
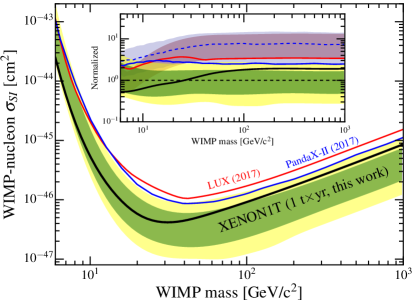
In addition to blinding, the data were also “salted” by injecting an undisclosed number and class of events in order to protect against fine-tuning of models or selection conditions in the post-unblinding phase. After the post-unblinding modifications described above, the number of injected salt and their properties were revealed to be two randomly selected 241AmBe events, which had not motivated any post-unblinding scrutiny. The number of events in the NR reference region in Table 1 is consistent with background expectations. The profile likelihood analysis indicates no significant excesses in the 1.3 t fiducial mass at any WIMP mass. A p-value calculation based on the likelihood ratio of the best-fit including signal to that of background-only gives , 0.41, and 0.22 at 6, 50, and 200 GeV/c2 WIMP masses, respectively. Figure 5 shows the resulting 90% confidence level upper limit on , which falls within the predicted sensitivity range across all masses. The sensitivity band spans an order of magnitude, indicating the large random variation in upper limits due to statistical fluctuations of the background (common to all rare-event searches). The sensitivity itself is unaffected by such fluctuations, and is thus the appropriate measure of the capabilities of an experiment exo_nature . The inset in Fig. 5 shows that the median sensitivity of this search is 7.0 times better than previous experiments lux_dm ; panda_dm at WIMP masses GeV/c2.
Table 1 shows an excess in the data compared to the total background expectation in the reference region of the 1.3 t fiducial mass. The background-only local p-value (based on Poisson statistics including a Gaussian uncertainty) is 0.03, which is not significant enough, including also an unknown trial factor, to trigger changes in the background model, fiducial boundary, or consideration of alternate signal models. This choice is conservative as it results in a weaker limit.
In summary, we performed a DM search using an exposure of 278.8 days 1.3 t 1.0 tyr, with an ER background rate of events/, the lowest ever achieved in a DM search experiment. We found no significant excess above background and set an upper limit on the WIMP-nucleon spin-independent elastic scattering cross-section at cm2 for a mass of 30 GeV/c2, the most stringent limit to date for WIMP masses above 6 GeV/c2. An imminent detector upgrade, XENONnT, will increase the target mass to 5.9 t. The sensitivity will improve upon this result by more than an order of magnitude.
We gratefully acknowledge support from the National Science Foundation, Swiss National Science Foundation, German Ministry for Education and Research, Max Planck Gesellschaft, Deutsche Forschungsgemeinschaft, Netherlands Organisation for Scientific Research (NWO), Netherlands eScience Center (NLeSC) with the support of the SURF Cooperative, Weizmann Institute of Science, Israeli Centers Of Research Excellence (I-CORE), Pazy-Vatat, Initial Training Network Invisibles (Marie Curie Actions, PITNGA-2011-289442), Fundacao para a Ciencia e a Tecnologia, Region des Pays de la Loire, Knut and Alice Wallenberg Foundation, Kavli Foundation, and Istituto Nazionale di Fisica Nucleare. Data processing is performed using infrastructures from the Open Science Grid and European Grid Initiative. We are grateful to Laboratori Nazionali del Gran Sasso for hosting and supporting the XENON project.
References
- (1) G. Bertone, D. Hooper and J. Silk, Phys. Rep. 405, 279 (2005).
- (2) L. Roszkowski et al. Rep. Prog. Phys. 81, 066201 (2018).
- (3) T. Marrodán Undagoitia and L. Rauch, J. Phys. G 43, no. 1, 013001 (2016)
- (4) L. E. Strigari, Phys. Rep. 531, 1 (2013).
- (5) E. Aprile et al. (XENON Collaboration), Phys. Rev. Lett. 119, 181301 (2017).
- (6) D. S. Akerib et al. (LUX Collaboration), Phys. Rev. Lett. 118, 021303 (2017).
- (7) X. Cui et al. (PandaX-II Collaboration), Phys. Rev. Lett. 119, 181302 (2017).
- (8) E. Aprile et al. (XENON Collaboration), Eur. Phys. J. C 77: 881 (2017).
- (9) E. Aprile et al. (XENON Collaboration), Eur. Phys. J. C 75: 546 (2015).
- (10) P. Barrow et al. JINST 12, no. 01, P01024 (2017).
- (11) E. Aprile et al. (XENON Collaboration), JINST 9, P11006 (2014).
- (12) P. Sorensen, K. Kamdin. JINST 13, P02032 (2018).
- (13) D. Furse et al.. New J. Phys. 19 053012 (2017)
- (14) L. W. Kastens, S. B. Cahn, A. Manzur, and D. N. McKinsey, Phys. Rev. C 80, 045809 (2009).
- (15) E. Aprile et al. (XENON Collaboration), Phys. Rev. D 95, 072008 (2017).
- (16) R. F. Lang et al., Nucl. Inst. and Meth. A 879, 31 (2018).
- (17) B. Riedel et al. PEARC ’18, ISBN 978-1-4503-6446-1 (2018). doi:10.1145/3219104.3219155.
- (18) XENON Collaboration. (2018). The pax data processor v6.8.0. Zenodo. http://doi.org/10.5281/zenodo.1195785
- (19) R. Saldanha et al., Nucl. Inst. and Meth. A 863, 35 (2017).
- (20) C. H. Faham et al., JINST 10, P09010 (2015).
- (21) D. S. Akerib et al. (LUX Collaboration), JINST 12, P11022 (2017).
- (22) J. Lewin and P. Smith, Astropart. Phys. 6 87 (1996).
- (23) E. Aprile et al. (XENON Collaboration), Eur. Phys. J. C 77: 275 (2017).
- (24) S. Lindemann, H. Simgen, Eur. Phys. J. C 74, 2746 (2014).
- (25) E. Aprile et al. (XENON Collaboration), Eur. Phys. J. C 78 :132 (2018).
- (26) A. M. Serenelli et al., Astro. Phys. Journal 743, 24 (2011).
- (27) D. Akimov et al. (COHERENT Collaboration), Science 357, 1123-1126 (2017).
- (28) S. Agostinelli et al., Nucl. Inst. and Meth. A 506, 250 (2003).
- (29) E. Aprile et al. (XENON Collaboration), J. Cosmol. Astropart. Phys. 1604, no. 04, 027 (2016)
- (30) E. Aprile et al. (XENON Collaboration), Eur. Phys. J. C 77: 890 (2017).
- (31) W.B. Wilson et al., LANL technical note LA-13639-MS (1999).
- (32) R. Lemrani et al., Nucl. Inst. and Meth. A 560, 454 (2006).
- (33) E. Aprile et al. (XENON Collaboration), Phys. Rev. D 97, 092007 (2018).
- (34) J. Thomas, and D. A. Imel, Phys. Rev. A 36, 614 (1987).
- (35) B. Lenardo et al. IEEE Trans. Nucl. Sci. 62, 3387 (2015).
- (36) D. S. Akerib et al. (LUX Collaboration), Phys. Rev. D 93, 072009 (2016).
- (37) E. M. Boulton et al., JINST 12, P08004 (2017).
- (38) D. S. Akerib et al. (LUX Collaboration), Phys. Rev. D 96, 112011 (2017).
- (39) G. J. Feldman and R. D. Cousins, Phys. Rev. D 57, 3873 (1998).
- (40) C. Patrignani et al. (Particle Data Group), Chin. Phys. C 40, 100001 (2016).
- (41) F. James, Comput. Phys. Commun. 20, 29 (1980).
- (42) M. S. Bartlett, Biometrika 40 12 (1953).
- (43) N. Priel, L. Rauch, H. Landsman, A. Manfredini, and R. Budnik, J. Cosmol. Astropart. Phys. 5 13 (2017).
- (44) J. B. Albert et al. (EXO-200 Collaboration), Nature 510, 229 (2014).