Star-formation rates of cluster galaxies: nature nurture
Abstract
We analyzed 17 galaxy clusters, and investigated, for the first time, the dependence of the SFR and sSFR as a function of projected distance (as a proxy for environment) and stellar mass for cluster galaxies in an intermediate-to-high redshift range (). We used up to nine flux points (BVRIZYJHKs magnitudes), its errors and redshifts to compute Mstar, SFR and sSFR through spectral energy distribution fitting technique. We use a z-dependent sSFR value to distinguish star-forming (SF) from quiescent galaxies. To analyse the SFR and sSFR history we split our sample in two redshift bins: galaxies at and . We separate the effects of environment and stellar mass on galaxies by comparing the properties of star-forming and quiescent galaxies at fixed environment (projected radius) and fixed stellar mass. For the selected spectroscopic sample of more than 500 galaxies, the well-known correlation between SFR and is already in place at , for both SF and quenched galaxies. Our results are consistent with no evidence that SFR (or sSFR) depends on environment, suggesting that for cluster galaxies at an intermediate-to-high redshift range, mass is the primary characteristic that drives SFR.
keywords:
star-formation rate – specific star formation rate – high redshift galaxy clusters1 Introduction
Galaxies are the building blocks of our Universe and to understand their evolution through the history of the Universe is of fundamental importance. The hierarchical Lambda Cold Dark Matter (CDM) model predicts that galaxies are formed through the gravitational collapse of baryons (mostly in the form of gas) inside dark matter haloes.
Interestingly, many of the galaxy properties, such as star formation rates (SFRs), morphology and colour show environmental and redshift dependence as well. Thus, from an observational point of view, measuring these properties at different epochs and environments will give us important clues on the evolution of galaxies.
In 1980, Butcher & Oemler (1984) made a pioneering study in clusters of galaxies showing that the blue fraction of galaxies increased from to . Dressler et al. (1999) showed the effect needed refinement by defining EA galaxies as ‘blue’. More recently, however, a different approach has been used to define galaxy evolution by measuring the star formation rate (SFR) or specific star formation rate (i.e., star formation per unit mass, ).
An important fact is that galaxies in the local universe have lower levels of star-formation (SF) activity than the ones in the past. The global star formation history shows a peak at and then drops towards (Lilly et al., 1996; Madau et al., 1996; Karim et al., 2011; Sobral et al., 2013; Khostovan et al., 2015). Also the SFRs of normal star-forming (SF) galaxies at are significantly lower than the SFRs of higher redshift SF galaxies with similar mass (Daddi et al., 2007; Sobral et al., 2014). Therefore we need to understand the physical mechanism(s) that can lower and eventually stop the SF activity of galaxies to explain this change on average SF properties of galaxies from high redshift to the local universe.
Both internal and environmental factors seem to affect SF activity of galaxies (Peng et al., 2010; Sobral et al., 2011; Muzzin et al., 2012; Darvish et al., 2015, 2016). The depletion of the gas reservoir, and the decline in the galaxy merger rate have been considered as possible alternatives to explain the reduction in SF activity since (Le Fèvre et al., 2000; Hammer et al., 2005; Noeske et al., 2007a). But also, since detailed observations of dense environments such as galaxy groups and clusters in the local universe have shown that galaxies that reside in these environments have properties very different from galaxies in low density or field galalaxies, many environmental effects may be linked to the decrease in the global SF. Processes such as ram-pressure stripping or galaxy harassment, which are dominant in regions of higher density (e.g., Gunn & Gott, 1972; Moore et al., 1996; Hester, 2006) can remove gas from infalling galaxies as they merge into groups and clusters of galaxies, leading to a decrease in SF via starvation. Heating of intracluster gas due to cluster mergers (McCarthy et al., 2007) or viral shock heating of infalling gas in massive dark matter haloes could also be responsible for the exhaustion of the cold gas supply of galaxies that are in high-density environments. Zabludoff & Mulchaey (1998) have proposed that these particular properties of cluster and group galaxies may be due to ‘pre-processing’ before the accretion into the dense environment (but see Berrier et al., 2009, who claimed that ‘pre-processing’ is not a large effect). This is supported by observations of reduced star formation rates of galaxies that reside beyond the viral radius (Balogh et al., 1999; Lewis et al., 2002).
From the observational point of view, for field galaxies, there seems to be a consensus in that there exists a dependence of the SFR on the stellar mass, with more massive galaxies having higher SFRs (e.g., Lara-López et al., 2010; Peng et al., 2010). A different result was reported by Noeske et al. (2007a) who analysed field galaxies and showed that in the SFR- relation there are two distinct populations: a main sequence of SF galaxies in which SFR depends on , and “quenched” galaxies with no detectable SF activity, forming almost an horizontal line in this diagram.
If most of the results agrees for the SFR dependence on , there has been a major divergence on the environmental dependence of SF activity of galaxies. While several investigations (Gómez et al., 2003; Balogh et al., 2004; Kauffmann et al., 2004) find the mean SFR of galaxies in dense environment to be much less than those of galaxies in lower density regions, some authors reported that an inversion of the local relation is seen at high redshifts ( Cooper et al., 2008; Elbaz et al., 2007), such that field galaxies in high-density environments have enhanced SFRs. Part of this discrepancy may be connected with a possible mass dependence: if mass-downsizing is already in place at higher redshifts (Popesso et al., 2011; Sobral et al., 2011; Scodeggio et al., 2009), and massive galaxies are preferentially located in high-density regions, samples with different luminosity limits or that have different selection may find contradictory results.
Extending the field work to clusters of galaxies at higher redshifts than has required assembling significant amount of data of relatively faint galaxies. Therefore only in the past few years have such data sets become available. For cluster galaxies, the dependence of the SFR on seems to still persist but the SFR-density for a single cluster was found to be very weak (e.g., Pintos-Castro et al., 2013; Laganá et al., 2016). Although to determine if these results, for a relatively young cluster, is representative of high-redshift systems, more investigation is needed.
Thus, we have taken advantage of the existence of one such data set of 17 rich clusters of galaxies (Guennou et al., 2010; Martinet et al., 2015) to carry out the study of the SF history in cluster galaxies. Our aim is to determine the form of sSFR/SFR- and sSFR/SFR-density relation for the first sample of intermediate-to-high redshift of cluster galaxies and compare it to the results discussed above. Since our sample covers a wide range in redshift we could separate them into two redshift bins: and to analyse a possible evolution of these relations.
2 The data sample and analysis
We selected 17 galaxy clusters from DAFT/FADA survey (Guennou et al., 2010; Martinet et al., 2015), presented in Tab. 1 in the intermediate-to-high-redshift (). DAFT/FADA is based on a sample of 91 high redshift (), massive () clusters with existing HST imaging, for which complementary multi-wavelength imaging were performed.
We selected only galaxies spectroscopically confirmed as cluster members. The average galaxy 90% completeness limit of our sample in the I-band is 23.2, (see Martinet et al., 2015, for more information), and we used the method presented in Laganá et al. (2013) and described in Appendix A for the adopted stellar mass limit we relied on. We thus considered only galaxies with
| Cluster | R.A. | DEC | z | scale | |||||
|---|---|---|---|---|---|---|---|---|---|
| kpc/arcsec | () | () | () | () | |||||
| CL 00161609 | 00 18 33.3 | 16 26 35.8 | 0.546 | 6.411 | 64 | - | 3.929 | 6.067 | |
| CL J0152.71357 | 01 52 41.0 | -13 57 45.0 | 0.831 | 7.603 | 67 | 1.77 0.40 | - | 2.577 | 3.683 |
| ABELL 0851 | 09 42 56.6 | 46 59 21.9 | 0.407 | 5.430 | 144 | 5.5 1.2G14 | - | 6.100 | 9.000 |
| LCDCS 0130 | 10 40 41.6 | -11 55 51.0 | 0.704 | 7.146 | 15 | - | - | 0.405 | 0.640 |
| LCDCS 0173 | 10 54 43.5 | -12 45 50.0 | 0.750 | 7.338 | 14 | - | - | 2.937 | 4.643 |
| MS 1054-03 | 10 57 00.2 | -03 37 27.4 | 0.823 | 7.580 | 55 | - | 3.39 | 6.941 | 11.100 |
| RXC J1206.2-0848 | 12 06 12.0 | -08 48 00.0 | 0.440 | 5.533 | 28 | - | 8.40 | 11.200 | 16.100 |
| LCDCS 0504 | 12 16 45.1 | -12 01 17.0 | 0.794 | 7.476 | 6 | - | - | 5.835 | 9.226 |
| BMW-HRI J122657.3333253 | 12 26 58.0 | 33 32 54.1 | 0.890 | 7.765 | 13 | 12.1 0.4G14 | - | - | - |
| LCDCS 0531 | 12 27 53.9 | -11 38 20.0 | 0.636 | 6.861 | 27 | - | - | 0.310 | 0.491 |
| HDF:ClG J12366215 | 12 37 60.0 | 62 15 54.0 | 0.850 | 7.658 | 15 | - | - | 1.662 | 2.628 |
| LCDCS 0829 | 13 47 32.0 | -11 45 42.0 | 0.451 | 6.411 | 21 | 16.9 3.6G14 | - | 13.557 | 13.886 |
| LCDCS 0853 | 13 54 09.5 | -12 30 59.0 | 0.763 | 7.373 | 9 | - | - | - | - |
| 3C 295 CLUSTER | 14 11 20.2 | 52 12 09.0 | 0.460 | 5.831 | 60 | - | - | 7.200 | 10.527 |
| MACS J1423.82404 | 14 23 48.3 | 24 04 47.0 | 0.545 | 6.382 | 8 | 4.30 0.72 | 4.98 | 5.826 | 8.107 |
| MACS J1621.43810 | 16 21 24.0 | 38 10 02.0 | 0.465 | 5.831 | 15 | 4.28 0.35 | 4.81 | 7.044 | 10.181 |
| MACS J2129.40741 | 21 29 26.0 | -07 41 27.0 | 0.589 | 6.628 | 5 | 6.06 0.80 | 7.66 | 13.486 | 19.490 |
| total number of galaxies | 536 |
For the selected clusters, we used a data set with up to nine flux points (BVRIZYJH magnitudes), its errors and the redshift to compute stellar population synthesis models. We stress that we use more than one near infrared band (at least Z and J or Ks) to constrain the IR regime. We did not use far infra-red (FIR) because Spitzer data are unavailable for the entire sample. Another problem with the Spitzer data ’ is the small angular extent of our clusters, for which typical galaxy-galaxy separations are often smaller than the IRAC spatial resolution, leading to considerable confusion in the central parts of clusters (see Appendix B for discussion).
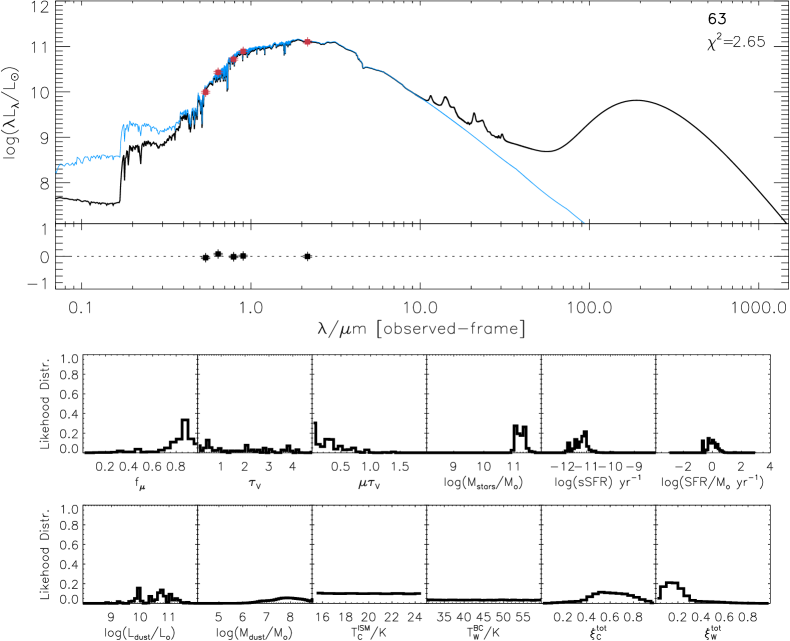
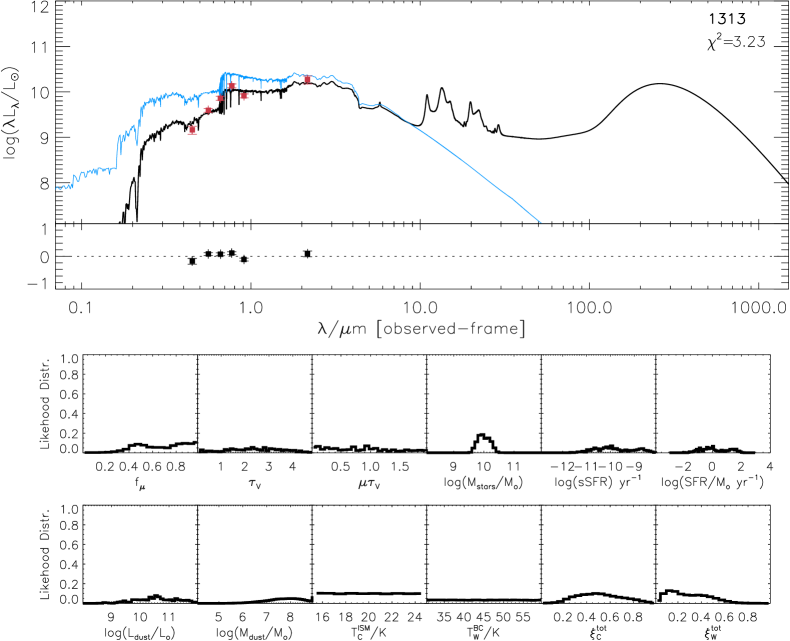
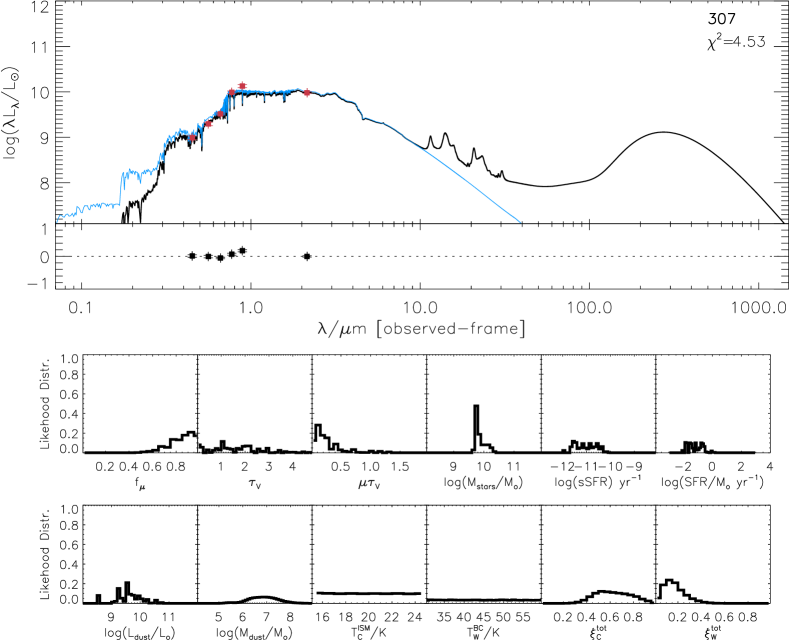
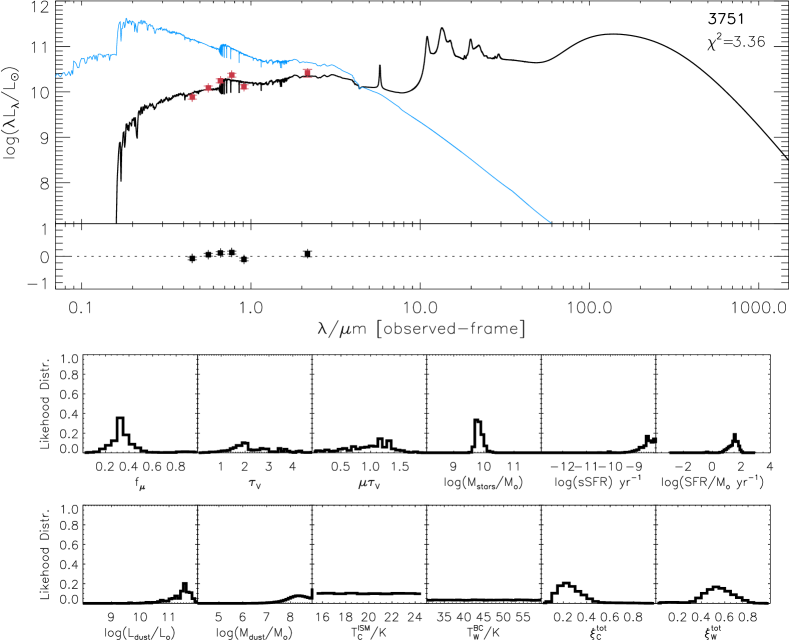
, SFR and the sSFR were obtained using spectral energy distribution fitting technique performed by MAGPHYS (da Cunha et al., 2008). It is based on the stellar population synthesis models of Bruzual & Charlot (2003), with a Chabrier (2003) stellar initial mass function and a metallicity value in the range 0.02-2 . We set all member galaxies to the mean cluster redshift and for each galaxy model MAGPHYS produces both the dust free (unattenuated) and attenuated spectrum. The attenuated spectra is obtained using the dust model of Charlot & Fall (2000).
For each galaxy the observed flux points are compared to model flux points, and the goodness of the fit () determines the probability weight for the given model, and thus of the associated model parameters in the final probability distribution of each parameter. We adopted the best-fit value as our fiducial estimate of a given parameter, with lower and upper limits provided by 16% and 84% percentiles. Using these limits we find that a typical 1 error is about 10% and we used this value as representative of our errors. In Appendix B, we show SED fits for high and low redshift galaxies considered as star-forming and quenched.
To analyse our correlations, we applied a robust (that is an outlier-resistant) bootstrap linear fit to data with 10,000 resampling to compute the bisector of the Y X and X Y regression and a Pearson correlation coefficient. The presented linear fits in all figures are the mean linear fit of the 10,000 fits performed.
3 Results
To study if the global trends observed locally were in place at , we show the SFR/sSFR against projected radial distance and against stellar mass. But first, we are interested in separating star-forming (SF) from non-star forming (quiescent) galaxies.
Since morphological type is related with star-formation, colour index has been commonly used as an early and late type morphological segregator (Faber et al., 2007; Lee et al., 2007) that would correspond to distinguish quiescent from star-forming galaxies.
However, there are some caveats related to this method. First, depending on the selected bands, there might be up to 30% of misclassification (e.g. using u-r as reported in Strateva et al., 2001). Also Wolf et al. (2005) have described a population of ‘dusty red galaxies’ dominating the outskirts of the cluster A901/A902. Their sample has red colours due to dust and intermediate age rather than old age as for regular early types. As reported by Lee et al. (2015), at the redshift range of the galaxies in this work, there might be a non-negligible red fraction that are still forming stars and would be misclassified according to a colour selection. These red SF galaxies are, on average, dustier, and are migrating into the red quiescent population. However, according to these authors, no red SF galaxy has a sSFR .
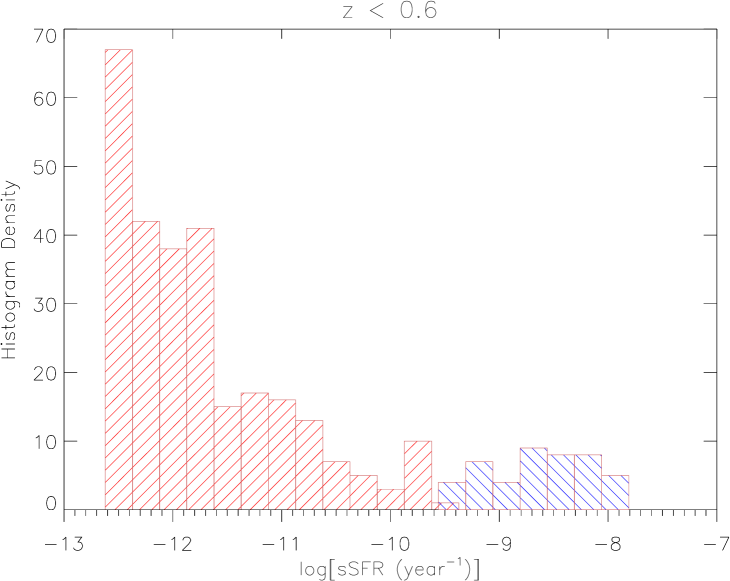
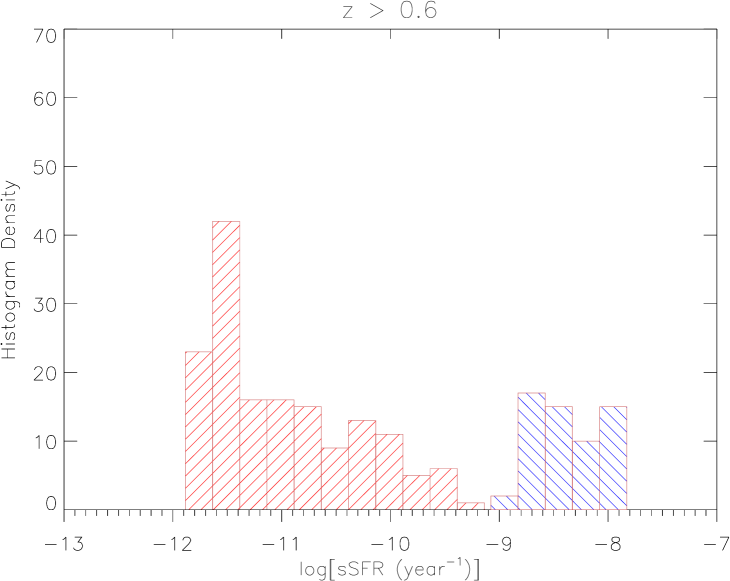
Having said that, our approach to separate SF from quiescent galaxies is to use the sSFR. The sSFR describes the fractional rate of stellar mass growth in a galaxy due to ongoing star formation. The sSFR has units of inverse time and galaxies with low sSFRs are said to have long star-formation time-scales. Since the sSFRs of galaxies rises significantly from to , and is best described by a power law (Yoshida et al., 2006; Karim et al., 2011; Sobral et al., 2013; Koyama et al., 2013). We adopted a z-dependent sSFR to separate actively SF galaxies from quenched galaxies, such that (Koyama et al., 2013). SF galaxies are galaxies with , while would correspond to quiescent (or transitional) galaxies.
The adoption of this sSFR(z) cut is reasonable if we look to the histogram distribution of sSFR for the two redshift bins (Fig.1). For we see that there are already two peaks in the distribution (that correspond to quiescent and SF galaxies) and they becomes even more evident for the higher redshift bin (). Applying the K-S test, it shows that the probability that the sSFR for quiescent and SF galaxies are draw from different population is about 98% for both redshift bins. The quiescent population represents 72% of the sample at increasing to 86% for galaxies at , giving additional support to the fact that galaxies at higher redshifts have on average higher SFRs.
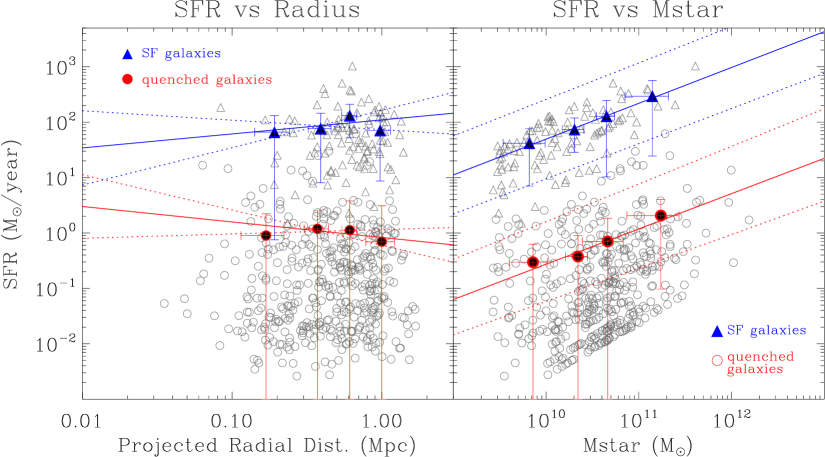
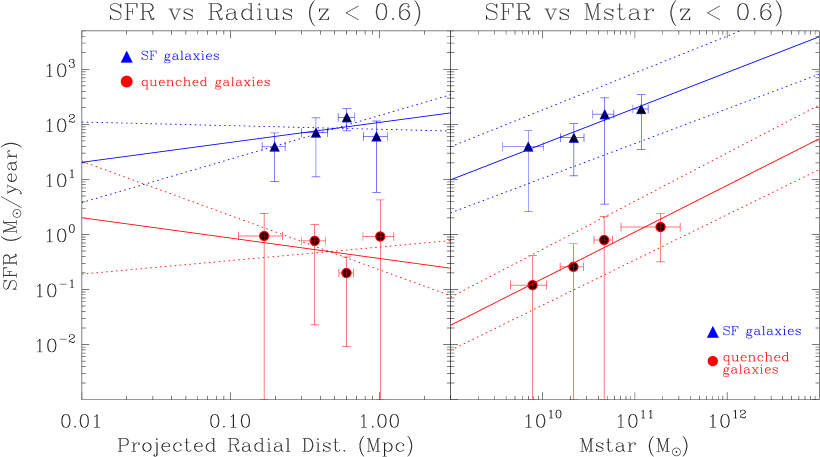
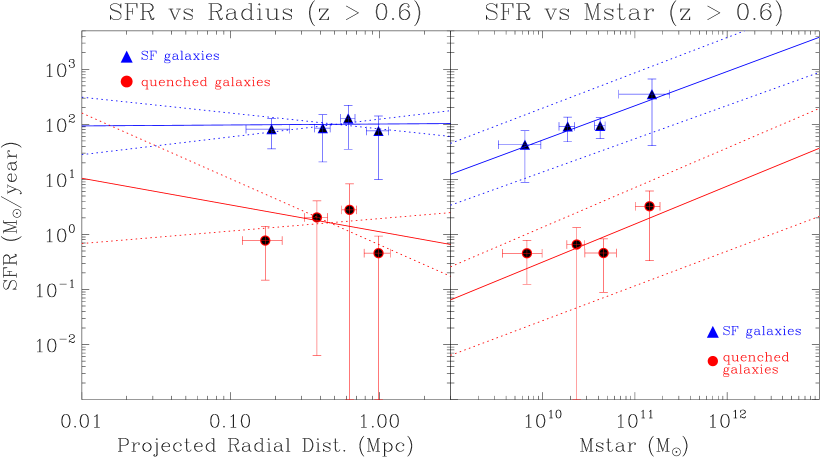
To analyse SFR/sSFR against projected radial distance (left panels) and against stellar mass (right panels), we adopted four bins of radial distance and stellar mass and we present the mean and standard deviation for each bin. In this way, we avoid that the trend is dominated by a specific region of the parameter space. The blue triangles represent SF galaxies and red circles quenched galaxies. This colour scheme will be used for all figures unless stated otherwise.
In Fig. 2 we show SFR density (left panel) and SFR (right panel). From this figure we do not find any significant SFR-density correlation, suggesting that SF activity in the range does not significantly change within cluster environment. Looking to the SFR- relation, both populations show a strong correlation of the SFR on the stellar mass in the sense that more massive galaxies have higher star formation rates (with a Pearson correlation coefficient of 0.99 for the quiescent galaxies and 0.97 for the star-forming galaxies).
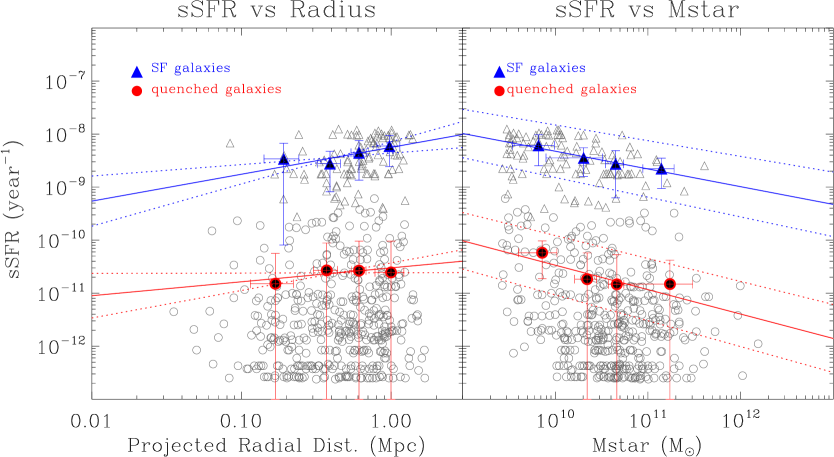
In Fig. 3 we present the sSFR against projected radial distance (left panel) and against stellar mass (right panel). Our results show that the average sSFR may not follow an increasing trend with radius as suggested by Brodwin et al. (e.g., 2013), indicating that SF activity does not significantly change within cluster environment. We did not find any significant SFR-density or sSFR-density correlations (we could not reject the null hypothesis that there is no correlation between these two variables), but we confirmed previous results in which low-mass galaxies have higher sSFR than higher-mass galaxies (Feulner et al., 2005; Pérez-González et al., 2005; Zheng et al., 2007; Noeske et al., 2007b). The Pearson correlation coefficient for sSFR- relation is -0.97 and -0.83 for the SF and quiescent galaxy population, respectively.
Since the correlations between SFR/sSFR and are strong for both SF and quiescent galaxies, this may point to the fact that their properties are primarily determined by their stellar mass, and not by the environment they reside (as suggested by Muzzin et al., 2012; Sobral et al., 2011).
4 Discussion
To better analyze the SFR and sSFR dependence on both and on environment through time, we divided our sample into two bins of redshift: an intermediate-redshift bin (cluster galaxies at ) and a high-redshift bin (cluster galaxies at ). The redshift of was chosen as the redshift that divided our sample into two sub-samples with approximately the same number of galaxies.
In Fig. 4 we show the SFR against projected radius (left panels) and against stellar mass (right panels) for cluster galaxies at (upper panels) and cluster galaxies at (lower panels). Taking into account the 1- errors, there is no clear correlation between SFR and projected radius. Thus, our results show that within the cluster environment, SFR and density does not correlate (in any of the redshift bins analysed), and it may be that the effects of environment on the galaxy population at higher redshifts are relatively minor in all environments except for the richest galaxy clusters, something that has been suggested by Sobral et al. (2011) and Muzzin et al. (2012).
Also from Fig. 4, our results show a strong dependence of the SFR on the stellar mass similar to what is found for field galaxies up to redshift 1 (Lara-López et al., 2010; Peng et al., 2010). The mass dependence of the SFR for SF galaxies is not surprising as many studies have stablished a tight correlation between SFR and , that is, the main sequence of SF galaxies (Brinchmann et al., 2004; Daddi et al., 2007; Karim et al., 2011; Sobral et al., 2014). However, Noeske et al. (2007a) found that the dependence of the SFR on can be seen for the galaxies with reliable signs of star formation (main sequence of SF galaxies), while galaxies with no evident signs of SF form an horizontal sequence on the diagram. In stark contrast, our results reveal that the quiescent population also shows a dependence of the SFR on .
In Fig. 5 we show the sSFR against projected radius (left panels) and against stellar mass (right panels) for cluster galaxies at (upper panels) and cluster galaxies at (lower panels).
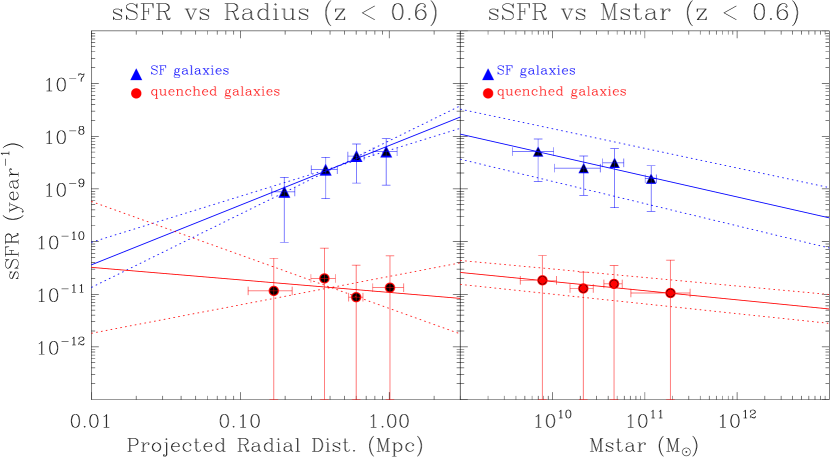
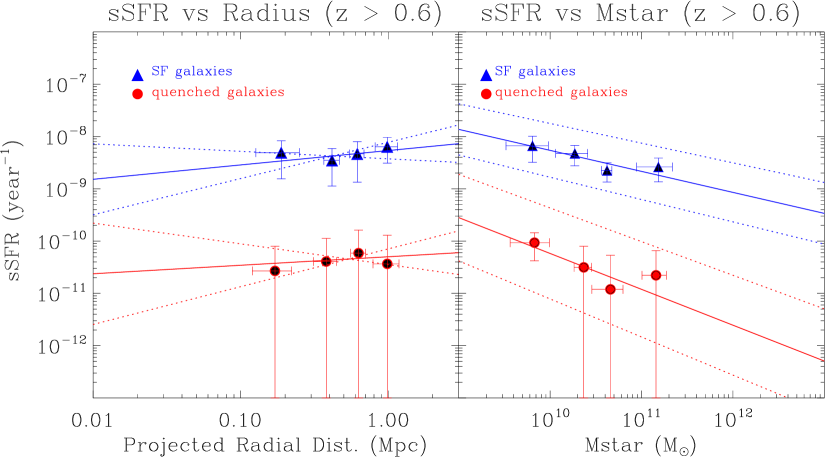
Except for the SF galaxies at , there is no correlation between sSFR and projected radius. Recent works have obtained that, at least for SF galaxies, there is no significant SFR-density or sSFR-density correlation (McGee et al., 2011; Peng et al., 2010; Tadaki et al., 2012; Muzzin et al., 2012). The results drawn from our current work are consistent with those previous findings not only for the SF population but also for quenched galaxies. We caution that the flat SFR/sSFR-density is valid within cluster environment and may not hold for higher redshifts. Also, it is worth mentioning that our results represent mean values for SFR/sSFR averaged over galaxies of different clusters possibly with different dynamical states.
The sSFR-density correlation found for the SF galaxies at , might be due to merging effects. This effect is because the merging is predicted to be a gradual rather than one time catastrophic event, and hydrodynamical simulations show that this gradual build up began as early (e.g., Mundy et al., 2017; Martin et al., 2017; Feldmann et al., 2017) but why or how the effects are most noticeable below requires further work that is beyond the scope of this paper.
Also form Fig. 5 we see an anti-correlation between the sSFR and , independent of the redshift bin analysed, showing that lows-mass galaxies have higher sSFR than higher-mass galaxies. These results show not only that more massive galaxies are forming less stars per unit of mass, but it supports a scenario in which massive galaxies formed most of their stars earlier and on shorter timescales, while less-massive galaxies evolve on longer timescales (“downsizing”, Popesso et al., 2011; Sobral et al., 2011; Scodeggio et al., 2009).
5 Summary and Conclusions
We analysed 17 galaxy clusters, and investigated, for the first time, the dependence of the SFR and sSFR as a function of projected distance (as ameasure of the galaxy density environment) and stellar mass for cluster galaxies in an intermediate-to-high redshift range (). We used up to nine flux points (BVRIZYJH magnitudes), its errors and redshifts to compute , SFR and sSFR through spectral energy distribution fitting technique. To separate our galaxies in SF and quiescent population we adopted a specific star-formation rate as a function of redshift, , and classified as actively SF galaxies the ones with sSFR above this threshold, while the ones with lower values belong to the quiescent population.
To analyse the SFR and sSFR history we split our sample in two redshift bins: galaxies at and . We separate the effects of environment and stellar mass on galaxies by comparing the properties of star-forming and quiescent galaxies at fixed environment (projected radius) and fixed stellar mass.
An observational challenge here was to test if the “universality” of the main sequence holds at an intermediate-to-high redshift range, where global star-formation activity is higher. We confirmed the existence of a universal galaxy main sequence in clusters. Plus, we also showed that for both, SF and quiescent population, SFR correlates with stellar mass. We also found an anti-correlation between the sSFR and , independent of the redshift bin analysed, showing that lows-mass galaxies have higher sSFR than higher-mass galaxies. These results show not only that more massive galaxies in clusters are forming less stars per unit of mass, but our results support a scenario in which massive galaxies formed most of their stars earlier and on shorter timescales, while less-massive galaxies evolve on longer timescales (“downsizing”).
From our results, we did not find any significant SFR-density or sSFR-density correlations (we could not reject the null hypothesis that there is no correlation between these two variables), suggesting that SF activity does not significantly change within cluster environment, making it evident that mass is the parameter that drives SFR (in line with previous finding of Muzzin et al., 2012; Koyama et al., 2013; Darvish et al., 2015, 2016).
Acknowledgements
We would like to thank the anonymous referee for valuable and constructive comments that improved the quality of this work. The authors also thank F. Durret and N. Martinet for making available the cluster galaxies data in an appropriate table, E. da Cunha for clarifying MAGPHYS applications and, L. Martins and P. Coelho for fruitful discussions. T. F. L acknowledges FAPES and CNPq for financial support (grants: 2012/00578-0 and 303278/2015-3, respectively), and thanks Northwestern University Center for Interdisciplinary Exploration and Research in Astrophysics (CIERA) for hosting while we carried out part of this research.
References
- Balogh et al. (1999) Balogh M. L., Morris S. L., Yee H. K. C., Carlberg R. G., Ellingson E., 1999, ApJ, 527, 54
- Balogh et al. (2004) Balogh M. L., Baldry I. K., Nichol R., Miller C., Bower R., Glazebrook K., 2004, ApJ, 615, L101
- Berrier et al. (2009) Berrier J. C., Stewart K. R., Bullock J. S., Purcell C. W., Barton E. J., Wechsler R. H., 2009, ApJ, 690, 1292
- Bolzonella et al. (2010) Bolzonella M., et al., 2010, A&A, 524, A76
- Brinchmann et al. (2004) Brinchmann J., Charlot S., White S. D. M., Tremonti C., Kauffmann G., Heckman T., Brinkmann J., 2004, MNRAS, 351, 1151
- Brodwin et al. (2013) Brodwin M., et al., 2013, ApJ, 779, 138
- Bruzual & Charlot (2003) Bruzual G., Charlot S., 2003, MNRAS, 344, 1000
- Butcher & Oemler (1984) Butcher H., Oemler Jr. A., 1984, ApJ, 285, 426
- Chabrier (2003) Chabrier G., 2003, PASP, 115, 763
- Charlot & Fall (2000) Charlot S., Fall S. M., 2000, ApJ, 539, 718
- Cooper et al. (2008) Cooper M. C., et al., 2008, MNRAS, 383, 1058
- Daddi et al. (2007) Daddi E., et al., 2007, ApJ, 670, 156
- Darvish et al. (2015) Darvish B., Mobasher B., Sobral D., Scoville N., Aragon-Calvo M., 2015, ApJ, 805, 121
- Darvish et al. (2016) Darvish B., Mobasher B., Sobral D., Rettura A., Scoville N., Faisst A., Capak P., 2016, ApJ, 825, 113
- Dressler et al. (1999) Dressler A., Smail I., Poggianti B. M., Butcher H., Couch W. J., Ellis R. S., Oemler Jr. A., 1999, ApJS, 122, 51
- Elbaz et al. (2007) Elbaz D., et al., 2007, A&A, 468, 33
- Faber et al. (2007) Faber S. M., et al., 2007, ApJ, 665, 265
- Feldmann et al. (2017) Feldmann R., Quataert E., Hopkins P. F., Faucher-Giguère C.-A., Kereš D., 2017, MNRAS, 470, 1050
- Feulner et al. (2005) Feulner G., Goranova Y., Drory N., Hopp U., Bender R., 2005, MNRAS, 358, L1
- Gómez et al. (2003) Gómez P. L., et al., 2003, ApJ, 584, 210
- Guennou et al. (2010) Guennou L., et al., 2010, A&A, 523, A21
- Guennou et al. (2014) Guennou L., et al., 2014, A&A, 561, A112
- Gunn & Gott (1972) Gunn J. E., Gott III J. R., 1972, ApJ, 176, 1
- Hammer et al. (2005) Hammer F., Flores H., Elbaz D., Zheng X. Z., Liang Y. C., Cesarsky C., 2005, A&A, 430, 115
- Hester (2006) Hester J. A., 2006, ApJ, 647, 910
- Karim et al. (2011) Karim A., et al., 2011, ApJ, 730, 61
- Kauffmann et al. (2004) Kauffmann G., White S. D. M., Heckman T. M., Ménard B., Brinchmann J., Charlot S., Tremonti C., Brinkmann J., 2004, MNRAS, 353, 713
- Khostovan et al. (2015) Khostovan A. A., Sobral D., Mobasher B., Best P. N., Smail I., Stott J. P., Hemmati S., Nayyeri H., 2015, MNRAS, 452, 3948
- Koyama et al. (2013) Koyama Y., et al., 2013, MNRAS, 434, 423
- Laganá et al. (2013) Laganá T. F., Martinet N., Durret F., Lima Neto G. B., Maughan B., Zhang Y.-Y., 2013, A&A, 555, A66
- Laganá et al. (2016) Laganá T. F., Ulmer M. P., Martins L. P., da Cunha E., 2016, ApJ, 825, 108
- Lara-López et al. (2010) Lara-López M. A., Bongiovanni A., Cepa J., Pérez García A. M., Sánchez-Portal M., Castañeda H. O., Fernández Lorenzo M., Pović M., 2010, A&A, 519, A31
- Le Fèvre et al. (2000) Le Fèvre O., et al., 2000, MNRAS, 311, 565
- Lee et al. (2007) Lee J. H., Lee M. G., Kim T., Hwang H. S., Park C., Choi Y.-Y., 2007, ApJ, 663, L69
- Lee et al. (2015) Lee S.-K., Im M., Kim J.-W., Lotz J., McPartland C., Peth M., Koekemoer A., 2015, ApJ, 810, 90
- Lewis et al. (2002) Lewis I., et al., 2002, MNRAS, 334, 673
- Lilly et al. (1996) Lilly S. J., Le Fevre O., Hammer F., Crampton D., 1996, ApJ, 460, L1
- Madau et al. (1996) Madau P., Ferguson H. C., Dickinson M. E., Giavalisco M., Steidel C. C., Fruchter A., 1996, MNRAS, 283, 1388
- Martin et al. (2017) Martin G., Kaviraj S., Devriendt J. E. G., Dubois Y., Laigle C., Pichon C., 2017, MNRAS, 472, L50
- Martinet et al. (2015) Martinet N., et al., 2015, A&A, 575, A116
- McCarthy et al. (2007) McCarthy I. G., et al., 2007, MNRAS, 376, 497
- McGee et al. (2011) McGee S. L., Balogh M. L., Wilman D. J., Bower R. G., Mulchaey J. S., Parker L. C., Oemler A., 2011, MNRAS, 413, 996
- Moore et al. (1996) Moore B., Katz N., Lake G., Dressler A., Oemler A., 1996, Nature, 379, 613
- Mundy et al. (2017) Mundy C. J., Conselice C. J., Duncan K. J., Almaini O., Häußler B., Hartley W. G., 2017, MNRAS, 470, 3507
- Muzzin et al. (2012) Muzzin A., et al., 2012, ApJ, 746, 188
- Noeske et al. (2007a) Noeske K. G., et al., 2007a, ApJ, 660, L43
- Noeske et al. (2007b) Noeske K. G., et al., 2007b, ApJ, 660, L47
- Peng et al. (2010) Peng Y.-j., et al., 2010, ApJ, 721, 193
- Pérez-González et al. (2005) Pérez-González P. G., et al., 2005, ApJ, 630, 82
- Piffaretti et al. (2011) Piffaretti R., Arnaud M., Pratt G. W., Pointecouteau E., Melin J.-B., 2011, A&A, 534, A109
- Pintos-Castro et al. (2013) Pintos-Castro I., et al., 2013, A&A, 558, A100
- Popesso et al. (2011) Popesso P., et al., 2011, A&A, 532, A145
- Pozzetti et al. (2010) Pozzetti L., et al., 2010, A&A, 523, A13
- Scodeggio et al. (2009) Scodeggio M., et al., 2009, A&A, 501, 21
- Sereno (2015) Sereno M., 2015, MNRAS, 450, 3665
- Sobral et al. (2011) Sobral D., Best P. N., Smail I., Geach J. E., Cirasuolo M., Garn T., Dalton G. B., 2011, MNRAS, 411, 675
- Sobral et al. (2013) Sobral D., Smail I., Best P. N., Geach J. E., Matsuda Y., Stott J. P., Cirasuolo M., Kurk J., 2013, MNRAS, 428, 1128
- Sobral et al. (2014) Sobral D., Best P. N., Smail I., Mobasher B., Stott J., Nisbet D., 2014, MNRAS, 437, 3516
- Strateva et al. (2001) Strateva I., et al., 2001, AJ, 122, 1861
- Tadaki et al. (2012) Tadaki K.-i., et al., 2012, MNRAS, 423, 2617
- Wolf et al. (2005) Wolf C., Gray M. E., Meisenheimer K., 2005, A&A, 443, 435
- Yoshida et al. (2006) Yoshida M., et al., 2006, ApJ, 653, 988
- Zabludoff & Mulchaey (1998) Zabludoff A. I., Mulchaey J. S., 1998, ApJ, 496, 39
- Zheng et al. (2007) Zheng X. Z., Bell E. F., Papovich C., Wolf C., Meisenheimer K., Rix H.-W., Rieke G. H., Somerville R., 2007, ApJ, 661, L41
- da Cunha et al. (2008) da Cunha E., Charlot S., Elbaz D., 2008, MNRAS, 388, 1595
Appendix A Completeness
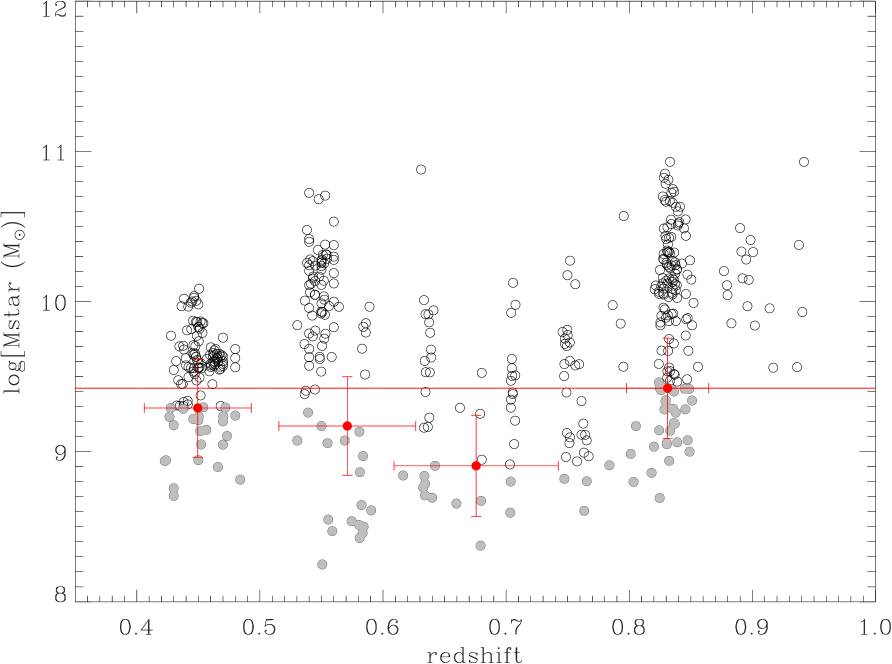
To compare the stellar masses in this sample, we defined the completeness stellar mass as a function of redshift following Section 3.1 of Laganá et al. (2013) (but also adopted in Bolzonella et al., 2010; Pozzetti et al., 2010). This is the lowest mass at which the galaxy stellar mass function can be considered as reliable and unaffected by incompleteness.
For each galaxy, we computed the “limiting mass”, which is the stellar mass that this galaxy would have if its apparent magnitude was equal to the sample limit magnitude (i.e., I = 23.2): , where is the stellar mass of the galaxy derived from MAGPHYS with apparent magnitude I.
We devided our sample in for redshift bins and, for each bin, we computed the 20% faintest galaxies (grey points in Fig. A1) and then, for each redshift bin we define the value corresponding to 95% of the distribution of limiting masses as a minimum mass. Fitting these four bins of limiting mass values, we have a mass completeness function independent of redshift, given by . We thus adopted this value as the lowest galaxy stellar mass that will be considered in our analysis. Also, we applied a K-S test and it shows that the probability that the mass distribution from the two redshift bins ( and ) are draw from different population is about 15% and do not introduce any bias in the results.
Appendix B SED fits and NIR data
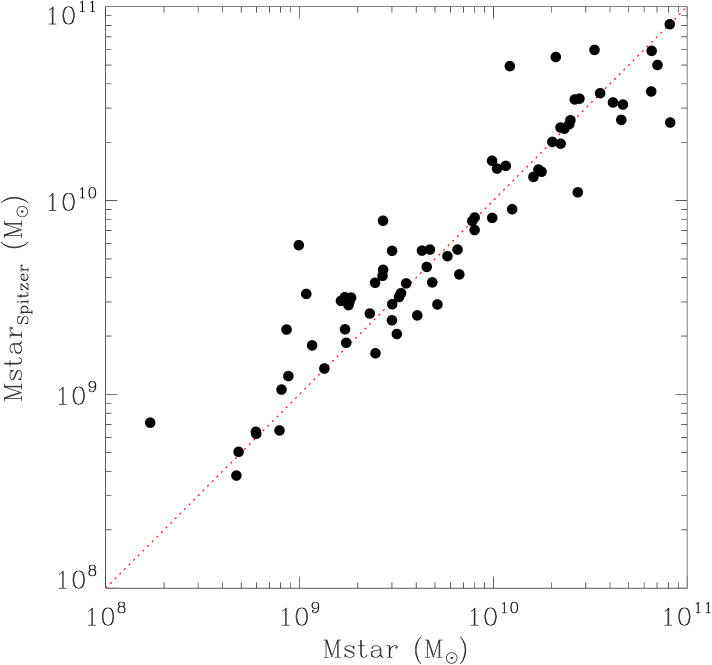
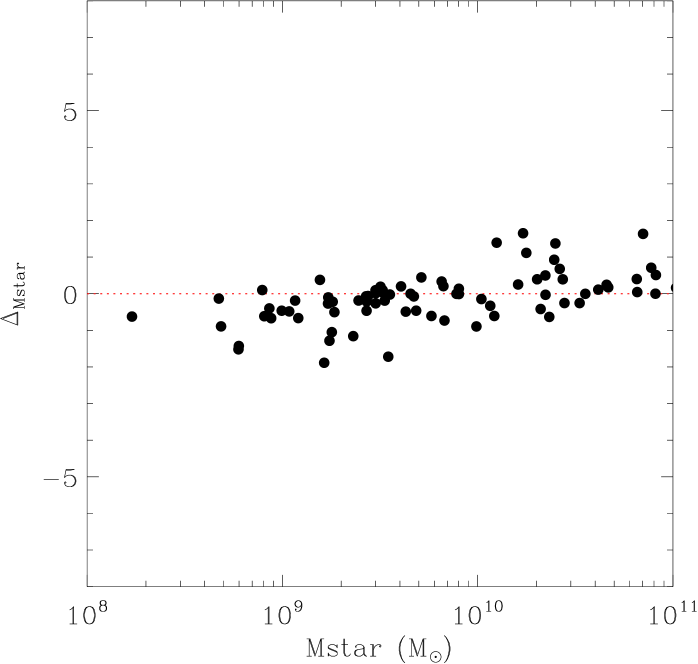
For five clusters in our sample (LCDCS130, LCDCS173, LCDCS504, LCDCS531 and, LCDCS853) there are IRAC1 and IRAC2 available data. Thus, in order to test how these bands would affect our results, we show in Fig. B1 the stellar mass derived with and without Spitzer bands. Since we use more than one near infra-red data to constrain the IR regime, we see that the results are consistent and not including IRAC bands does not affect the derived results because MAGPHYS uses a Bayesian approach to determine the and SFR that takes into account uncertainties due to the lack of data in certain spectral ranges and/or degeneracies between physical parameters.
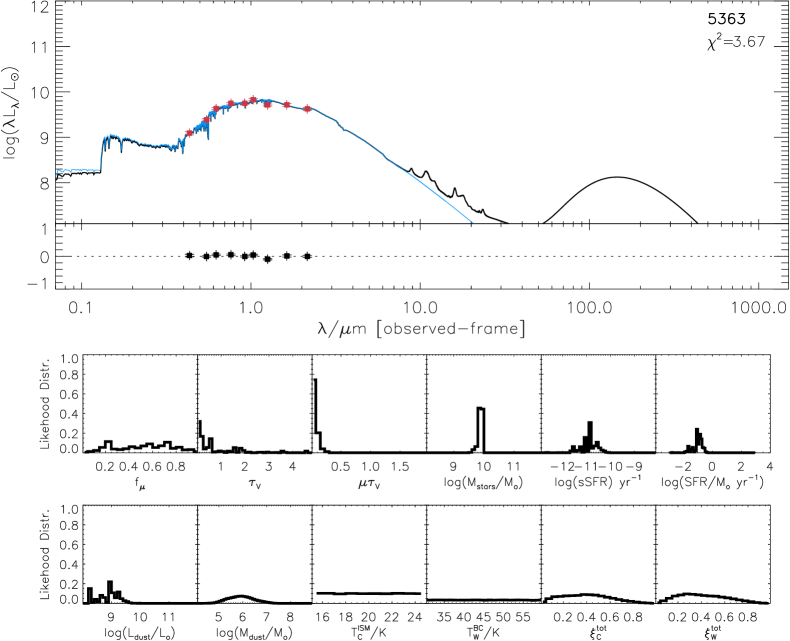
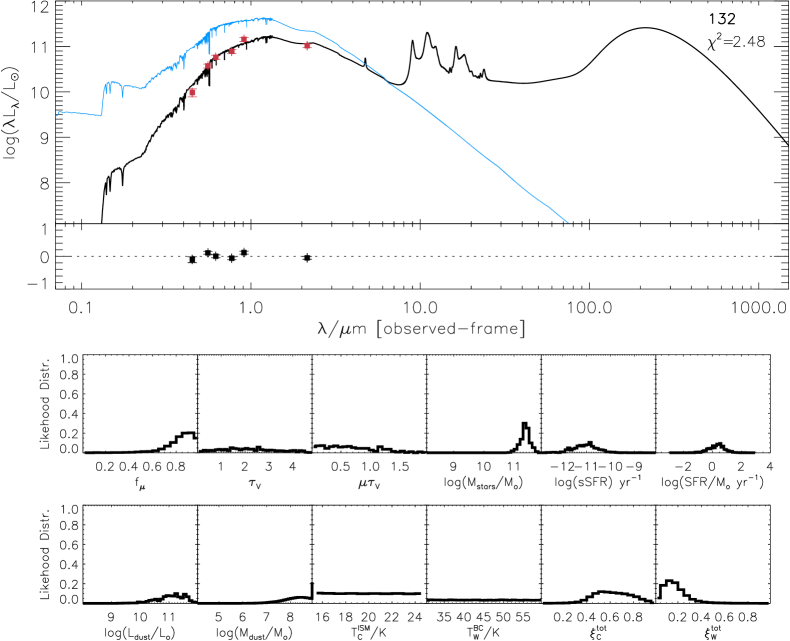
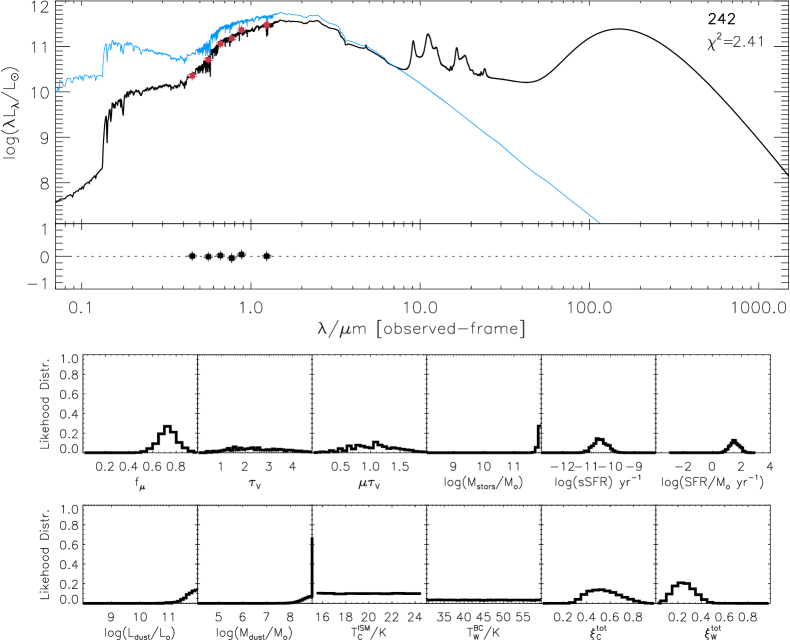
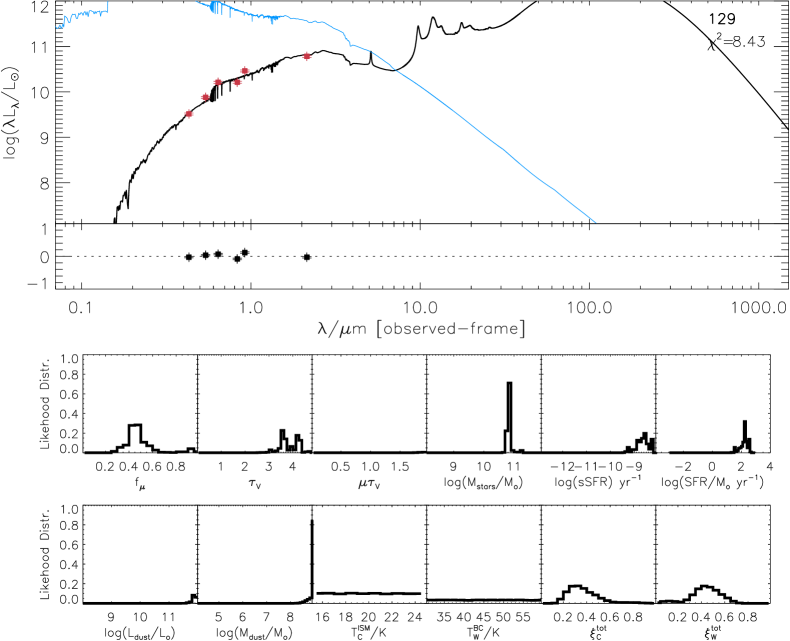
Here, we also show some SED fits for typical “quenched” and SF galaxies at low (Fig. B2) and high redshifts (Fig. B3). The best fit model is represented by the black solid lines that are fitted to the observed SED (red points). The blue lines correspond to the unattenuated stellar population spectrum. The minor panels show the likelihood distribution of the output parameters derived from fits to the observed spectral energy distribution.