The evolution of precipitate crystal structures in an Al-Mg-Si(-Cu) alloy studied by a combined HAADF-STEM and SPED approach
Abstract
This work presents a detailed investigation into the effect of a low Cu addition (0.01 at.%) on precipitation in an Al-0.80Mg-0.85Si alloy during ageing. The precipitate crystal structures were assessed by scanning transmission electron microscopy combined with a novel scanning precession electron diffraction approach, which includes machine learning. The combination of techniques enabled evaluation of the atomic arrangement within individual precipitates, as well as an improved estimate of precipitate phase fractions at each ageing condition, through analysis of a statistically significant number of precipitates. Based on the obtained results, the total amount of solute atoms locked inside precipitates could be approximated. It was shown that even with a Cu content close to impurity levels, the Al-Mg-Si system precipitation was significantly affected with overageing. The principal change was due to a gradually increasing phase fraction of the Cu-containing Q′-phase, which eventually was seen to dominate the precipitate structures. The structural overtake could be explained based on a continuous formation of the thermally stable Q′-phase, with Cu atomic columns incorporating less Cu than what could potentially be accommodated.
keywords:
Al-Mg-Si-Cu alloy , Precipitation , Scanning transmission electron microscopy , Scanning precession electron diffraction , Machine learning1 Introduction
Al-based composites and alloys are prime candidates for future applications due to increasing industrial demands for materials combining properties such as high strength, low weight, good formability and corrosion resistance. They are being used to completely or partially replace, or to be combined with other alloys in a range of applications including transport, construction and packaging [1]. The 6xxx series Al(-Mg-Si) alloys form one of the main groups of age-hardening Al alloys. They have demonstrated a combination of properties desirable to the automotive industry [2], and are becoming increasingly utilized in this area [3]. Here, the high strength-to-weight ratio exhibited by these alloys allows for production of lighter vehicles with better fuel efficiency and hence reduced emissions.
6xxx series Al alloys are characterised by a significant increase in hardness upon short-term thermal ageing. The increase is caused by a large number of nano-sized, semi-coherent and metastable precipitates that form in the Al matrix from the solid solution [4,5]. The total alloying addition typically amounts to a few at.%. Needle-shaped precipitates extending along 100 are characteristic of this system, and at peak hardness the microstructure typically comprises a high number density of small -needles [6]. The precipitation sequence in Al-Mg-Si alloys is normally given as [7,8]
| SSSS | |||
where SSSS stands for supersaturated solid solution. The different crystal structures can be found elsewhere [9-14].
Many studies have shown that Cu additions in Al-Mg-Si alloys have a positive effect on age-hardening, by providing a higher number density of smaller precipitates [15,16]. This has been explained based on density functional theory calculations using two-body interaction energies, where Cu was found to minimize the total energy in the Al-Mg-Si system [17]. With Cu additions, the 6xxx series precipitation sequence is changed to [18]
| SSSS | |||
See [19-25] for the corresponding crystal structures. This implies that the formation of is suppressed, and other metastable precipitate phases are formed at peak hardness conditions. The different phases can coexist within individual precipitates, forming hybrid precipitate structures. With thermal ageing, this multiphase configuration will undergo continuous changes through diffusive transformations, entailing a complex interplay that occurs on the atomic scale.
The metastable precipitates in the Al-Mg-Si-Cu system are all structurally connected through a mutual network of Si atomic columns. This network exhibits a projected near hexagonal symmetry with Å, Å, being an integer. Here, the lattice constant c is parallel to the needle/rod/lath axis [18]. The precipitates can be described as stacks of atomic columns in directions adapting to the Al lattice periodicity. They are defined through different arrangements of Al, Mg and Cu atomic columns situated in-between, or for certain phases with Cu columns replacing, the Si network columns [26]. Mixed element occupancy of atomic columns is also possible. The projected Si network is fragmented in the case of the -phase because of a high coherency with the Al matrix.
This work focuses on the influence of low amounts of Cu (0.01 at.%/0.03 wt.%) because of a reported considerable effect on precipitation when present in higher concentrations ( 0.4 wt.%) [23,27-29]. Previous studies evaluating the effect of low Cu additions looked at lean extruded alloys ( 0.1 wt.%) [26,30,31]. High-resolution transmission electron microscopy (TEM) studies found that 0.1 wt.% Cu had limited effect on the Al-Mg-Si system precipitation, merely affecting the precipitation kinetics and number densities. However, the precipitates were disordered, with sub-units of known metastable precipitates in the Al-Mg-Si-Cu system. It was not measured any significant difference in material hardness with 0.1 wt.% Cu. It remains interesting to assess the atomic scale effects of near impurity level Cu additions, and with prolonged ageing times.
Existing methodologies in microstructure quantification of Al alloys by TEM yield information on precipitate morphologies and distributions [32], including lengths, projected cross-section areas, number densities and volume fractions [18]. Despite being one of the main obtained microstructure parameters, the total precipitate volume fraction by itself is difficult to clearly relate to any measured material property. What is missing is a statistical assessment of the precipitate phase fractions at each ageing condition, which would enable refinement of the total volume fraction into a volume fraction per phase. Each phase has a different chemical composition, and hence locks different amounts of solute elements inside the structure. The amount and chemical identity of solutes left in solid solution have considerable effect on many material properties, including conductivity, ductility, corrosion and hardness.
Detailed information regarding coexisting phases and the presence of trace elements inside precipitates can be obtained using e.g. atomically resolved high-angle annular dark-field scanning transmission electron microscopy (HAADF-STEM). Other options include nanobeam diffraction and atom-probe tomography (APT). Despite offering insight to the crystal structure and elemental composition of individual precipitates, the drawback with these approaches is poor statistics, as only a limited number of precipitates can be studied. Especially with larger variations in phases exhibited at each ageing condition, this is a limitation for accurately calculating the precipitate phase fractions.
The possibility for large variations in Al-Mg-Si-Cu phases existing requires a complementary technique capable of probing a substantial number of precipitates, from which one can infer an overall picture of the frequency of phases. It has been demonstrated that scanning precession electron diffraction (SPED) combined with a machine learning approach can give information on the precipitate phase fractions in the microstructure of Al-Mg-Si-Cu alloys [33]. This scanning technique has the potential of probing a larger number of precipitates than feasible by (S)TEM lattice imaging and APT. The SPED technique was developed further in this work, and combined with HAADF-STEM. This allowed evaluation of both the crystal structure in individual precipitates, as well as a quantitative analysis of precipitate phase fractions using a substantial number of precipitates in each ageing condition.
The developed technique was employed to achieve the following goals:
-
1.
To obtain an improved understanding of the precipitate crystal structure evolution that occurs during ageing
-
2.
To elaborate the effect of low Cu additions in the Al-Mg-Si system on precipitation in the overageing stage
In the first part, the combined HAADF-STEM and SPED methodology used throughout this work is presented along with supporting evidence. In the second part, the obtained results are presented and evaluated.
2 Experimental procedure
2.1 Material and heat treatment
The material studied was an Al-Mg-Si alloy (6082) with low Cu addition obtained from the materials manufacturer Neuman Aluminium Raufoss (Raufoss Technology). The composition is given in Table 1. A cylinder sample (Ø , height) was cut from an extruded bar and subjected to solution heat treatment at for , and then water-quenched to room temperature. natural ageing occured before the material was set to artificial ageing at in an oil bath. The peak hardness condition was obtained after ageing, and the additional overaged conditions studied in this work were obtained after , week, weeks and month total ageing.
| Element | Al | Si | Mg | Cu | Fe | Mn | Cr |
|---|---|---|---|---|---|---|---|
| at.% | bal. | 0.85 | 0.80 | 0.01 | 0.12 | 0.25 | 0.08 |
| wt.% | bal. | 0.88 | 0.72 | 0.03 | 0.24 | 0.51 | 0.16 |
2.2 TEM specimen preparation
TEM samples were made by standard electro-polishing. Al discs with diameter and thicknesses of approximately were electro-polished using a Struers Tenupol-5. The applied electrolyte comprised 1/3 nitric acid (HNO3) and 2/3 methanol (CH3OH), and was kept at to . The applied voltage was set to (). Prior to SPED and HAADF-STEM experiments, the specimens were cleaned using a Fischione 1020 Plasma Cleaner to reduce the risk of carbon contamination build-up during data acquisition.
2.3 Electron microscopy
A JEOL 2100F microscope operated at 200 kV was used for conducting the SPED experiments. SPED was performed using a NanoMEGAS DigiSTAR scan generator retrofitted to the instrument. This system enables the simultaneous scan and acquisition of electron diffraction patterns (DPs) via imaging the phosphor viewing screen of the microscope using an externally mounted camera [34].
The microscope was operated in nanobeam diffraction mode when performing SPED, using an unprecessed probe diameter of , or . The probe semi-convergence angle was . The precession angle employed was , or , and the precession frequency was set to 100 Hz. The scan step size was selected as , or depending on the material condition studied. Exposure times used were or per pixel. The double-rocking probe required for PED was aligned following the method set out by Barnard et al. [35]. A typical dataset comprised PED patterns ( 3.2 GB) and required on average and to acquire.
HAADF-STEM images were recorded on a double-corrected JEOL ARM200F microscope operated at using a detector collection angle of . Conventional precipitate statistics were obtained using a JEOL 2100 microscope (). The specimen thickness was measured by electron energy loss spectroscopy (EELS). All TEM experiments were conducted in the 001 zone axis of the Al matrix.
2.4 SPED data analysis
The obtained 4D SPED datasets, comprising a 2D PED pattern at each position of a 2D area scan, were analysed using the HyperSpy [36] Python library. The different processing steps are illustrated in Fig. 1. Initial visualisation of the precipitates present in the scan areas was obtained using virtual dark-field (VDF) images. These were formed by plotting the intensity within a selected sub-set of diffracting pixels, a virtual aperture, as a function of probe position. An annular aperture was selected sufficiently large and positioned so as to include diffraction spots from all precipitates lying parallel to the beam direction, verified by TEM images from the same region.
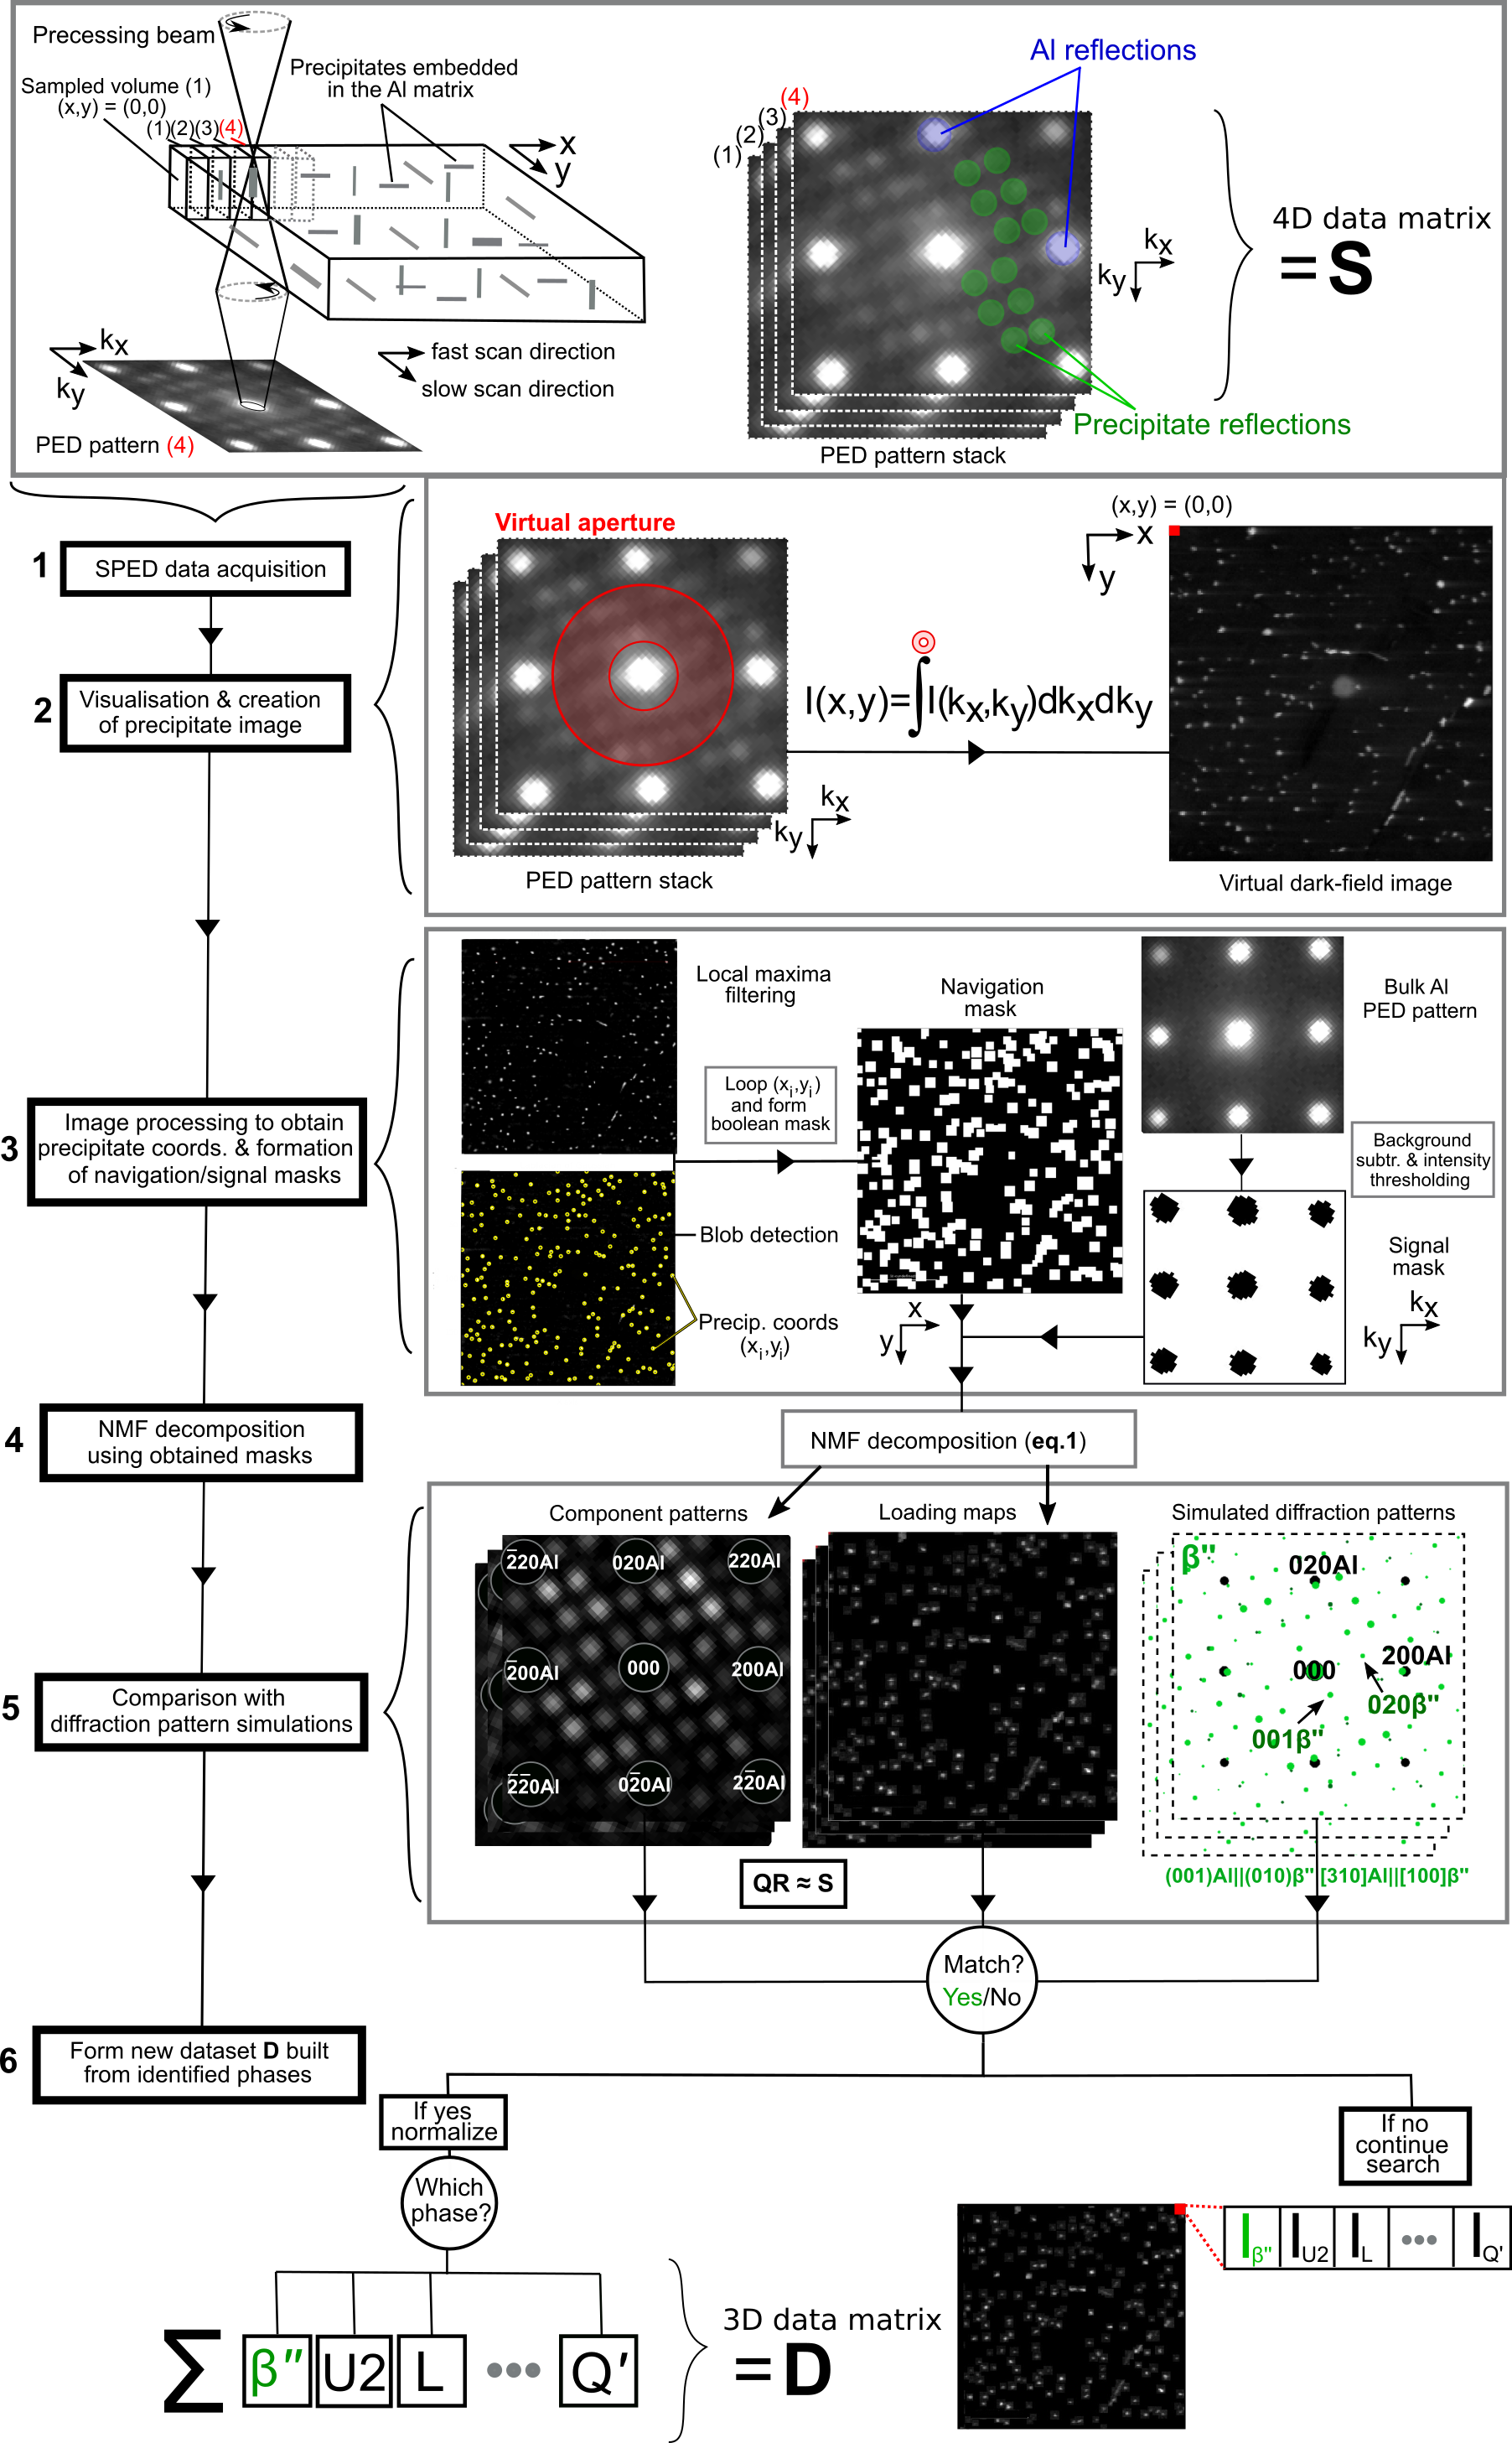
The positions () of the precipitates were extracted from the VDF images using a local maxima filtering and a blob detection algorithm based on the Laplacian of Gaussian, both building on Scikit-image project implementations [37]. Using the obtained precipitate coordinates, it was constructed a boolean mask covering the immediate neighbourhood of the precipitate centres (), referred to as a navigation mask. In addition, a boolean mask covering the PED pattern Al reflections, a signal mask, was formed. The latter was obtained by applying background subtraction to a bulk Al PED pattern followed by intensity thresholding.
An unsupervised learning approach based on non-negative matrix factorization (NMF) [38] was applied to the SPED data, using only the regions of interest marked by the obtained masks, i.e. the pixels covering each precipitate and the pixels falling in-between the Al reflections. The NMF algorithm approximates the 4D dataset, S, by the product of two matrices, Q and R, by minimizing the error function under a positivity requirement
| (1) |
The inherent condition of positive matrices Q and R ensures more physically meaningful results, being a rational choice in light of the positive nature of PED pattern intensities recorded. The decomposition returned underlying component patterns that represent the data, along with associated loadings at each real space pixel [39]. The loading maps indicate regions where the component patterns are significant, and resemble simplified dark-field images, see Fig. 1.
In the case of mixed PED patterns in individual pixels, i.e. patterns composed of reflections from multiple phases, one obtains loading maps with overlapping regions of intensity. Here, the PED patterns have been separated into individual components. This is the key towards unraveling the multiple phase information that can be contained in single pixel PED patterns. This was also attempted by cross-correlation and peak finding approaches, but for the weak precipitate phase reflections, these approaches were deemed inadequate.
The decomposition takes as input the number of components that will approximate the total dataset. Ideally, in the regions selected by the obtained masks, the number of components should equal the number of unique phases present multiplied by the number of allowed orientations, given by their orientation relationship with the Al matrix. This requires the scan area to remain in zone axis orientation. However, this is approximately achieved as long as the bending over the scanned area is smaller than the applied precession angle. Furthermore, the integrating operation of the precession averages out some of the effects from dynamical scattering, and acts to make the PED patterns more ’kinematic-like’ [40]. This reduces the number of components needed considerably, and is crucial for machine learning decomposition routines to work. Realistically, due to non-ideal microscope alignments, imperfect masks, disordered phases, strain, dynamical effects and large area tilts, 4-5 times the ideal number of components needed to be included. Through trial-and-error, it was found that 80-120 components were necessary to represent the features of interest in the SPED data. Using a larger number introduced components associated with noise.
After decomposition, the NMF component patterns were manually compared with simulated (kinematic) DPs from known Al-Mg-Si-Cu precipitate phases. Once identified, the associated loading maps provided direct interpretation of real space positions of each phase. The loadings of the identified NMF components were then normalized and summed
Here, denotes scan pixel coordinate and denotes the normalized loading map for the th component pattern. The index j runs over all component patterns matched to phase , e.g. as a result of the different orientations allowed by the orientation relationship to the Al matrix. Subsequently, it was formed a 3D data matrix D built from all phases identified, where elements of D, , i.e. denoting the loading value in pixel from phase . The net result is a reconstructed and simplified description of the diffraction data, built from loading maps associated with component patterns matched to precipitate phases from the Al-Mg-Si-Cu system.
The data matrix D formed the basis for calculating an average phase fraction for phase , denoted , using
| (2) |
Here, the sum runs over all precipitate pixels , for a total number of pixels, determined as those pixels which have a significant loading sum .
In summary, a decomposition algorithm based on NMF was applied to the diffraction data from precipitates lying parallel to the beam direction. The decomposition results were matched with phases existing in the material, and combined to form a simplified representation of the SPED scan data. Finally, precipitate phase fractions were estimated using a pixel-based calculation where each precipitate PED pattern has been divided into a sum of the identified phase patterns.
3 Results and discussions
3.1 Conventional TEM analysis
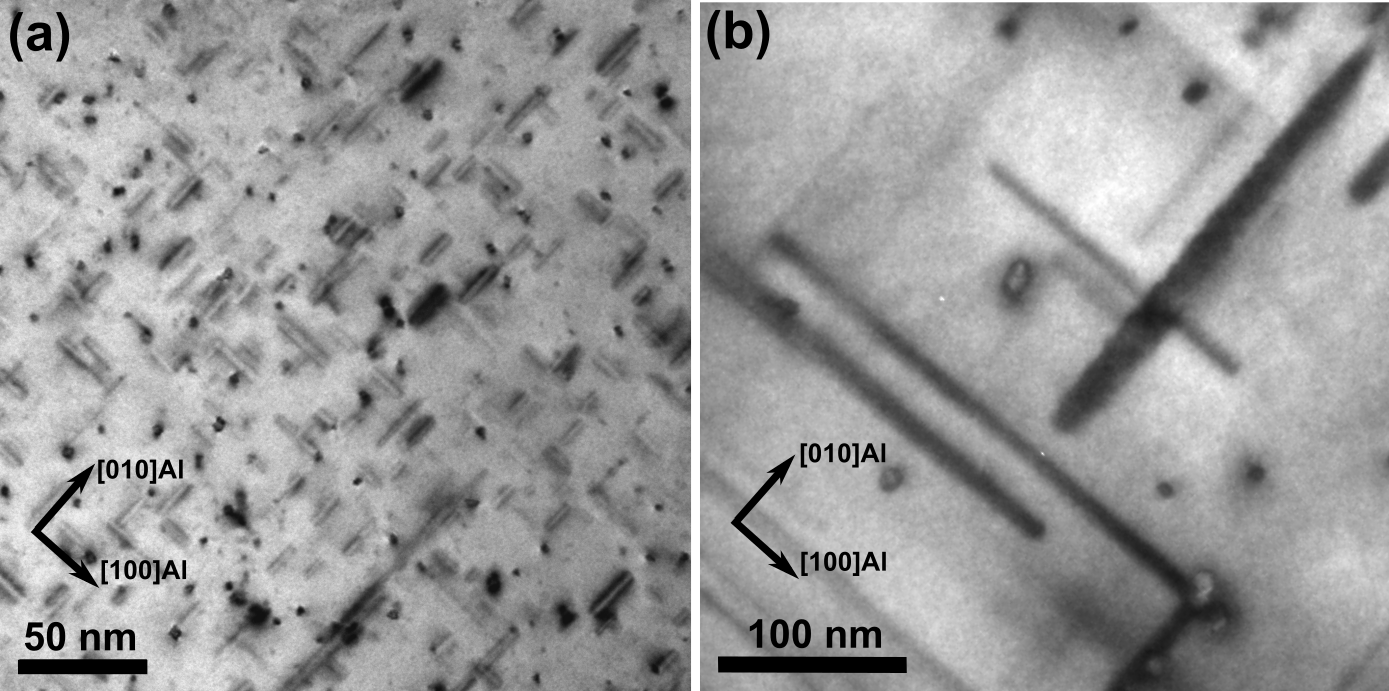
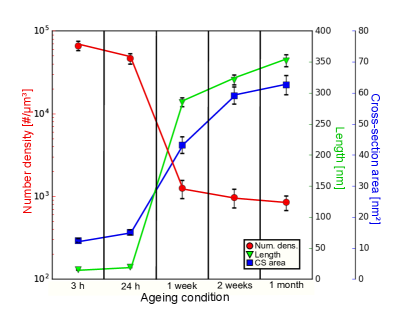
Fig. 2 shows the large transformation of the Al alloy microstructure when subjected to prolonged ageing at . At ageing (peak hardness) the microstructure comprises a high number density of small needles, with an average length of and average cross-section area. After 1 month total ageing, the precipitates have coarsened considerably, measuring in average needle length and in average cross-section area.
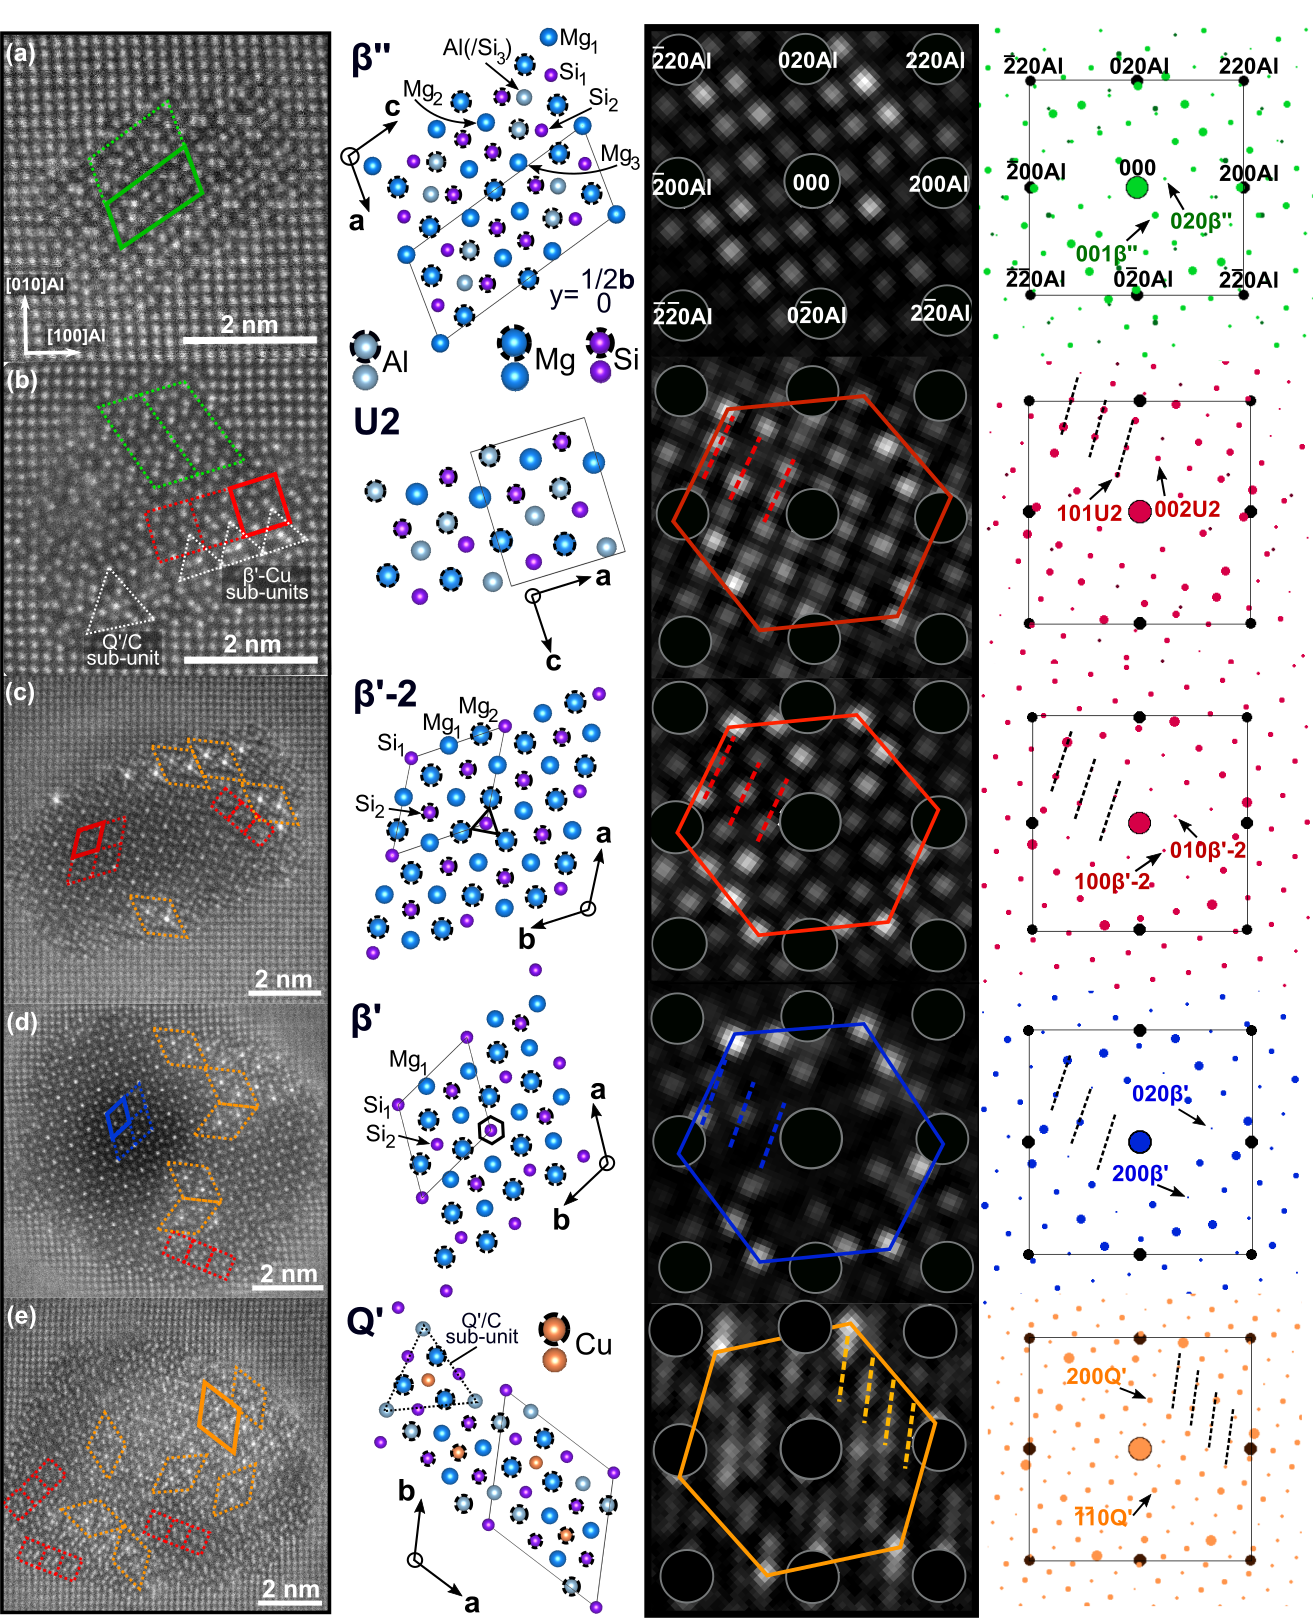
HAADF-STEM images of precipitates from the five ageing conditions studied are shown in Fig. 3. The precipitates presented were selected from a series of images, and evaluated as representative for each ageing condition. Starting with Fig. 3a acquired at ageing, the precipitate is seen to be a pure -phase. Some of the atomic columns appear brighter than the other corresponding columns due to partial occupancy of Cu. This is for instance seen at the Al(/Si3) columns in the highlighted unit cell. Cu () is observed with a higher contrast than the other elements Mg (), Al (), and Si () due to the atom column scattering power at high angles for HAADF-STEM imaging [41]. For some precipitates (not shown), Cu-enriched columns could be seen at the precipitate interface. This has been observed previously, and has been proposed as a mechanism to suppress misfit dislocations [42].
Fig. 3b shows a precipitate at ageing. In this condition we see that is still dominant, but many additional phases are now present, forming a fragmented hybrid structure. Unit cells and sub-units of the U2-phase connect to the unit cells of . At the lower part of the image, sub-units of Cu-containing phases such as Q′/C and -Cu are seen, which have Cu columns located in-between and replacing the Si network, respectively. These phases are conspicuous due to their high Cu content. Several precipitates at this condition showed the same tendency, with a predominantly Al-Mg-Si containing /U2 interior, and Cu-enrichment, as well as randomly positioned sub-units of Cu-containing phases at the precipitate interface. This is similar to earlier results [26,43], showing /disordered precipitates at under-aged and peak hardness conditions for alloys with higher Cu content. The positions of Cu enriched columns in the -phase for the and conditions seem to agree with the findings of Li et al. [44], which found that Cu incompletely substitutes for Mg1 and Si3 (here, Al) columns. In rare cases, Si2 columns also showed partial Cu occupancy.
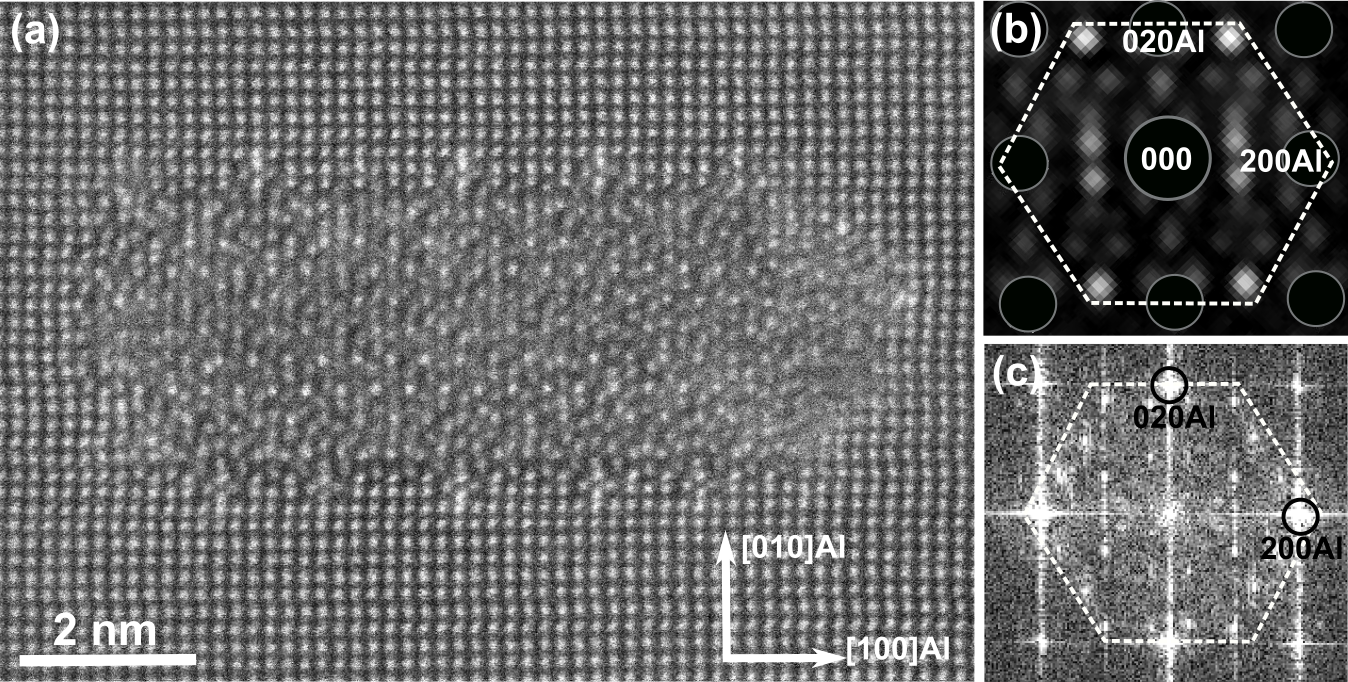
After 1 week ageing (Fig. 3c) it is seen that a large transformation of the precipitate structure has occurred. The precipitates have coarsened considerably. The largest phase fraction, often dominating the precipitate interior, is now that of the -phase. Detailed image analysis revealed that there exists a pattern of varying intensity at the Si column positions. Many regions showed a significantly higher intensity at Si1 columns as compared to the Si2 columns, which were more uniform in intensity. These regions are likely associated with a structure as reported by Vissers et al. [10]. There evidence was given for a structure with an addition of 1 extra Si atom per 34.05 Å in the c-direction at the Si1 columns. This leads to a higher column occupancy, and hence a higher intensity at the Si1 site. However, in other regions the difference between Si1 and Si2 column intensities was less distinct, meaning that the atomic modulation of Si1 columns has not developed. The border between the regions is not very clear, and there exists a tiling of the two.
The difference is more evident in diffraction data, where the presence of added reflections (Fig. 3c-d) indicates a structural disparity. Image analysis and DP simulations indicate that the regions without clear modulation of Si1 columns instead have a space group symmetry similar to -Cu(/Ag) (P-62m) [22].The difference in space group symmetry gives a trigonal, as opposed to hexagonal symmetry surrounding the corner Si columns in the proper unit cell (P63/m), see Fig. 3c-d. The change of symmetry relative to proper seems to be related to the different Si1 column occupancies, which necessarily affect the bonding to the neighbouring atomic columns. The difference is difficult to assess in HAADF-STEM images, as the deviating structure can lie somewhere in-between the two symmetries. However, with the diffraction approach employed throughout this work, the two variants can clearly be separated, and in order to distinguish them, the notation -2 will be used to denote the structure that deviates from proper , see Fig. 4.
Analysis of atomic column Z-contrast indicates that -2 is isostructural with -Cu(/Ag) [22], but having Cu replaced by Si, and Al by Mg. This is probably due to the smaller size of the Si atoms as compared to Cu, which allows for more space to be occupied by the larger atom size of Mg. /-2 are the main precipitate constituents in the 1 week condition, often linked through a narrow strip of U2 unit cells/sub-units to the Al matrix or phases at the interface. The interface comprises unit cells and sub-units of Al-Mg-Si-Cu phases, most notably Q′/C. Compared with the condition, the region of Cu-containing phases at the interface has grown in extent. was not frequently observed in the 1 week condition.
After 2 weeks ageing (Fig. 3d) many precipitates show a modest coarsening relative to the 1 week condition. The phases coexisting are similar to the 1 week case. From a series of images, the main observed development of the precipitate structure seems to be the progression of the Q′-phase towards the precipitate interior. Several grouped unit cells of Q′ can now be seen.
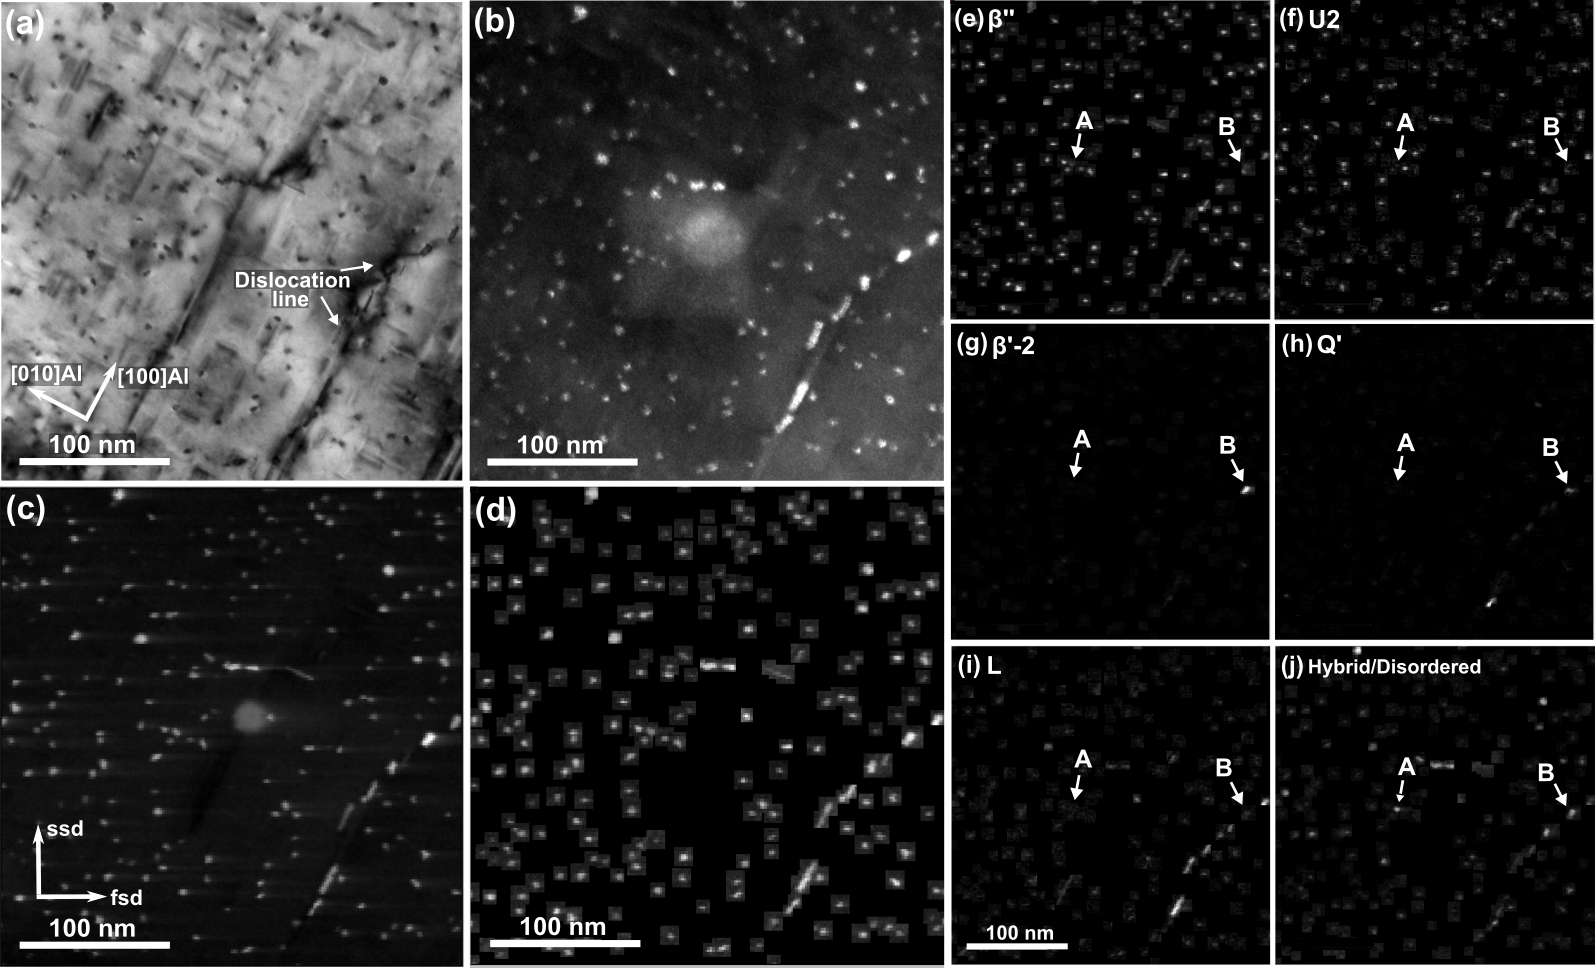
(d) Reconstruction of the SPED data from NMF component patterns matched with precipitate phases existing. (e-j) Loading maps from each of the identified phases in the SPED scan area. The two precipitates A and B are imaged by HAADF-STEM in Fig. 7. ssd and fsd denotes slow scan- and fast scan direction, respectively.
At 1 month total ageing (Fig. 3e) there is limited further coarsening of precipitates. Similar to the 1 week–2 weeks transition, there seems to be a further development of the Q′ takeover of the precipitate structures. Qualitatively, for some precipitates there seems to be a near 50/50 division of /-2 vs. Q′. Apart from these phases, there are still lines of U2 unit cells or sub-units linking or ’gluing’ the other coexisting phases together. This was the observed behaviour of the U2-phase in all conditions with disordered precipitate structures. Such U2 characteristics have also been observed in the -Cu(/Ag) phase [22].
In addition to the phases previously discussed, the L-phase was also observed in all alloy conditions (Fig. 5). This was however first revealed when the areas were revisited after SPED analysis. Its presence remained low in numbers and stable with ageing, often linked with microstructure defects such as dislocation lines. This is in agreement with previous studies of this phase [45].
In summary, the main observed precipitate phase evolution begins with a to /-2 transition. Looking at the role of Cu in the initial stages, the atoms likely start out at the /Al interface, where they act to suppress the misfit strain. Subsequently, and in agreement with previous studies, Cu atoms enter the unit cell preferentially at the Si3 (Al) and Mg1 sites. In addition, sub-units of Cu-containing phases (Fig. 3b) are formed at the precipitate interface. In the next evolution stage, there occurs a slow movement inwards by the Q′-phase, gradually taking over the precipitate interior. Cu has a low diffusion coefficient in the Al matrix, which supports the slow kinetics of Cu-containing phases observed [46]. The observed evolution is likely to terminate when there is too few additional Cu atoms left in solid solution to drive the diffusion, and can be followed qualitatively by HAADF-STEM imaging.
3.2 Assessment of the information content in SPED data
In order to obtain statistical support for the observed evolution indicated by atomically resolved imaging, SPED combined with a machine learning approach was pursued. This scanning technique can cover areas over in nm-sized steps, which could include 10s to 1000s of precipitate cross-sections depending on the thermomechanical pre-processing applied to the material. This increased sampling forms the basis for improved statistics complementary to conventional high-resolution TEM analysis. For the alloy conditions studied in this work, it was necessary to adapt the step size and hence the scanned area to include a significant number of precipitates, especially for the longest ageing times, as seen from Fig. 2b.
The VDF image presented in Fig. 6c shows a selection of 188 precipitates, acquired for the alloy condition. Comparison with bright-field and dark-field TEM images (Fig. 6a-b) indicates that all precipitates (parallel to the beam direction) are detected. The principal loading maps obtained by NMF decomposition and matched with precipitate phases existing are shown in Fig. 6e-j. This shows how the technique can be used for phase mapping in the alloy microstructure. Fig. 6d shows the sum of the loading maps, i.e. the reconstructed dataset based on the six identified precipitate phase classes (, U2, -2, Q′, L, hybrid/disordered). The hybrid class denotes component patterns that comprise a mix of individually identifiable patterns from Al-Mg-Si-Cu phases. Hybrid components are likely to arise in cases where either one of the phases in the mix does not occur in any individual PED pattern, probably caused by the spatial confinement of the phase, which does not extend beyond the scan pixel size. The disordered class denotes component patterns which do not clearly resemble any of the DP simulations, but which contain certain features of interest, such as the Si network hexagon. Comparison with the DF/VDF images (Fig. 6b-c) indicates that this reconstructed representation covers the precipitates seen in the area.
Examples of main component patterns obtained by NMF decomposition for the different alloy conditions are shown in Fig. 3a-e. These components show good agreement with (kinematic) simulations of DPs for known Al-Mg-Si-Cu precipitate structures.
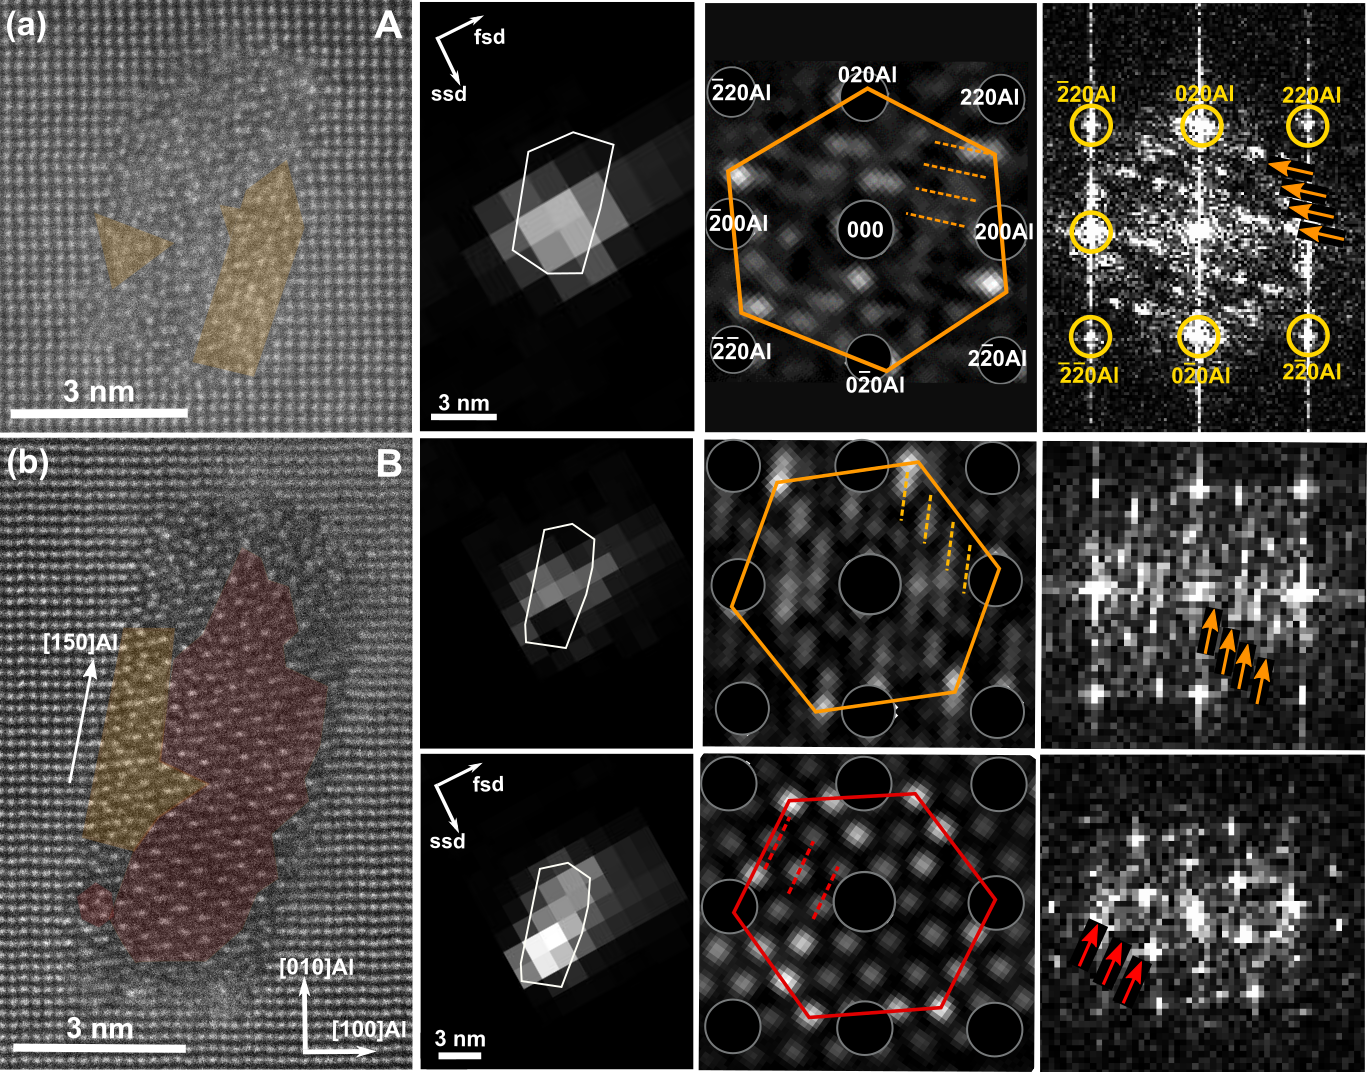
It is observed from the loading maps that several precipitates have multiple overlapping pixels of intensity coming from different phases. This shows how phases are revealed down to the sub-precipitate level, i.e. multiple phases within a single precipitate are resolved. The reliability of the decomposition was assessed by correlating the NMF results with atomic resolution images acquired from some of the very same precipitates, e.g. the precipitates labeled A and B in Fig. 6e-j, which are shown in Fig. 7a-b, respectively.
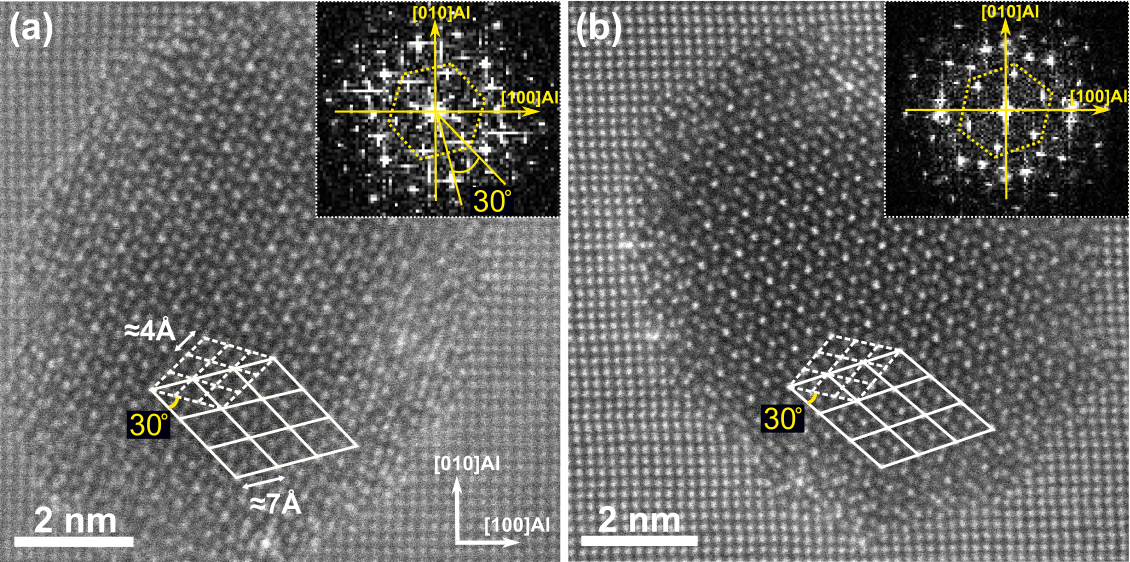
The precipitate imaged in Fig. 7a shows a particularly disordered crystal structure, with near absence of complete crystal structure unit cells. Sub-units of phases in the Al-Mg-Si-Cu system can however be discerned. The most significant loading map and its associated component pattern is shown. The pattern shows no clear match with any of the simulated DPs of single phases in Fig. 3. However, the feature of importance is the presence of a hexagonal network with reciprocal spacing in agreement with the projected Si network spacing of the Al-Mg-Si(-Cu) system. In addition, the periodicity in diffraction spot rows highlighted agrees with that of the Q′-phase, which is also seen from the FFT of the lattice image. The HAADF-STEM image agrees with the presence of a projected hexagonal Si network. HAADF-STEM and SPED both conclude that the precipitate is disordered, but an underlying Si network is present. A few unit cells and sub-units of U2, and Q′ (highlighted in Fig. 7a) can be seen. The loading map is most significant in the lower region of the precipitate, which agrees with the position of the Q′ sub-units. Additional loadings were obtained for this precipitate (not shown). The additional loadings individually described less than 20% of the precipitate pixels, and their associated component patterns all showed the Si network hexagon.
The second precipitate imaged (Fig. 7b) shows a coarsened structure located on a dislocation line in the scan area, see Fig. 6. Precipitate phases located near dislocation lines were less frequent in this alloy condition (Fig. 6e-j), and have likely coarsened as a result of solute segregation or pipe diffusion of elements such as Cu. They hence show a faster ageing response relative to the bulk precipitates. The HAADF-STEM image depicts the presence of a projected hexagonal Si network permeating the structure. The largest phase fraction comprising this precipitate is -2, seen as a bright hexagonal network of Si columns. Additionally, highlighted in the left part of the image is a smaller region of Q′ unit cells, whose structure is shown in Fig. 3e, having Cu columns situated in-between the Si network. Another defining characteristic of this phase is an interface oriented along directions, highlighted in the image. Furthermore, as /-2 does not extend to the Al matrix interface [47], there exists a narrow layer of different Al-Mg-Si-Cu phase sub-units.
The second and third columns of Fig. 7b show how the SPED analysis provides information about the phases coexisting inside this precipitate. The two main loading maps and associated component patterns obtained are shown. Comparison to DP simulations (Fig. 3) identifies the two components as Q′ (top) and -2 (bottom), respectively. The defining features are also indicated in the FFTs of the lattice images. The loading maps indicate the phase presence in each pixel. Apart from a visible effect of afterglow in the fast scan direction, the loading maps correspond reasonably well with the HAADF-STEM image.
The main strength of the SPED technique lies in the ability to scan large areas containing a substantial number of precipitates, while still preserving high spatial resolution. This forms the basis for objective evaluation of the precipitate phase occurrence using a representative distribution of precipitates. Generalizing from a series of 10-20 HAADF-STEM images can give a misleading conclusion on precipitate phase fractions in the alloy microstructure, especially when the variations between precipitate phases exhibited are relatively large. There is a risk of selectively probing larger, Cu-containing precipitates due to the strong Z-contrast dependence of HAADF-STEM. Adding to this point, a poor depth of focus leads to further selective imaging of longer, coarsened precipitate needles that reach the specimen surface.
Besides the risk of selectively probing precipitates, rare cases such as the L-phase (Fig. 5) or the Q′/-2 phase (Fig. 7b) might be missed in a HAADF-STEM analysis. These images were acquired after analysing the SPED scan data, where the precipitate PED patterns from the dislocation line revealed the presence of rare phases in this alloy condition (Fig. 6e-j). It becomes clear that a scanning technique capable of covering large areas will give a more general picture of phase distributions, and hence an improved estimate of precipitate phase fractions in the alloy microstructure. The SPED scan data presented in this work covers precipitate numbers ranging from 520 ( condition) to 101 (1 month condition). The scan areas and hence the number of precipitates can be further upscaled [33], and comes at a relatively low cost in increased analysis time.
The main limiting factors with SPED are currently due to the acquisition system. The diffraction from particularly small precipitates fall close to the noise threshold. In addition, adverse effects of afterglow is observed, see the second column of Fig. 7. This has an effect on the recorded PED patterns in the fast scan direction, and for large and strongly diffracting precipitates this effect is pronounced. It is however unlikely that the main characteristic of a precipitate is miscalculated due to this effect, as the relative intensities remain similar. There are technical solutions coming to solve these issues.
3.3 Quantification of precipitate phase fractions
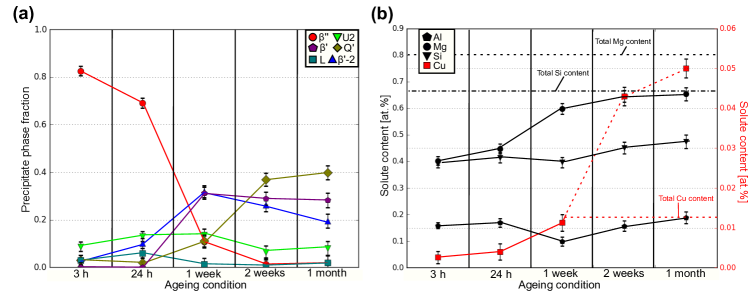
Fig. 8 summarizes the main findings from the SPED analysis for the five ageing conditions and the total of approximately 1200 precipitates identified. Fig. 8a shows the average precipitate phase fractions estimated from a representative distribution of precipitates in each ageing condition. Errors in individual precipitate phase fractions were estimated based on comparison with high-resolution images, which takes into account the adverse effects introduced by the SPED acquisition system. This error was subsequently scaled according to the number of precipitates in the recorded SPED scan, , assuming linearly independent measurements of phase fractions for each precipitate. The plot showcases the main precipitate phase evolution that occurs during ageing.
In line with the HAADF-STEM results, the presence of is seen to drop quickly with increased ageing time. At the 1 week condition it has dropped to 10%. Furthermore, it confirms the distinct transformation of precipitate crystal structures from the to the 1 week condition. The main phases present changes from and U2 to /-2, and it is interesting to note that the onset of -2 formation seems to occur before . The 1 week condition also shows an increasing Q′ phase fraction (11%). At this condition Q′ is predominantly observed inside bulk precipitates, unlike earlier conditions where it was mainly detected near microstructure defects.
With further ageing there are different developments for the three main phase fractions , -2 and Q′. The -2 phase fraction is seen to gradually decrease from 1 week to 1 month ageing, whereas stays nearly constant at about 30%. As was observed in HAADF-STEM images, the Q′ phase fraction increases steadily as a function of ageing time, and is seen from the plot to reach a phase fraction of 40% at 1 month ageing. The precipitate cross-section area exhibits a modest growth from 2 weeks to 1 month ageing, seen from Fig. 9. Interpretation of the observed /-2 evolution suggests that in order for the phase fraction to stay nearly constant, with limited cross-section area increase and with a gradually increasing fraction of Q′, both or either one of two effects are occurring:
-
1.
-2 transforms into with increased ageing time
-
2.
remains stable, and the formation of Q′ occurs preferentially at -2 regions
As previously discussed, the observed evolution is likely to end when there are too few Cu atoms left in solid solution. Using the obtained phase fractions together with measured precipitate statistics, one can estimate the amount of solute atoms locked inside precipitates. The different phases have different chemical compositions and unit cell parameters, see Table 2. The compositions listed are in the case of the -phase based on an average composition using three structures [9]. For the disordered L-phase, the composition was estimated using HAADF-STEM images, assuming a C-phase atom column density [21]. -2 was assumed to have the same average composition as .
| Precip. | Chemical | Lattice | Ref. |
|---|---|---|---|
| phase | composition | parameters [Å] | |
| Al5Mg14Si14 | , | [9] | |
| /-2 | Mg6Si3.33 | [10] | |
| U2 | AlMgSi | [11] | |
| L | Al20Mg44Si33Cu2 | , | [21] |
| Q′ | Al6Mg6Si7Cu2 | [49] | |
The precipitate phase fractions were first used to convert a measured overall volume fraction (VF) into a volume fraction per phase, VF. Subsequently, the precipitate phase unit cell parameters and composition were used to convert a volume fraction per phase into a solute fraction per phase (SF). This was calculated using a conversion factor, , relating the two parameters
The conversion factor is defined as
where UC denotes the unit cell of phase and V is its corresponding volume. Finally, the solute fractions were summed up to give a total solute content locked inside precipitates.
The results are presented in Fig. 8b, which shows the development of total solute content of main elements locked in precipitates during ageing. Besides a dip in the Al solute fraction, and a constant (or small decrease) in the solute fraction of Si in the to 1 week transition, Al, Mg, Si and Cu content in precipitates gradually increase with ageing. The noted exception for Al and Si solute fractions at to 1 week ageing is due to the formation of /-2. Unlike the other phases observed, which have Si:Mg ratios close to one, /-2 show the largest deviation with an average composition of Mg6Si3.33. This necessarily leads to a larger incorporation of Mg than Si in the precipitate structure, which is dissolved back into the solid solution. These structures also contain no Al, which explains the decrease of the Al solute fraction. The combined total solute content in precipitates is monotonously increasing with increased ageing time, meaning that the orders of magnitude decline in number density seen from Fig. 9 is compensated by the diffusive growth of large precipitates.
The Cu solute content remains low in the to transition. At this stage, the Cu content in precipitates is mainly attributed to the L and Q′-phase having formed near microstructure defects, such as dislocation lines. HAADF-STEM images show that there additionally exists an incorporation of Cu in e.g. the structure and a Cu-enrichment at the precipitate interface. This contributes however little to the total Cu content inside precipitates.
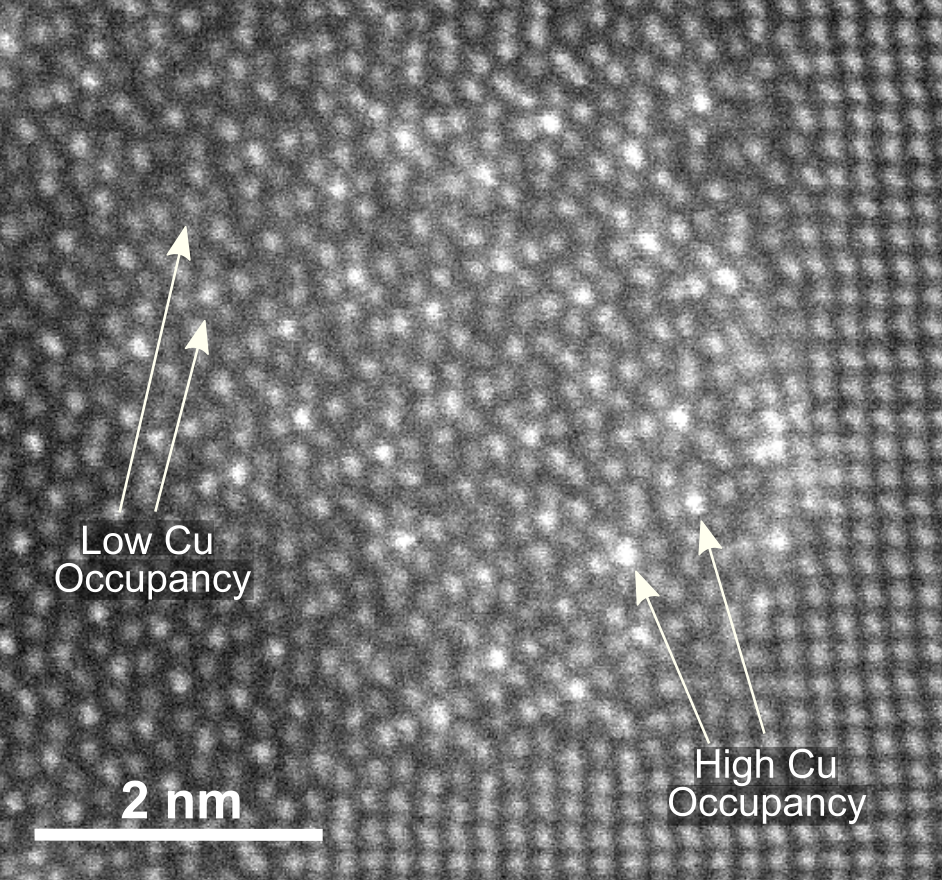
At the 1 week condition there is a significantly increased phase fraction of Q′, which leads to a higher content of Cu in precipitates. This further increases rapidly with ageing, due to a continuously increasing Q′ phase fraction. At 1 month ageing it is obtained a total solute fraction of 0.05 at.% Cu, which far surpasses the total Cu content of 0.013 at.% in the alloy, marked in Fig. 8b. The reason is that the calculation assumes a maximum Cu incorporation in the Q′ structure of 10%, which is based on the stated composition Al6Mg6Si7Cu2. However, it is observed here that there exists only a partial occupancy of Cu in the Cu atomic columns of the Q′ structure. This is clearly seen in HAADF-STEM images, see Fig. 10. The Cu content instead varies between 0-10%, leading to an overestimate using the maximum value.
What can be concluded is that the Q′ phase fraction near the 1 week condition has the potential to incorporate nearly all the Cu in the material, being the only phase with a significant Cu content. However, instead the phase continues to form, with less Cu than what can be accommodated in the structure. This explains how even a Cu content almost down to impurity levels can considerably affect the Al-Mg-Si system precipitation. The Q′ structure is more thermally stable than /-2, evident by its gradual dominance of the precipitate structure with overageing. Several HAADF-STEM images showed that the Cu occupancy was higher at the precipitate interface, where the Q′ unit cells initially are formed. This supports the indication of an inwards movement into the precipitate structures by the Q′-phase, which occurs through a slow diffusive process. The slow transformation is due to the low diffusivity of Cu in the Al matrix [46].
Different from other phases, the U2 and L phase fractions remain stable ( 16%) throughout the total ageing process. This is in agreement with HAADF-STEM lattice images, where the U2-phase is seen to form lines of unit cells in all conditions, forming the ’glue’ between the other phases, or the interface to the Al matrix. Among the Al-Mg-Si containing phases, this is the phase that remains most stable in number with ageing.
The L-phase also remains stable and low in numbers. This is thought to be due to the similarity in the number of microstructure defects in the samples studied, such as grain boundaries or dislocation lines, to which the L-phase is associated. This is clear from the presented condition SPED scan (Fig. 6i), where a dislocation line contains nearly all the L-phases in this area. The L-phase is known to have high thermal stability, and forms in the bulk at higher alloy Cu contents [45].
4 Conclusions
This work has demonstrated that combining HAADF-STEM and SPED resulted in a more accurate evaluation and quantification of the precipitate crystal structure evolution that occurs during ageing of a low Cu content Al-Mg-Si alloy. NMF decomposition of SPED data could be used to resolve phases within individual precipitates, and allowed for a statistically sound number of precipitates to be included in the analysis, beyond what is achievable by other techniques. The results enabled an estimate of precipitate phase fractions at each ageing condition, which were used to approximate the total solute content locked inside precipitates throughout the total ageing process.
At peak hardness, the precipitates were predominantly observed as pure . Upon further heat treatment, the precipitates evolved into complex hybrid structures, primarily comprising Al-Mg-Si phases like and U2 in the precipitate interior. Cu-enriched columns and sub-units of Cu-containing phases like Q′/C and -Cu existed at the precipitate interface. With increased ageing the precipitates coarsened substantially, and exhibited a projected hexagonal Si network with /-2 in the precipitate interior. Unit cells/sub-units of Cu-containing phases were still confined to the precipitate interface, but had grown larger in extent. Beyond this point it was seen a slow, but gradual progression inwards into the precipitates by the Cu-containing Q′-phase, with Cu atomic columns incorporating less Cu atoms than what could potentially be accommodated. Q′ was eventually seen to dominate the precipitate structures. It is expected that this trend would continue until most Cu atoms have been drained from the solid solution. The results show that even a low Cu content ( at.%) can significantly affect the Al-Mg-Si system precipitation, especially during overageing.
The study demonstrates the potential of SPED when combined with other TEM techniques and data analysis including machine learning. The high information content in each SPED scan can continually be explored, and with the advent of powerful and dedicated machine learning approaches and improved detector technologies, this can potentially uncover further insights to the material microstructure.
Acknowledgements
JKS, CDM and RH acknowledge support from the AMPERE project (247783), a Knowledge building Project for Industry, co-financed by The Research Council of Norway (RCN), and the industrial partners Norsk Hydro, Sapa, Gränges, Neuman Aluminium Raufoss (Raufoss Technology) and Nexans. The (S)TEM work was carried out on the NORTEM infrastructure (NFR 197405) at the TEM Gemini Centre, Trondheim, Norway. All authors extend their gratitude to collaborating researchers Duncan N. Johnstone and prof. Paul A. Midgley from the University of Cambridge.
Data availability
The TEM images presented in this work are given in raw/unprocessed form. The raw/processed scanning diffraction data required to reproduce these findings cannot be shared at this time as the data also forms part of an ongoing study.
References
- [1] G.E. Totten, D.S. MacKenzie, Handbook of Aluminum, vol. I and II, Marcel Dekker, New York, 2003.
- [2] W.S. Miller, L. Zhuang, J. Bottema, A.J. Wittebrood, P. De Smet, A. Haszler, A. Vieregge, Recent development in aluminium alloys for the automotive industry, Mater. Sci. Eng. A 280 (2000) 37–49.
- [3] Aluminium content in cars, Summary report, Ducker Worldwide LLC, 2016. http://www.ducker.com/.
- [4] M. Murayama, K. Hono, Pre-precipitate clusters and precipitation processes in Al–Mg–Si alloys, Acta Mater. 47 (1999) 1537–1548.
- [5] S.P. Ringer, K. Hono, Microstructural evolution and age hardening in aluminium alloys: atom probe field-ion microscopy and transmission electron microscopy studies, Mater. Charact. 44 (2000) 101–131.
- [6] S.J. Andersen, H.W. Zandbergen, J. Jansen, C. Træholt, U. Tundal, O. Reiso, The crystal structure of the –phase in Al–Mg–Si alloys, Acta Mater. (1998) 3283–3298.
- [7] G.A. Edwards, K. Stiller, G.L. Dunlop, M.J. Couper, The precipitation sequence in Al–Mg–Si alloys, Acta Mater. 46 (1998) 3893–3904.
- [8] C.D. Marioara, S.J. Andersen, H.W. Zandbergen, R. Holmestad, The Influence of Alloy Composition on Precipitates of the Al–Mg–Si System, Metall. Mater. Trans. A 36 (2005) 691–702.
- [9] H.S. Hasting, A.G. Frøseth, S.J. Andersen, R. Vissers, J.C. Walmsley, C.D. Marioara, F. Danoix, W. Lefebvre, R. Holmestad, Composition of precipitates in Al–Mg–Si alloys by atom probe tomography and first principles calcultations, J. Appl. Phys. 106 (2009) 123527.
- [10] R. Vissers, M.A. van Huis, J. Jansen, H.W. Zandbergen, C.D. Marioara, S.J. Andersen, The crystal structure of the phase in Al–-Mg-–Si alloys, Acta Mater. (2007) 3815–3823.
- [11] S.J. Andersen, C.D. Marioara, R. Vissers, A. Frøseth, H.W. Zandbergen, The structural relation between precipitates in Al–Mg–Si alloys, the Al-matrix and diamond silicon, with emphasis on the trigonal phase U1-MgAl2Si2, Mater. Sci. Eng. A (2007) 157–169.
- [12] S.J. Andersen, C.D. Marioara, A. Frøseth, R. Vissers, H.W. Zandbergen, Crystal structure of the orthorhombic U2-Al4Mg4Si4 precipitate in the Al–Mg–Si alloy system and its relation to the and phases, Mater. Sci. Eng. A (2005) 127–138.
- [13] S.D. Dumolt, D.E. Laughlin, J.C. Williams, Formation of a modified phase in aluminium alloy 6061, Scr. Metall. 18 (1984) 1347–1350.
- [14] A.H. Geisler, J.K. Hill, Analyses and interpretations of X-ray diffraction effects in patterns of aged alloys, Acta Crystallogr. 1 (1948) 238–252.
- [15] W.F. Miao, D.E. Laughlin, Effects of Cu content and preageing on precipitation characteristics in aluminium alloy 6022, Metall. Mater. Trans. A 31 (2000) 361–371.
- [16] M. Murayama, K. Hono, W.F. Miao, D.E. Laughlin, The effect of Cu additions on the precipitation kinetics in an Al–Mg–Si alloy with excess Si, Metall Mater. Trans. A 32 (2001) 239–246.
- [17] S. Hirosawa, F. Nakamura, T. Sato, First-principles calculation of interaction energies between solutes and/or vacancies for predicting atomistic behaviors of microalloying elements in aluminum alloys, Mater. Sci. Forum 561–565 (2007) 283–286.
- [18] C.D. Marioara, S.J. Andersen, T.N. Stene, H. Hasting, J. Walmsley, A.T.J. van Helvoort, R. Holmestad, The effect of Cu on precipitation in Al-–Mg-–Si alloys, Philos. Mag. (2007) 3385–3413.
- [19] L. Sagalowicz, G. Hug, D. Bechet, P. Sainfort, G. Lapasset, A study of the structural precipitation in the Al-Mg-Si-Cu system, Proceedings of the 4th International Conference on Aluminium Alloys (ICAA4) (1994) 644–651.
- [20] H. Perlitz, A. Westgren, The crystal structure of Al2CuMg, Arkiv Kemi, Min. Geol. 16B (1943) 1–5.
- [21] M. Torsæter, F.J.H. Ehlers, C.D. Marioara, S.J. Andersen, R. Holmestad, Applying precipitate-–host lattice coherency for compositional determination of precipitates in Al-–Mg-–Si-–Cu alloys, Philos. Mag. (2012) 3833–3856.
- [22] C.D. Marioara, J. Nakamura, K. Matsuda, S.J. Andersen, R. Holmestad, T. Sato, T. Kawabata, S. Ikeno, HAADF-STEM study of -type precipitates in an over-aged Al-–Mg-–Si–-Ag alloy, Philos. Mag. (2012) 1149–1158.
- [23] L. Arnberg, B. Aurivillius, The crystal structure of AlxCu2Mg12-xSi7, (h–AlCuMgSi), Acta Chem. Scand. A (1980) 1–5.
- [24] C. Wolverton, Crystal structure and stability of complex precipitate phases in Al–Cu–Mg–(Si) and Al–Zn–Mg alloys, Acta Mater. (2001) 3129–3142.
- [25] C. Ravi, C. Wolverton, First-principles study of crystal structure and stability of Al–-Mg-–Si-–(Cu) precipitates, Acta Mater. (2004) 4213–4227.
- [26] T. Saito, C.D. Marioara, S.J. Andersen, W. Lefebvre, R. Holmestad, Aberration-corrected HAADF-STEM investigations of precipitate structures in Al–Mg–Si alloys with low Cu additions, Philos. Mag. (2014) 520–531.
- [27] D.J. Chakrabarti, D.E. Laughlin, Phase relations and precipitation in Al-–Mg–-Si alloys with Cu additions Prog. Mater. Sci. 49 (2004) 389–410.
- [28] C. Cayron, L. Sagalowicz, O. Beffort, P.A. Buffat, Structural phase transition in Al–Cu–Mg–Si alloys by transmission electron microscopy study on an Al-4 wt% Cu-1 wt% Mg-Ag alloy reinforced by SiC particles, Philos. Mag. 79 (1999) 2833–2851.
- [29] K. Matsuda, Y. Uetani, T. Sato, S. Ikeno, Metastable phases in an Al–Mg–Si alloy containing copper, Metall. Mater. Trans. A 32 (2001) 1293–1299.
- [30] T. Saito, C.D. Marioara, J. Røyset, K. Marthinsen, R. Holmestad, The effects of quench rate and pre–deformation on precipitation hardening in Al-–Mg-–Si alloys with different Cu amounts, Mater. Sci. Eng. A (2014) 72–79.
- [31] T. Saito, S. Muraishi, C.D. Marioara, S.J. Andersen, J. Røyset, R. Holmestad, The Effects of Low Cu Additions and Predeformation on the Precipitation in a 6060 Al-Mg-Si Alloy, Metall. Mater. Trans. A (2013) 4124–4135.
- [32] S.J. Andersen, Quantification of the Mg2Si and phases in AlMgSi alloys by transmission electron microscopy, Metall. Mater. Trans. A 26 (1995) 1931–1937.
- [33] J.K. Sunde, Ø. Paulsen, S. Wenner, R. Holmestad, Precipitate statistics in an Al-Mg-Si-Cu alloy from scanning precession electron diraction data, J. Phys.: Conf. Ser. 902 (2017) 012022.
- [34] P. Moeck, S. Rouvimov, E.F. Rauch, M. Véron, H. Kirmse, I. Häusler, W. Neumann, D. Bultreys, Y. Maniette, S. Nicolopoulos, High spatial resolution semi-automatic crystallite orientation and phase mapping of nanocrystals in transmission electron microscopes, Cryst. Res. Technol. 46 (2011) 589–606.
- [35] J.S. Barnard, D.N. Johnstone, P.A. Midgley, High-resolution scanning precession electron diffraction: alignment and spatial resolution, Ultramicroscopy 174 (2017) 79–88.
- [36] F. de la Peña et al., HyperSpy - 1.3 (2017). DOI: 10.5281/zenodo.583693.
- [37] S. van der Walt, J.L. Schönberger, J. Nunez-Iglesias, F. Boulogne, J.D. Warner, N. Yager, E. Gouillart, T. Yu and the scikit-image contributors. scikit-image: Image processing in Python. PeerJ 2:e453 (2014). DOI: 10.7717/peerj.453.
- [38] D.D. Lee, H.S. Seung, Learning the parts of objects by non-negative matrix factorization, Nature 401 (1999) 788–791.
- [39] A.S. Eggeman, R. Krakow, P.A. Midgley, Scanning precession electron tomography for three-dimensional nanoscale orientation imaging and crystallographic analysis, Nat. Commun. 6 (2015) 7267.
- [40] R. Vincent, P.A. Midgley, Double conical beam-rocking system for measurement of integrated electron-diffraction intensities, Ultramicroscopy 53 (1994) 271–282.
- [41] P.D. Nellist, S.J. Pennycook, The principles and interpretation of annular dark–field Z–contrast imaging. Adv. Imag. Electron Phys. 113 (2000) 148–-203.
- [42] T. Saito, F.J.H. Ehlers, W. Lefebvre, D. Hernandez-Maldonado, R. Bjørge, C.D. Marioara, S.J. Andersen, E.A. Mørtsell, R. Holmestad, Cu atoms suppress misfit dislocations at the /Al interface in Al–Mg–Si alloys, Scr. Mater. 110 (2016) 6–9.
- [43] L. Ding, Z. Jia, J.-F. Nie, Y. Weng, L. Cao, H. Chen, X. Wu, Q. Liu, The structural and compositional evolution of precipitates in Al–Mg–Si–Cu alloy, Acta Mater. 145 (2018) 437–450.
- [44] K. Li, A. Béché, M. Song, G. Sha, X. Lu, K. Zhang, Y. Du, S.P. Ringer, D. Schryvers, Atomistic structure of Cu-containing precipitates in an Al–-Mg-–Si-–Cu alloy, Scr. Mater. 75 (2014) 86–89.
- [45] C.D. Marioara, S.J. Andersen, J. Røyset, O. Reiso, S. Gulbrandsen-Dahl, T.-E. Nicolaisen, I.-E. Opheim, J.F. Helgaker, R. Holmestad, Improving thermal stability in Cu-containing Al-Mg-Si alloys by precipitate optimization, Metall. Mater. Trans. A 45 (2014) 2938–2949.
- [46] Y. Du, Y.A. Chang, B. Huang, W. Gong, Z. Jin, H. Xu, Z. Yuan, Y. Liu, Y. He, F.-Y. Xie, Diffusion coefficients of some solutes in fcc and liquid Al: critical evaluation and correlation, Mater. Sci. Eng. A 363 (2003) 140–151.
- [47] K. Teichmann, C.D. Marioara, S.J. Andersen, K. Marthinsen, TEM study of precipitate interaction mechanisms with dislocations and interfaces with the aluminium matrix in Al-–Mg-–Si alloys, Mater. Charact. 75 (2013) 1–7.
- [48] A.-L. Dons, E.K. Jensen, Y. Langsrud, E. Trømborg, S. Brusethaug, The alstruc microstructure solidification model for industrial aluminum alloys, Metall. Mater. Trans. A 30 (1999) 2135-–2146.
- [49] S. Wenner, L. Jones, C.D. Marioara, R. Holmestad, Atomic–resolution chemical mapping of ordered precipitates in Al alloys using energy–dispersive X–ray spectroscopy, Micron 96 (2017) 103–111.