NICER detects a soft X-ray kilohertz Quasi-periodic Oscillation in 4U 0614+09
Abstract
We report on the detection of a kilohertz quasi-periodic oscillation (QPO) with the Neutron Star Interior Composition Explorer (NICER). Analyzing approximately 165 ks of NICER exposure on the X-ray burster 4U 0614+09, we detect multiple instances of a single-peak upper kHz QPO, with centroid frequencies that range from 400 Hz to 750 Hz. We resolve the kHz QPO as a function of energy, and measure, for the first time, the QPO amplitude below 2 keV. We find the fractional amplitude at 1 keV is on the order of 2% rms, and discuss the implications for the QPO emission process in the context of Comptonization models.
ni
1 Introduction
Kilohertz quasi-periodic oscillations (QPOs, van der Klis et al. 1996; Strohmayer et al. 1996) are the fastest variability signatures observed from accreting neutron star X-ray binaries. Ubiquitous across source types, these QPOs may appear as a single or double (twin) peak in the power spectrum, with centroid frequencies that can move from 200 Hz up to 1200 Hz in correlation with rising X-ray luminosity (van der Klis, 2006).
Given the very short timescale variability they represent, it is clear that kHz QPOs must originate from close to the neutron star surface, and hence they have drawn much attention. Many of the suggested models for kHz QPOs associate either the lower or upper peak with orbital motion at the inner edge of the accretion disk (Miller et al., 1998; Stella & Vietri, 1999; Alpar & Psaltis, 2008; Bachetti et al., 2015). Alternative mechanisms have been proposed also (Kato, 2004; Kluźniak et al., 2004; Zhang, 2004), but so far no single model can account for all of the observed properties of these oscillations.
Both observational and theoretical studies of kHz QPOs have focused on their centroid frequencies, and how these change with respect to system parameters such as luminosity or the neutron star spin frequency. Comparatively little attention has been given to how the emergent X-ray flux is being modulated. The reason for this disparity is clear; frequencies provide a direct handle on the dynamics in the accretion system, whereas the modulation mechanism depends also on uncertainties in interpretations of the spectrum.
A path forward is offered by the joint analysis of both spectral and timing characteristics (Gilfanov et al., 2003; de Avellar et al., 2013; Barret, 2013). Considering the energy dependence of kHz QPO amplitudes and time-lags has the potential to tightly constrain the size and geometry of the modulating medium (e.g., Kumar & Misra, 2016), and thereby, indirectly, also the driving dynamical mechanism. Degeneracies in spectral models, however, remain a limiting factor.
Many spectral models for the emission process of kHz QPOs make indistinguishable predictions for the kHz QPO amplitude at high photon energies. At low photon energies, however, a specific class of spectral models makes a divergent prediction. If the kHz QPO is generated by a coherent oscillation within some property of the Comptonizing medium, such as the temperature or optical depth, then the QPO amplitudes should rise at energies below 2 keV (Lee et al., 2001). In contrast, models that associate the QPO emission process with luminosity variations, for instance from a boundary layer, predict that the QPO amplitude should continue to decrease toward lower energies (see, e.g., Miller et al., 1998). Measurements of kHz QPO properties below 2 keV, however, have so far not been possible due to instrument limitations.
Launched in 2017 June, the Neutron Star Interior Composition Explorer (NICER, Gendreau & Arzoumanian 2017) provides good spectral and timing capabilities combined with large collecting area at 1 keV. In this Letter, we present NICER observations of the neutron star low-mass X-ray binary (LMXB) 4U 0614+09, a low-luminosity burster (Swank et al., 1978) known to show type I X-ray bursts with 415 Hz burst oscillations (Strohmayer et al., 2008) and kHz QPOs (Ford et al., 1997) over a wide range of frequencies (Méndez et al., 1997). Leveraging NICER’s low energy passband, we report on the first measurements of kHz QPOs in soft X-rays.
2 Observations
The NICER X-ray Timing Instrument (XTI, Gendreau et al. 2016) consists of 56 co-aligned X-ray concentrator optics, each paired with a silicon drift detector sensitive in the keV band (Prigozhin et al., 2012). The 52 operating detectors collectively provide an effective area of 1900 cm2 at keV, with an energy resolution of eV.
As part of its main science program, NICER has extensively monitored the low-luminosity X-ray burster 4U 0614+09. In this work, we analyze the data collected during the first three months of this campaign, specifically between 2017 August 15 and 2017 October 30 (ObsID 1050020101 through 1050020131). We processed these data using heasoft version 6.23 and nicerdas version 2018-03-01_V003, using standard filtering criteria: we selected only data collected with a pointing offset less than , more than away from the bright Earth limb, more that away from the dark Earth limb, and outside the South Atlantic Anomaly.
We then constructed a 8-s resolution light curve using the keV energy band. This energy range is higher than the nominal passband of the instrument because the performance of the optics and detectors diminishes such that essentially no astronomical signal is expected above 12 keV. Whenever this light curve had a rate greater than 1 ct/s, we observed a correlated increase in the keV rate. We therefore attributed those epochs to high-background intervals, and removed them from our analysis. About ks of high-background exposure was removed in this way. After filtering we were left with approximately 165 ks worth of good time exposure.
Because NICER does not provide imaging capabilities, we determined the background contribution from NICER observations of the blank-field Rossi X-ray Timing Explorer (RXTE) background region 8 (Jahoda et al., 2006), using the same filtering criteria. Here we note that our source count-rate was much higher than the background rate, such that the analysis does not depend on our choice of background region. After filtering we obtained 74 ks of good time exposure for the background field with an averaged background rate of approximately 0.04 counts/s/det in the keV band.
During these observations, NICER detected a single type I X-ray burst on 7 September 2017 (MJD 58003). We excluded this X-ray burst from our analysis. We used a burst epoch starting 50 seconds prior to the burst onset, and approximately 375 seconds in length, such that it extended to the end of the exposure.

3 Analysis & Results
Classified as an ‘atoll’ type source (Hasinger & van der Klis, 1989), the variability properties of 4U 0614+09 have been well established by (RXTE; see, e.g., van Straaten et al. 2000, 2002). As the source luminosity changes, it moves through a series of accretion states, each with distinct timing and spectral characteristic. The extreme island state (EIS) shows spectrally hard emission and strong low-frequency variability. At higher luminosity the island state (IS) has a softer spectrum and somewhat faster variability. At still higher luminosity the soft emission starts to dominate the spectrum and the source moves into the ‘banana’ branch. This branch is sub-divided into three regions: the lower-left ‘banana’ (LLB), where twin kHz QPOs appear; the lower ‘banana’ (LB), which may have only one kHz QPO at a higher frequency; and the upper ‘banana’ (UB), where kHz QPOs are no longer observed.
The evolution of accretion states is reproduced across many accreting neutron stars (van Straaten et al., 2005; Altamirano et al., 2008; Bult & van der Klis, 2015b), and gives a reliable handle on how to search for kHz QPOs. The accretion state identification for RXTE observations, however, is usually guided by a color ratio centered about 10 keV, which is not readily accessible to NICER. Hence, we first consider a color analysis that is more appropriate to the NICER passband.
3.1 Color analysis
We constructed a light curve for the NICER data using a 1/8192-s time resolution. We then divided this light curve into 128-s segments, and for each segment, computed a soft ( keV / keV) and hard ( keV / keV) color ratio, as well as the averaged count-rate ( keV) in that segment111We point out that the NICER hard color corresponds approximately with the usual RXTE soft color. . We find that our hard color shows little variation with respect to intensity, and provides a poor diagnostic of the system’s accretion state. Our soft color, on the other hand, traces out a pronounced curve as a function of count-rate (Figure 1, see section 3.2 for data grouping).
Over the span of our 74-d light curve the observations of 4U 0614+09 sample approximately ten loops up and down the soft-color-intensity diagram (SID) track, although some loops reverse before the highest count-rates are reached. The stable recurrence pattern of this color evolution suggests that a color ratio centered about 1 keV may be a good diagnostic of the accretion state. In this work we therefore use the SID track as our primary indicator for data grouping.
3.2 Timing analysis
For each 128-s light curve segment in the keV band we computed Fourier transforms, and constructed Leahy-normalized (Leahy et al., 1983) power spectra. We used only events above keV to allow for a clean comparison with results obtained using RXTE (van Straaten et al., 2002), as the low-energy power spectrum can show very different properties (Bult et al., 2018). We then grouped segments based on their SID position and the shape of their low frequency power spectrum. This results in six contiguous data groups along the SID track. We designate these groups alphabetically, from the lowest to highest count-rates, as ‘A’ through ‘F’. The SID and light curve for this data grouping are shown in Figure 1, along with the hardness-intensity diagram.
For each data group A through F we averaged the individual segments to a single power spectrum. Inspecting the Hz frequency range we find, in each case, a mean Leahy power of , as expected for Poisson noise, with no evidence for high frequency signals. Indeed, due to NICER’s modular design, deadtime should not be an issue at the observed count-rates, so we subtract a constant power level of from our spectra. Finally, we renormalized the averaged power spectra in terms of fractional rms amplitude with respect to the total source count rate (van der Klis, 1995).
Comparing the averaged NICER power spectra (Figure 2) with results obtained from RXTE (van Straaten et al., 2002), we can now identify the positions on the SID track with the ‘atoll’ type accretion states. At the lowest count-rates (groups A and B) the source populates the island state. Toward higher count-rates (groups C and D) we observe a transition into the lower-left ‘banana’, and finally, at the higher count-rates (groups E and F), we observe ‘banana’ branch type variability.
We quantify the power spectra by fitting a multi-Lorentzian model (Belloni et al., 2002), with each Lorentzian profile defined as , for a characteristic frequency , quality factor , and centroid frequency . The fractional rms amplitude, , is defined by integrating over the positive frequency domain as
| (1) |
For all six data groups this model provides an adequate description of the power spectrum. Our best-fit results are listed in Table 3.2, and the associated power spectra are shown in Figure 2.
| Frequency | Quality | Fractional | / dof | |||
| factor | amplitude | |||||
| (Hz) | (% rms) | |||||
| group A — ks | ||||||
| break | 1\@alignment@align.6(0 | 0 (fixed) | 11\@alignment@align.6(1 | 143/128 | ||
| hump | 16\@alignment@align.2(2 | 0 (fixed) | 24\@alignment@align.0(1 | |||
| kHz QPO | 458\@alignment@align. (52) | 1.9(1.2) | 19\@alignment@align.0(3 | |||
| group B — ks | ||||||
| break | 0\@alignment@align.9(0 | 0.06 (0.14) | 7\@alignment@align.5 (1 | 195/180 | ||
| break 2 | 4\@alignment@align.0(0 | 0.6 (0.2) | 11\@alignment@align.8 (2 | |||
| hump | 17\@alignment@align.2(1 | 0.41 (0.14) | 18\@alignment@align.5 (1 | |||
| hHz | 222\@alignment@align. (49) | 0.5 (0.3) | 18\@alignment@align.9 (3 | |||
| kHz QPO | 548\@alignment@align. (24) | 2.7 (1.3) | 13\@alignment@align.8 (1 | |||
| group C — ks | ||||||
| break 2 | 0\@alignment@align.71(0 | 0. (fixed) | 4\@alignment@align.3(0 | 137/159 | ||
| break | 4\@alignment@align.7(0 | 0.7 (0.3) | 6\@alignment@align.0(1 | |||
| hump | 21\@alignment@align.0(1 | 0.27(0.19) | 13\@alignment@align.2(1 | |||
| hHz | 117\@alignment@align. (11) | 1.0 (0.5) | 8\@alignment@align.9(1 | |||
| kHz QPO | 637\@alignment@align. (26) | 2.7 (0.9) | 10\@alignment@align.3(1 | |||
| group D — ks | ||||||
| break 2 | 0\@alignment@align.44 (0 | 0. (fixed) | 3\@alignment@align.8(0 | 97/117 | ||
| break | 26\@alignment@align.3 (2 | 0. (fixed) | 15\@alignment@align.9(0 | |||
| hHz | 159\@alignment@align. (36) | 0.8(0.7) | 8\@alignment@align.2(2 | |||
| kHz QPO | 748\@alignment@align. (27) | 4.2(2.0) | 9\@alignment@align.5(1 | |||
| group E — ks | ||||||
| break 2 | 0\@alignment@align.29 (0 | 0. (fixed) | 3\@alignment@align.5(0 | 80/95 | ||
| break | 21\@alignment@align.5 (1 | 2.5 (0.9) | 5\@alignment@align.4(0 | |||
| hHz | 144\@alignment@align. (16) | 1.7 (1.0) | 7\@alignment@align.5(1 | |||
| group F — ks | ||||||
| break 2 | 0\@alignment@align.32 (0 | 0.5(0.2) | 3\@alignment@align.1(0 | 82/95 | ||
| break | 29\@alignment@align.3 (2 | 1.0(0.3) | 7\@alignment@align.7(0 | |||
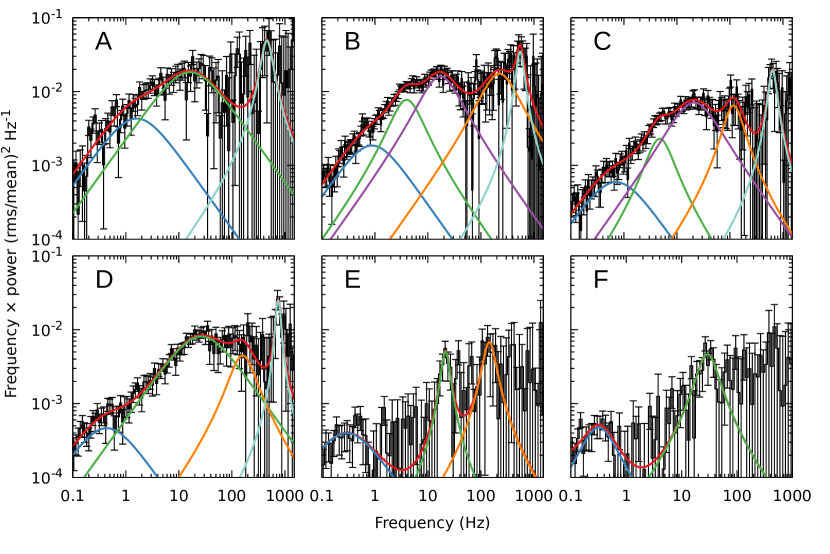
We clearly detect kHz QPOs in groups A through D (). In all cases only a single kHz peak is observed. Based on the morphology of the power spectrum, the quality factors of the QPOs, and the comparison with RXTE results (van Straaten et al., 2002; Altamirano et al., 2008), we can identify this single peak as the ‘upper’ kHz QPO. The measured frequency correlates with count-rate, and moves from Hz in group A to 750 Hz in group D.
No kHz QPOs are detected in groups E and F. Assuming kHz QPO properties similar to those reported for RXTE observations at the highest luminosities for this source, that is and Hz (van Straaten et al., 2002), we obtained a upper limit on a kHz QPO amplitude of rms in either group.
Although interesting in their own right, a full analysis of the broad band power spectrum is beyond the scope of this Letter. Instead we focus our analysis on the energy dependent properties of the kHz QPO.
3.3 Spectral-timing
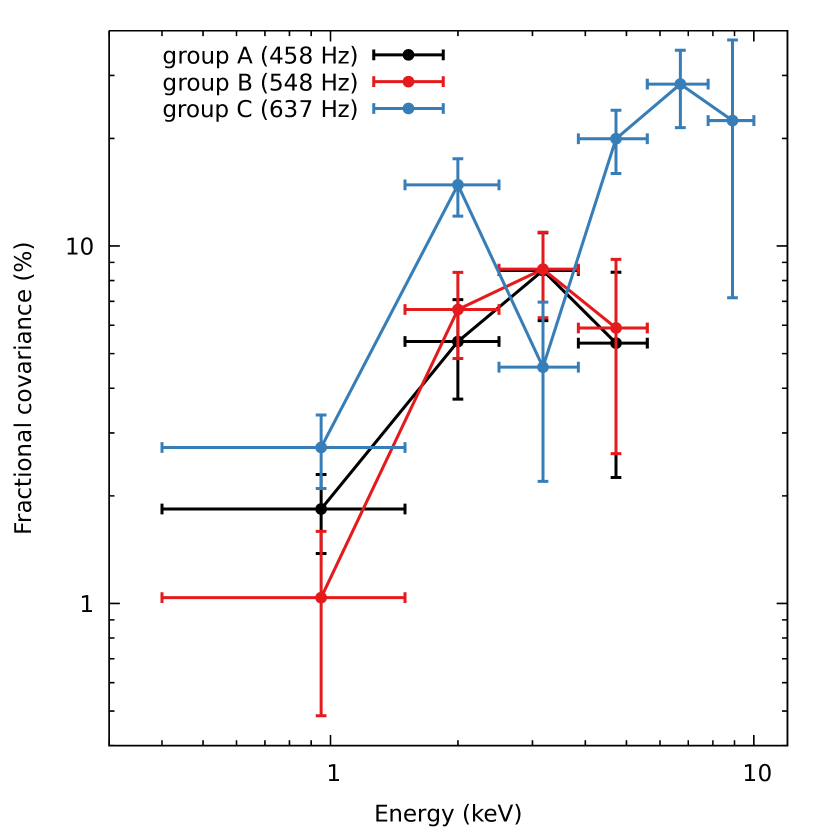
Using the same data grouping described above, we investigated the spectral-timing properties of the kHz QPO by computing time-lags and fractional covariance as a function of energy. We calculated these measures by cross-correlating a narrow ( keV) energy band with a broad keV reference band, where we excluded the band of interest from the reference band (Uttley et al., 2014). For each data group we then integrated the cross spectra over frequency intervals the size of the QPO full-width-at-half-maximum, , centered on the measured kHz QPO centroid frequency.
The energy dependent time-lags are statistically consistent with zero, with uncertainties on the order of 50 s.
The energy dependence of the fractional covariance is shown in Figure 3. For data groups A through C, we found that the fractional covariance generally increases as a function of energy. For data group D, the kHz QPO amplitude was too low to meaningfully constrain the covariance. The increasing trend in amplitude shows some variations, and appears to flatten off, and even turn over above 4 keV. We warn, however, that the these changes in amplitude are all smaller than the measurement uncertainty. Hence, a larger dataset will be needed to determine if such variations are real or merely statistical fluctuations.
Most notably, we detected the kHz QPO in the lowest energy band, which we defined between 0.4 and 1.5 keV, with a fractional covariance of rms in group A () and at rms in group C (). At a level, the group B measurement is not formally significant. We also attempted to perform our measurement at a narrower energy resolution by splitting the keV bin into two equal parts. However, the kHz QPO was not significantly detected in either sub-bin, with upper limits of rms.
4 Discussion
We analyzed NICER observations of the low-luminosity burster 4U 0614+09, and detected, for the first time, a kHz QPO at photon energies below 2 keV. We argued that this feature corresponds to the upper-frequency component of the kHz QPO pair previously identified in RXTE observations of accreting neutron stars. We found that the kHz QPO amplitude decreases rapidly toward low photon energies, with a fractional covariance of approximately rms around 1 keV. Above 2 keV we observed increasing fractional covariance consistent with previous findings for the upper kHz QPO (de Avellar et al., 2013) and with 4U 0614+09 in particular (Troyer et al., 2018). The measured time lags are consistent with zero, again in accordance with other work (de Avellar et al., 2013).
We only detected the upper kHz QPO, and only in the island state and the lower-left portion of the ‘banana’ branch of the atoll-type classification. We did not detect kHz QPOs in groups E and F, with an upper limit on the QPO amplitudes of . Compared to the results of RXTE observations, our upper limits are similar to reported amplitudes (van Straaten et al., 2002), hence we cannot rule out the possibility that a narrow kHz QPO is present at the highest source luminosities observed with NICER.
We further note that our data groups cover a large timespan, and are potentially susceptible to an observational bias. In particular, the combination of NICER’s soft passband and diminishing QPO amplitudes toward lower energies oblige us to average a large number of observations over week-long intervals to detect the kHz QPO above the noise level. It is well known that, on such timescales, secular evolution of the accretion system causes the QPO to appear at different frequencies for the same luminosity, giving rise to parallel tracks in flux versus frequency diagrams (Méndez et al., 1999). In averaging many segments, this frequency drift causes the QPO to be smeared out, making it more difficult to detect. This effect is particularly pronounced for narrow QPOs, for which the frequency drift may be larger than the QPO width. Due to our sampling, this NICER dataset is therefore more sensitive to the broader kHz QPOs of the island state than it is to the narrow kHz QPOs of the lower ‘banana’ branch.
Our measurements provide a strong challenge to models that associate the kHz QPO with a coherent oscillation of the coronal properties, such as temperature or optical depth (Lee et al., 2001). Any such model predicts that there is a pivot energy, , above and below which the QPO amplitude increases. The can be anywhere between and keV, with the temperature, optical depth, and geometry of the Comptonizing medium setting the specific value (see, e.g. Miller & Lamb, 1992; Lee & Miller, 1998; Kumar & Misra, 2014). Hence, at the lowest energies, the QPO amplitude should have turned over and begun increasing. In contrast to this prediction, we do not observe any such turnover in QPO amplitude.
In principle it is possible that the spectrum of the kHz QPO pivots within the boundaries of our lowest energy bin. In this scenario the QPO phase above and below the pivot energy would be apart, leading to artificial deconstructive interference in our measurement. To test this possibility we have split the lowest energy bin of group C in two equal parts, and computed the fractional covariance in each. If the QPO indeed pivots, then one would expect either or both of these sub-bins to show an increase in amplitude. Contrary to this prediction, we do not detect the QPO at a significant level in either sub-bin, with upper limits of fractional covariance.
A possible way of reconciling the Comptonization model with our measurements comes from allowing a feedback between the Comptonizing medium and the thermal component that provides the seed photons (Kumar & Misra, 2014, 2016). If a large fraction of the hard photons impinge back on and raise the temperature of the soft photon source, then the emergent spectrum no longer shows a low energy pivot. Under these conditions, however, the QPO amplitudes would continuously increase toward high energies ( keV), which conflicts with observational evidence that shows a flattening of the amplitude instead (Berger et al., 1996; Peille et al., 2015).
In summary, we have detected the upper kHz QPO below 2 keV, and we see no evidence for a low-energy pivot in QPO amplitude. This detection poses a challenge to models relying on coherent oscillations of coronal properties to explain the radiative process responsible for the QPO. Instead, the current body of evidence favors an upper kHz QPO associated with an azimuthal oscillation, at the inner edge of the disk (Bult & van der Klis, 2015a), that modulates the luminosity of a boundary layer (Gilfanov et al., 2003; Peille et al., 2015; Troyer & Cackett, 2017).
References
- Alpar & Psaltis (2008) Alpar, M. A., & Psaltis, D. 2008, MNRAS, 391, 1472
- Altamirano et al. (2008) Altamirano, D., van der Klis, M., Méndez, M., et al. 2008, ApJ, 685, 436
- Bachetti et al. (2015) Bachetti, M., Harrison, F. A., Cook, R., et al. 2015, ApJ, 800, 109
- Barret (2013) Barret, D. 2013, ApJ, 770, 9
- Belloni et al. (2002) Belloni, T., Psaltis, D., & van der Klis, M. 2002, ApJ, 572, 392
- Berger et al. (1996) Berger, M., van der Klis, M., van Paradijs, J., et al. 1996, ApJ, 469, L13
- Bult & van der Klis (2015a) Bult, P., & van der Klis, M. 2015a, ApJ, 798, L29
- Bult & van der Klis (2015b) Bult, P., & van der Klis, M. 2015b, ApJ, 806, 90
- Bult et al. (2018) Bult, P., Arzoumanian, Z., Cackett, E. M., et al. 2018, ApJ, 859, L1
- de Avellar et al. (2013) de Avellar, M. G. B., Méndez, M., Sanna, A., & Horvath, J. E. 2013, MNRAS, 433, 3453
- Ford et al. (1997) Ford, E., Kaaret, P., Tavani, M., et al. 1997, ApJ, 475, L123
- Gendreau & Arzoumanian (2017) Gendreau, K., & Arzoumanian, Z. 2017, Nature Astronomy , 1, 895
- Gendreau et al. (2016) Gendreau, K. C., et al. 2016, in Proc. SPIE, Vol. 9905, Space Telescopes and Instrumentation 2016: Ultraviolet to Gamma Ray, 99051H
- Gilfanov et al. (2003) Gilfanov, M., Revnivtsev, M., & Molkov, S. 2003, A&A, 410, 217
- Hasinger & van der Klis (1989) Hasinger, G., & van der Klis, M. 1989, A&A, 225, 79
- Jahoda et al. (2006) Jahoda, K., Markwardt, C. B., Radeva, Y., et al. 2006, ApJS, 163, 401
- Kato (2004) Kato, S. 2004, PASJ, 56, 559
- Kluźniak et al. (2004) Kluźniak, W., Abramowicz, M. A., Kato, S., Lee, W. H., & Stergioulas, N. 2004, ApJ, 603, L89
- Kumar & Misra (2014) Kumar, N., & Misra, R. 2014, MNRAS, 445, 2818
- Kumar & Misra (2016) Kumar, N., & Misra, R. 2016, MNRAS, 461, 2580
- Leahy et al. (1983) Leahy, D. A., Elsner, R. F., & Weisskopf, M. C. 1983, ApJ, 272, 256
- Lee & Miller (1998) Lee, H. C., & Miller, G. S. 1998, MNRAS, 299, 479
- Lee et al. (2001) Lee, H. C., Misra, R., & Taam, R. E. 2001, ApJ, 549, L229
- Méndez et al. (1999) Méndez, M., van der Klis, M., Ford, E. C., Wijnands, R., & van Paradijs, J. 1999, ApJ, 511, L49
- Méndez et al. (1997) Méndez, M., van der Klis, M., van Paradijs, J., et al. 1997, ApJ, 485, L37
- Miller & Lamb (1992) Miller, G. S., & Lamb, F. K. 1992, ApJ, 388, 541
- Miller et al. (1998) Miller, M. C., Lamb, F. K., & Psaltis, D. 1998, ApJ, 508, 791
- Peille et al. (2015) Peille, P., Barret, D., & Uttley, P. 2015, ApJ, 811, 109
- Prigozhin et al. (2012) Prigozhin, G., Gendreau, K., Foster, R., et al. 2012, in Proc. SPIE, Vol. 8453, High Energy, Optical, and Infrared Detectors for Astronomy V, 845318
- Stella & Vietri (1999) Stella, L., & Vietri, M. 1999, Physical Review Letters , 82, 17
- Strohmayer et al. (2008) Strohmayer, T. E., Markwardt, C. B., & Kuulkers, E. 2008, ApJ, 672, L37
- Strohmayer et al. (1996) Strohmayer, T. E., Zhang, W., Swank, J. H., et al. 1996, ApJ, 469, L9
- Swank et al. (1978) Swank, J. H., Boldt, E. A., Holt, S. S., Serlemitsos, P. J., & Becker, R. H. 1978, MNRAS, 182, 349
- Troyer et al. (2018) Troyer, J., Cackett, E., Peille, P., & Barret, D. 2018, ApJ, in press , arXiv:1805.05234 [astro-ph.HE], ads
- Troyer & Cackett (2017) Troyer, J. S., & Cackett, E. M. 2017, ApJ, 834, 131
- Uttley et al. (2014) Uttley, P., Cackett, E. M., Fabian, A. C., Kara, E., & Wilkins, D. R. 2014, A&A Rev., 22, 72
- van der Klis (1995) van der Klis, M. 1995, in NATO ASI series, Vol. 450, The Lives of the Neutron Stars, ed. M. A. Alpar, U. Kiziloglu, & J. van Paradijs (Dordrecht: Kluwer), 301
- van der Klis (2006) van der Klis, M. 2006, in Compact stellar X-ray sources, ed. W. H. G. Lewin & M. van der Klis (Cambridge: Cambridge University Press), 39–112
- van der Klis et al. (1996) van der Klis, M., Swank, J. H., Zhang, W., et al. 1996, ApJ, 469, L1
- van Straaten et al. (2000) van Straaten, S., Ford, E. C., van der Klis, M., Méndez, M., & Kaaret, P. 2000, ApJ, 540, 1049
- van Straaten et al. (2002) van Straaten, S., van der Klis, M., di Salvo, T., & Belloni, T. 2002, ApJ, 568, 912
- van Straaten et al. (2005) van Straaten, S., van der Klis, M., & Wijnands, R. 2005, ApJ, 619, 455
- Zhang (2004) Zhang, C. 2004, A&A, 423, 401