Detecting Data Leakage from Databases
on Android Apps with Concept Drift
Abstract
Mobile databases are the statutory backbones of many applications on smartphones, and they store a lot of sensitive information. However, vulnerabilities in the operating system or the app logic can lead to sensitive data leakage by giving the adversaries unauthorized access to the app’s database. In this paper, we study such vulnerabilities to define a threat model, and we propose an OS-version independent protection mechanism that app developers can utilize to detect such attacks. To do so, we model the user behavior with the database query workload created by the original apps. Here, we model the drift in behavior by comparing probability distributions of the query workload features over time. We then use this model to determine if the app behavior drift is anomalous. We evaluate our framework on real-world workloads of three different popular Android apps, and we show that our system was able to detect more than 90% of such attacks.
I Introduction
Google Android OS usage has grown substantially over the past years and reached 85% of the market share in smartphones by the first quarter of 2017 [1]. Unlike its competitors, Android OS is open source, and used by many hardware vendors on their smartphones. However, this flexibility comes with the cost of hardware interface (a.k.a. firmware) development by the vendors. This results in some smartphone models getting out-of-date, and not supported by the new versions of the Android OS, hence, not being able to get the latest security updates. Based on this limitation, application (app) developers may need to employ their own defense mechanisms if their apps get affected by vulnerabilities. Apps can release new versions for each Android version even though the OS support is terminated.
On smartphones, both the operating system and the apps contain a lot of sensitive information that is subject to various threats [2, 3, 4, 5]. Some of these threats exploit vulnerabilities in the OS, or take advantage of the flexible app development capabilities of Android which expose the access credentials of databases dedicated to the apps. Our solution targets apps that store sensitive information in their databases, and it is based on monitoring database access activity of the users [6]. This approach provides a flexible solution that can be employed by the apps themselves, the database system, or the operating system. It enables monitoring unusual activity, and take action against potential threats. The advantage is to be able to observe all, including permissible, activity. Since a smartphone is essentially designed to be a personal device, the underlying database is designed to be owned and used only by the app. Android database security features are designed to prevent all other users except the app itself to use the database.
We can employ the monitoring mechanism to depend on detecting anomalies in the app’s database usage. The basic pathway for a common monitoring mechanism is to: (1) extract relevant features that reflect the user behavior, (2) cluster similar actions, and (3) find outlier actions, which appear to be a very effective approach [7]. However, attacks exploiting vulnerabilities can use the app’s query generator to create queries, which would result in issuing the same query templates to the database, therefore, these queries cannot be considered as outliers with this method. Furthermore, smartphone apps can change over time with small modifications such as updates, and force the users to accomplish the same task in a different way [8]. Also, the users can get more proficient with the use of app in time, or their interests can shift over time. Both of these cases would require the deployed security mechanisms to adapt to the change.
Scenario. Let us consider a photographer (let’s call him Jason) using Instagram profile as a portfolio. During the first month of the account opening, he aggressively posts his existing photographs, and builds a portfolio. He then uses the Instagram profile to answer the questions, and communicate with the potential customers. A few weeks later, Instagram introduces a new feature called “Story”, which enables users to post short videos and pictures that disappear automatically after 24 hours. Considering taking quality photographs that attract customers takes time and energy, he less frequently posts photos, and he starts to post stories while on the job, to keep the interest of his followers.
Jason’s activity results in Instagram web services to query the database in three different areas of the database: (1) Permanent photo storage, (2) Messaging storage, and (3) Story storage. However, in the first month, his activity constitutes mostly inserting to the permanent photo storage, and increasing read and write access to the messaging storage. After that time period, the queries generated for his activity target mostly inserting to and deleting from the story storage while maintaining a similar workload on messaging, and less frequently generating insert queries to the permanent photo storage. Although both of these behavior shifts are expected, the shifts from normal profile activity can be identified as an outlier if the monitoring system is not designed to adapt to the changes, resulting in increased false positives.
A work-around for this problem could be re-training with more recent data when the system starts to return false positives. However, an adaptive system can tolerate this change, therefore, reduce false positives, and eliminate the need for retraining. We observe that various experiments reported in the literature do not consider the changes that happen over time, and the synthetic datasets used for the experiments do not reflect any behavior changes.
In this paper, we bridge this gap by constructing a user behavior model which explicitly models temporal behavior drift. We focus on detecting data breaches against an app’s database to scope down the problem. In our experiments, we utilize real-world query logs of three different apps to understand the behavior drift, and validate the effectiveness of our proposed system.
To identify the behavior drift, and determine if there is a possible data leakage in a user’s workload, we define four basic steps. We first observe and process every SQL query issued to the DBMS. We extract the relevant features of the query considering which part of the database the user is accessing with that particular query. Second, we construct user profiles by accumulating the extracted features for each user for a given period of time. The distribution of the features harvested from these queries constitutes a user profile. Third, we identify the constant drift in behavior by observing the changes in the distribution of features the users utilize. Lastly, we analyze the behavior change, and determine outliers by detecting drastic changes in the drift. Namely, we consider the temporal behavior drift of each user to set an adaptive threshold.
In summary, the contributions of this paper are: (1) Building a threat model that leads to sensitive data leakage from smartphones, (2) Introducing behavioral drift in user activity, and (3) Providing a defense strategy against the modeled threat. Additionally, to the best of our knowledge, our work is the first study that uses a large real–world SQL query trace to validate the results.
This paper is organized as follows. we start by introducing our system Query Workload Auditor (QWA) and the threat model it addresses in Section II. We then explain the techniques that we use to create user profiles in Section III. Section IV presents the experiments performed to show the effectiveness of the system, and we discuss the shortcomings and potential improvements over the proposed system in Section VI. We present the related work in Section V and discuss our work in Section VI. Finally, we conclude and discuss our plans to improve our system in Section VII.
II QWA
Query Workload Auditor (QWA) aims to provide a fix to the vulnerabilities that can lead to data leakage from the app’s database, using the data access patterns of each specific app. In this section, we first discuss recent vulnerabilities that can cause the described threat in Section II-A, the threat model we address in Section II-B, and the architecture of the described system in Section II-C.
II-A Vulnerabilities
There are a number of vulnerabilities in the Android OS reported in the literature, most of which are fixed [9, 10]. In this paper, we focus on recent vulnerabilities reported which can allow attackers to steal sensitive information from the app’s database.
Janus Vulnerability. Android Application Package (APK) file format is used to distribute Android apps. It is essentially a compressed ZIP file that is structured to be recognized as an app distribution package by Android OS. Dalvik Executable (DEX) files, on the other hand, are binary files, and they contain the compiled code. An APK file includes compiled program classes in DEX format.
A vulnerability called Janus in some certain versions of the Android OS allows attackers to create a modified APK file from a legitimate APK and a malicious DEX file without changing the app signature as shown in Figure 1. The modified APK file is then recognized as a legitimate app, and can be installed to the device.
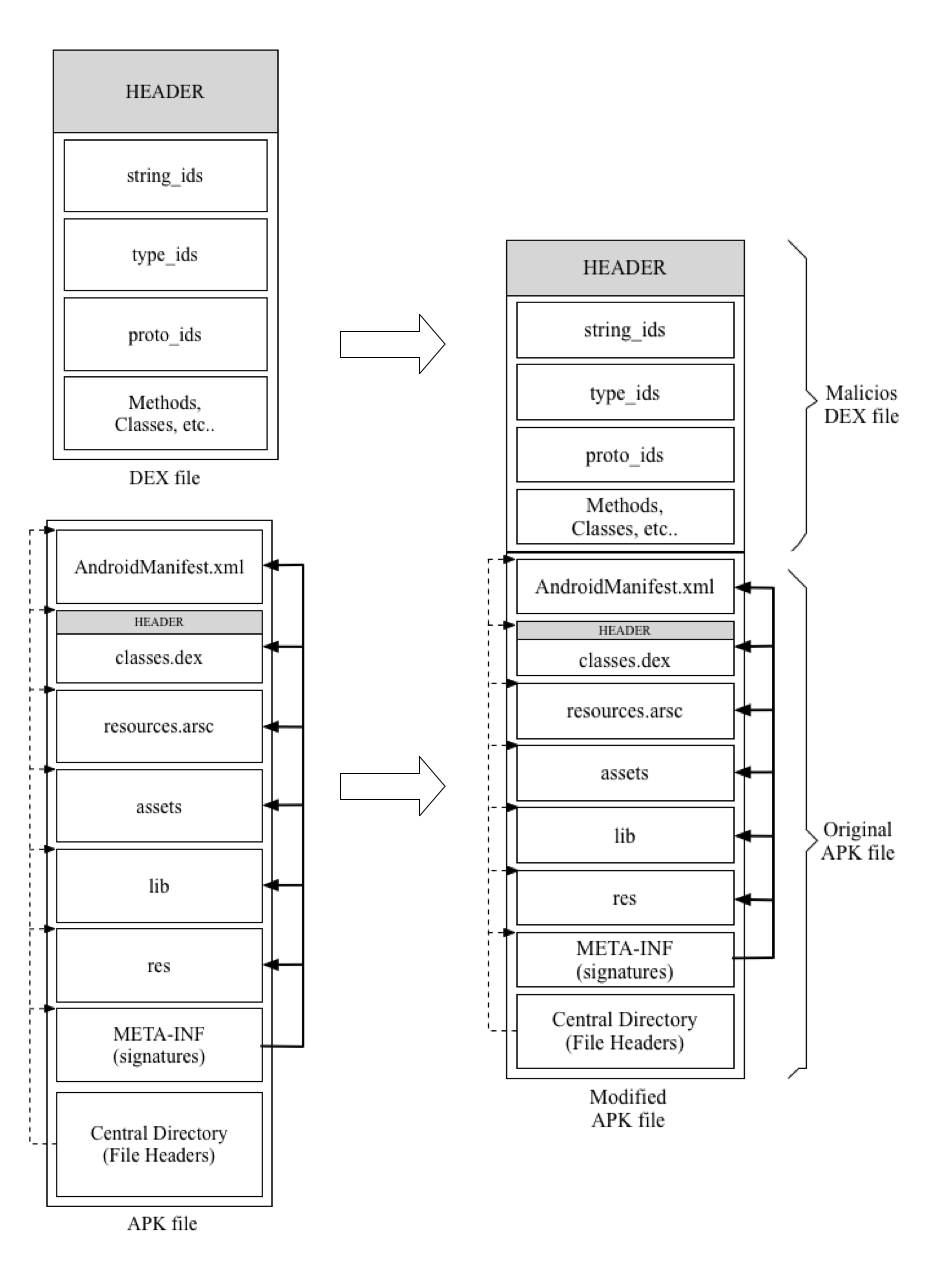
This vulnerability affects apps running on devices with Android 5.0 to Android 7.0 and signed with APK signature scheme v1 [11]. A security firm reported the issue, and Google released a patch in November 2017 to prevent this vulnerability to affect new devices that have Android 7.0 and newer OS. However, older devices and apps that have not been signed with APK signature scheme v2 still remain at risk.
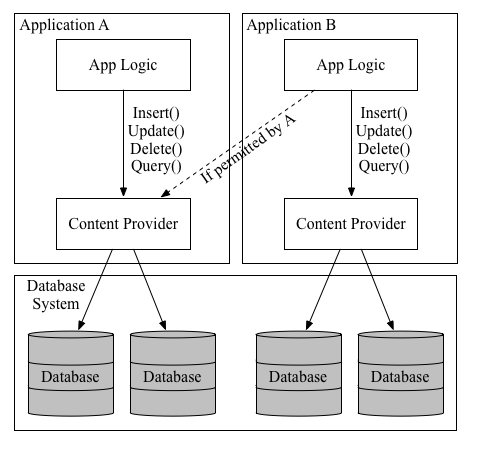
Database Vulnerabilities. Android databases are usually controlled by content providers. They are configured in AndroidManifest.xml which is a configuration file and is present in every app. Generally, the database of each app is private and do not allow access from other apps. However, it is possible to configure the content provider to permit other apps to query the database as seen in Figure 2. It is also possible to access databases through calling database instance directly from within the app. In this case, the database is definitely unique to the app, and the database cannot be shared with other apps.
A simple configuration error such as unintentionally setting exported=true can open up the content provider to the use of other apps and service requests. ContentScope [12] reports that out of 62,519 apps they have surveyed, 2,150 apps had their content providers exposed. Of course, it is possible for some apps to allow access to their content providers. However, it is also possible that the app developers used an example code they found on a website like stackoverflow.com. DBDroidScanner [3] identifies further vulnerabilities in the content providers, and alternative ways of creating SQLite databases within apps. Furthermore, some of the apps keep data stored in the database in plain text, and subject to synchronization manipulation [13].
Attack vector. One of the threats Janus vulnerability poses is embedding a DEX file that accesses the app database that contains sensitive information. If the injected code does not change any other function, and just focuses on stealing data, the app will still function normally, and the users will not be aware of their information being stolen. However, it is also possible for the injected code to tamper with the database contents, hence affecting what the user does and sees, and changing the app behavior.
The content provider and SQLite interfaces provide access to the database, and makes it possible for the attackers to issue raw SQL queries to the app’s database. Again, since the app itself is benign, and has not been changed, it is possible for any user to be subject to these attacks.
II-B Threat Model
Janus is a vulnerability that originates from how Android validates if an APK file is legitimate. It injects malicious code into the app by adding binary code to the original file. The malicious code runs alongside the app, where it can perform a number of activities such as accessing the database to steal information. Janus is not the first vulnerability that had similar repercussions – HTML5-based apps had been a target for code injection attacks [14] along with other web-to-app attacks [15]. Content provider vulnerabilities, on the other hand, expose directly the data access layer of an app to the attackers, and the DBDroidScanner [3] reports that the number of vulnerabilities and vulnerable apps are growing.
Our system aims to detect attacks that originate from known and unknown vulnerabilities that expose the sensitive information in the database to attackers. We target attacks that query the database to glean sensitive information, and tamper database records as a result of vulnerability types presented above. These attacks can behave and affect the workload in three different ways:
Copycat attack model. The workload created by the app stays unaffected, the malicious code creates an additional workload with its own query generation strategy.
Free-styler attack model. The workload created by the app stays unaffected, the malicious code creates an additional workload with the app’s query generation strategy.
Translator attack model. The workload created by the app gets affected by malicious code through the overridden classes and information flow changes. This model can be subdivided into two categories: (1) The malicious code modifies the query generation strategy to easily extract information required by the attackers, and (2) The malicious code modifies the information flow which results in the app generating legitimate queries for actions that do not require them.
II-C Architecture
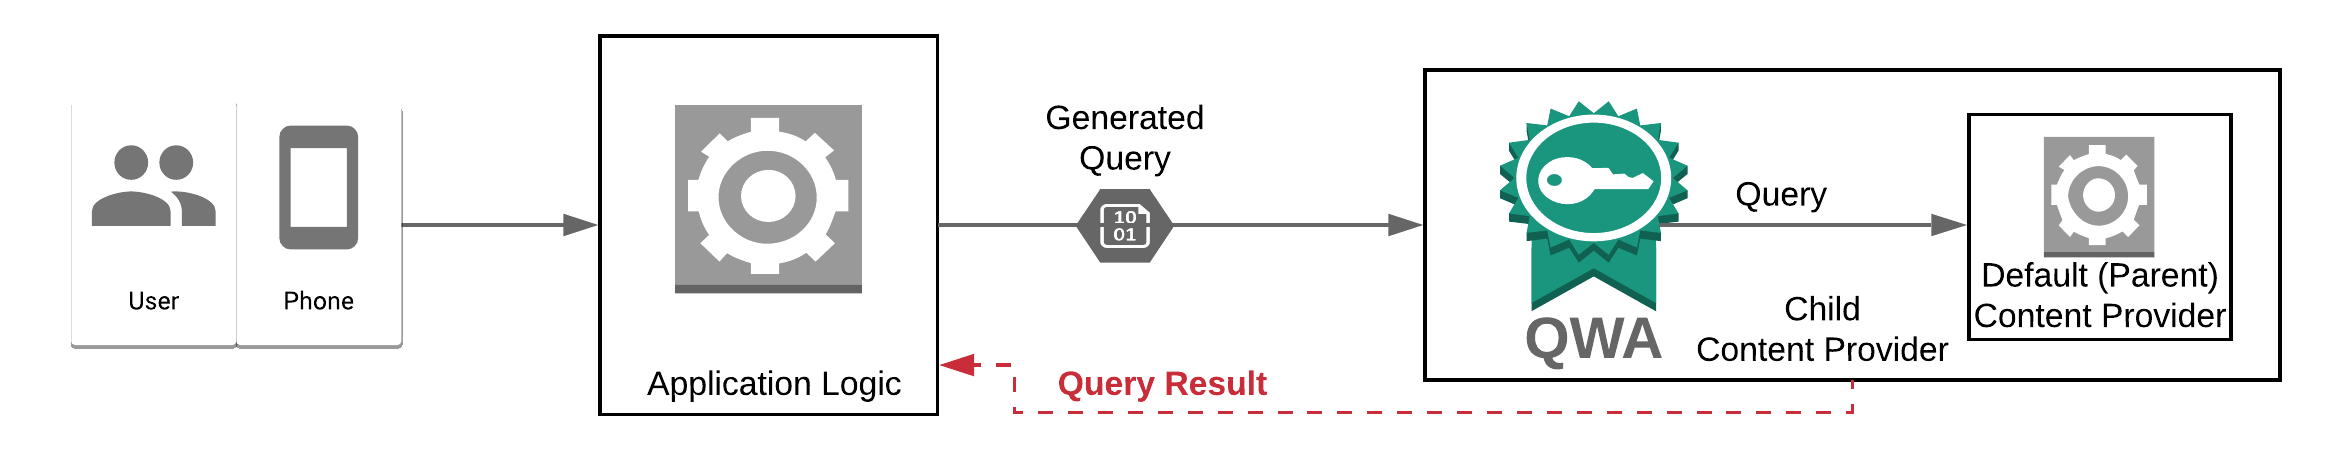
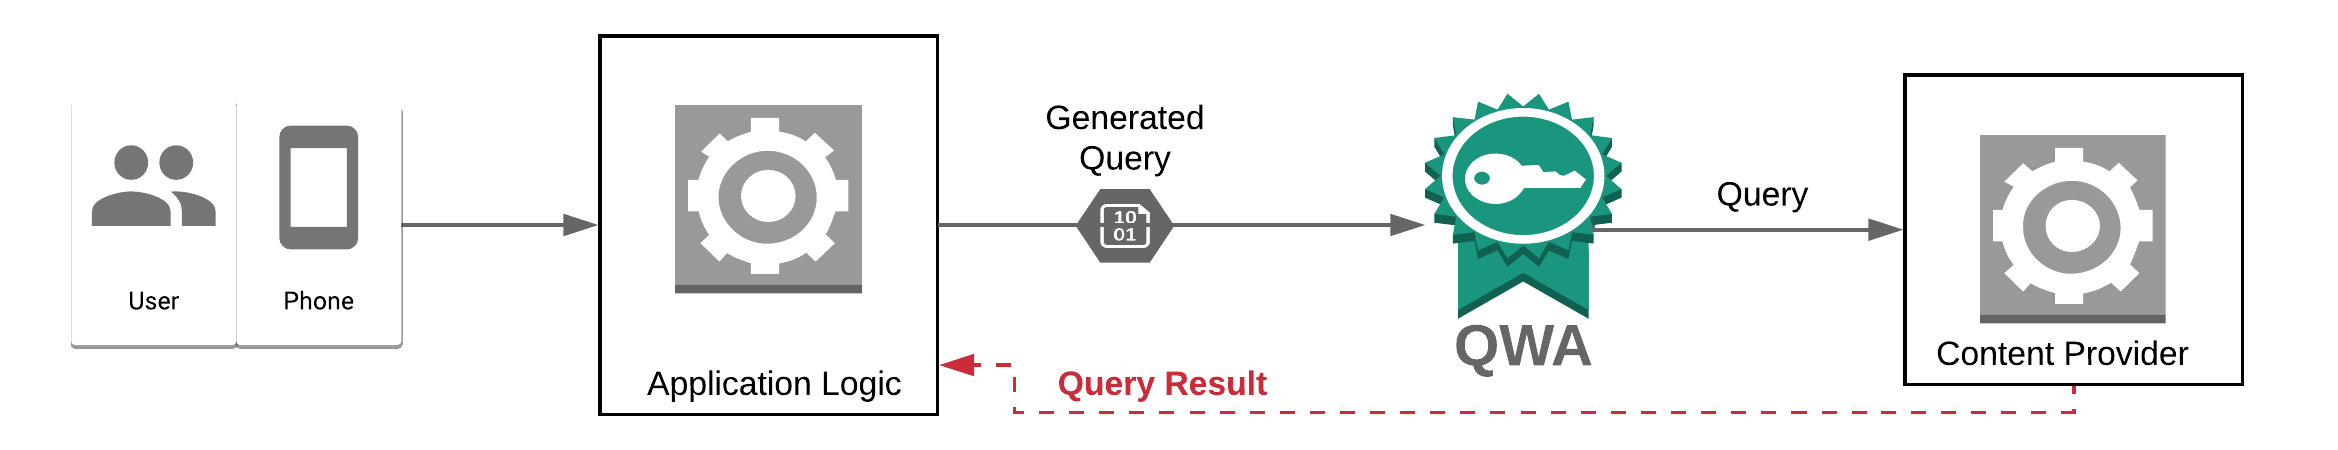
QWA is designed to be modular and flexible, in order to be able to integrate with the other OS security features, apps and various databases. If it is implemented in the OS layer as an extension to the default ContentProvider as shown in Figure 3(a), after it is active and running, any app that interacts with the database can be monitored. Also, it can be integrated into any app just to observe the query traffic so that it does not bring timing overhead to the query processing. If it is integrated between the application logic and the ContentProvider as shown in Figure 3(b), it acts as a mediator between the app and the ContentProvider. It is also possible to extend the ContentProvider within the app by inheriting the ContentProvider class, and overriding its methods.
When a user uses an app on their device through the app graphical user interface (GUI), the app generates queries, and issues them to the database. The database is contained in a database server instance running on the device. QWA just observes the queries that are issued to the database, and it does not block or change the queries. Any query that is issued to the database is captured by the QWA, processed, and logged there, and then sent to the database. Although QWA does not block any queries, it detects suspicious activity, and reports them. The overview of the system architecture is depicted in Figure 3 where QWA acts as the observer in the system.
III Methodology
In this section, we describe our user behavior modeling methodology, and the anomaly detection strategy.
III-A SQL Query Feature Extraction
A relational database is a set of relations (i.e., tables), and a relation is a bag of tuples (i.e., rows) where a tuple is a structured data item. The structure is defined with attributes (i.e., columns) and the types of the attributes.
Structured Query Language (SQL) is a declarative language that is designed for managing, manipulating, and retrieving from relational databases. Other than schema manipulation and data access control operations, SQL queries mainly perform 4 different operations: (1) insert, (2) update, (3) delete, and (4) select. The basic structure of these operations are given respectively:
(1) INSERT INTO table (column1, column2, ...)
               VALUES (value1, value2, ...);
(2) UPDATE table
    SET column1 = integer|decimal|string|...
    WHERE column2 = integer|decimal|string|...
(3) DELETE FROM table
    WHERE column1 = integer|decimal|string|...
(4) SELECT [aggregation] column1, column2, ...
    FROM table1, table2
    [WHERE table1.column1 = table2.column3]
    [ORDER BY column1] [GROUP BY column1]
    [LIMIT integer]
where the brackets show optional query items. As can be implied from these basic structures, queries that perform similar tasks usually have analogous structures, or at least share some attributes. SQL query statements are constructed from clauses. Every line of the query structures given above constitutes a clause. As an example let’s take the following query which reads as “Show the names and number of games played for each player who is over 30”:
(1) SELECT p.name, COUNT(g.played)
(2) FROM player p, game g
(3) WHERE p.id = g.playerid AND p.age > 30
(4) GROUP BY u.name
(5) ORDER BY u.name
Line 1 consists of the SELECT keyword, and the projection items. Line 2 has the FROM clause which lists the tables the query is going to use. Line 3 is named the WHERE clause. WHERE clause contains selection and join expressions. p.id = g.playerid expression is a join expression, and p.age > 30 is a selection expression. Line 4 and 5 include the group-by and order-by items, respectively.
Query interpretation, namely, understanding the goal of the query, is regarded as hard as creating a new query, and even more so for complex queries [16]. Furthermore, complex queries are not uncommon due to the expressive nature of the SQL. The databases are designed and optimized for performance and correctness, which requires simple relations. Hence, the queries need to be designed more complex with high numbers of table joins as the need increases to access complex information. There is a line of research that aims to capture user intention through queries since it would contribute to security applications [17], automated personalized query generation [18], and interest mining [19]. To accomplish this, it is essential to identify the required features to be extracted from the SQL queries. As mentioned before, the data stored in the database can also be a good indicator for measuring the similarity of the queries [20]. For instance, consider the following query:
Ψ(1) SELECT * FROM contact
Ψ    WHERE name LIKE "A%"
Ψ(2) SELECT * FROM contact
The first query reads as “list all contacts whose names start with A”, and the second query reads as “list everything on contact table”. However, if this query runs on a table where there is only one contact whose name is Alice. Thus, SQL queries are also open to varying interpretations. Consequently, it is crucial to have a SQL query extraction strategy according to why these features are required. For instance, query recommendation requires analysis of feature correlation and dependency [18], while performance optimization requires discovery of table joins [21].
As discussed before, we observe and process every SQL query issued to the DBMS. We extract the relevant features of the query considering which part of the database the user is accessing with that particular query. In our previos work [22], we investigated the query clustering quality of several query feature extraction methods. Our work follows the basic principles of the two most commonly used SQL query feature extraction methods [21, 23].
Aligon et al. [21] survey on comparing OLAP sessions considering the query similarity, and session similarity. They classify selection and join attributes as the most relevant component in a query followed by the group-by attributes. With the light of the findings, they propose their own SQL query extraction schema which considers projection, group-by, selection and join attributes for queries issued on OLAP datacubes. Makiyama et al. [23] focus on workload exploration on large query logs. They extract the attributes in selection, join, projection, from, group-by and order-by items separately, and record their appearance frequency. We approach query feature extraction with the goal of understanding which part of the database the query writer is interested in. We extract the terms in selection, joins, projection, group-by, and order-by items along with constants and parameters in the query separately, and record their appearance frequency.
III-B Normal Behavior
Users access information on the database through interacting with the app. The app generates queries based on the activities performed, and retrieve data from the database with these queries.
Building user profiles through clustering, and other machine learning techniques has been studied extensively in the literature before [7, 20, 24]. However, this approach is not suitable to make the user profiles adapt to the behavior changes, or to allow the anomaly detection strategy to consider a possible behavior shift. They usually take a snapshot of all the activity at a certain time, and create a model based on the information available at that point of time without even considering the activity time. Since the query set is clustered with an uncertain number of labels, it is required to compute a pairwise distance matrix between queries to perform a clustering with hierarchical clustering or a similar clustering method. This operation has quadratic complexity [25], and is required to be performed over the whole set of queries. When the model starts to perform worse, the re-training of the model requires the same operation to be repeated.
We focus on observing behavior in individual profiles to show the importance of behavior drift. For each user, we define a user profile for a given timeframe , denoted as the vector , where is the total number of features extracted using the methodology given in Section III-A. To compute , we consider all queries issues by the user to the database within the timeframe . A query issued at time , is a length vector of counts, and is denoted as , where the element, , is equal to the number of times the feature is observed in the corresponding query.
Note that the feature extraction from a query is an time complexity operation where is a relatively small number, compared to the number of queries.
By combining the feature counts across all queries issued by the user in a given timeframe, one can compute the entries in the user profile vector, , as follows:
| (1) |
The user profiles are created with the accumulation of these features for a given period of time. Using the appearance frequency of these features, we calculate the appearance probability of each harvested feature. One can also consider the user profile for timeframe , as a multinomial random variable, which can take one out of possible values, with probability distribution parameterized by .
Given that the features are stored in a map structure, the features of a new query can be simply added to the feature counters which are used to compute the probability of a feature. Hence, this operation has only time complexity.
Logically, we expect the preprogrammed queries to be more consistent between each other, while handwritten queries to form a more diverse distribution. For instance, DBAs and data analysts access a variety of data as required by their jobs. However, apps generate queries based on the data access layer’s query generation strategy with parameters provided by the methods that use the data access layer. Sometimes, queries can even be hardcoded into the app source code. Therefore, query diversity is expected to be lower than handwritten queries. As a result, we define this expected change in behavior with the term profile drift.
Comparison of the accumulated user profile, for timespan , with the new incoming behavior observed for timespan , using Kullback–Leibler Divergence [26] gives the drift score denoted as follows:
| (2) |
KL-Divergence (i.e., relative entropy) is used for comparing two probability distributions, and ; and it ranges between 0 and . essentially represents the information loss when distribution is used to approximate .
Note that when and , . For example, suppose, we have two distributions and as follows: and . In this case, since is not a part of , the result would be , which means these two distributions are completely different.
Smoothing. To get past this problem, we can apply smoothing (i.e., Laplace/additive smoothing), which is essentially adding a small constant to the distribution, to handle zero values, without significantly impacting the distribution. After we apply smoothing, becomes .
The intuition behind using KL-Divergence in our method is to identify the change we experience in the newly coming behavior, compared to the base profile. Similarly, the intuition behind using smoothing is to assume that even if a feature has not been seen in the given dataset, we can still take into account the possibility of its appearance, although very small. Without smoothing, distributions with thousands of matching features except one could be regarded as not related.
III-C Anomalous Behavior
The user profile evaluates as the new features from the newly coming behavior are imported to the profile. However, before they are added to the profile, they are tested to see if this new activity is an anomalous behavior.
The drift scores over time, which form a vector denoted as , are used to calculate the linear regression coefficients to see the ordinary behavior change for the user. The resulting model function of linear regression of these drift scores for a given period of time yields the profile drift, formulated as follows:
| (3) |
where is the y-axis intercept constant, and is the slope of the profile drift line. is a very small number that represents the noise.
To compute , given a matrix , the naive least squares computation has overall complexity, or we can use LU or Cholesky decomposition which takes where denotes the number of features and denotes the number of training examples. Since we can usually assume , dominates . As a result we can consider that the total asymptotic complexity for linear regression is . However, since we are using the KL-Divergence score of two probability distributions, the number of features scales down to 1, which results in the complexity of this step scaling down to where is expected to be a very low number by computational standards. For instance, if we take the profile drift computation interval as one day, we end up with for a year of data.
Profile drifts occur as the users take on different tasks, as they start to grow different interests, or as they gain experience on the job. Consequently, when this constant change is not addressed properly, utilizing a predefined threshold value can lead to raising too many false positives for the security personnel to inspect when it is set too low, or too many false negatives when it is set too high to avoid false positives. Hence, we define an anomaly as a drift score larger than the sum of the expected profile drift at that specific point, and expected error (i.e., standard deviation) as follows:
| (4) |
Positive drift in a profile implies that the user is inclined to change their behavior rapidly. Negative drift at any point intuitively suggests that the user started not to get out of their usual pattern as much as before. Issuing no queries at all does not cause any security concerns while increasing the sensitivity to behavior drift when the user starts to issue queries again. When a system uses our model, by using a sliding window strategy, this high sensitivity will fade away as the behavior drift will converge in time.
IV Experiments
In this section, we first describe our experimental setup and the dataset. We then show how behavior drift can identify different users. We finally present findings from the evaluation of our framework with a real-world SQL query workload.
IV-A Experimental Setup
In our experiments, the tests were performed on macOS High Sierra v11.0.1 on a 2.7 GHz Intel Core i5 with 8GB memory. All of the implementations are performed with Java 1.8 and Python 3.5.
IV-B Dataset
We use Android smartphone query SQL query logs in our experiments. The experiment dataset consists of SQL logs that capture all database activities of 11 Android phones for a period of one month. SQL queries collected are anonymized, and some of the identified query constraints are deleted for IRB compliance. In this dataset, the queries are generated by the Android applications. There are 45,090,798 queries in total in this dataset. We selected three apps that have the largest volume of database interactions for our experiments: (1) Facebook, (2) Google+, and (3) Google Play.
We also performed the same experiments on smaller, less used applications, that reflected similar results 111Disclaimer: We do not claim that the apps selected for the experiments have any vulnerabilities that is presented in this work. This does not mean they do not have similar vulnerabilities that can cause data leakage.. The total query numbers for each application can be seen in Table I.
| Application | # of queries |
|---|---|
| Complete Dataset | 45,090,798 |
| 1,272,779 | |
| Google+ | 2,040,793 |
| Google Play | 14,813,949 |
Not all queries issued by Android apps are legitimate SQL – there can be stored procedure calls, and environment variable checks. The SQL query logs of Facebook, Google+ and Google Play we used for our experiments are extracted from PocketData dataset [27] and available online 222https://phone-lab.org/experiment/request/.
IV-C User Similarity
This experiment aims to show that even though the app generates the queries with the same logic, user behavior affects the distribution of queries. We investigate how similar the users profiles are to each other in this experiment.
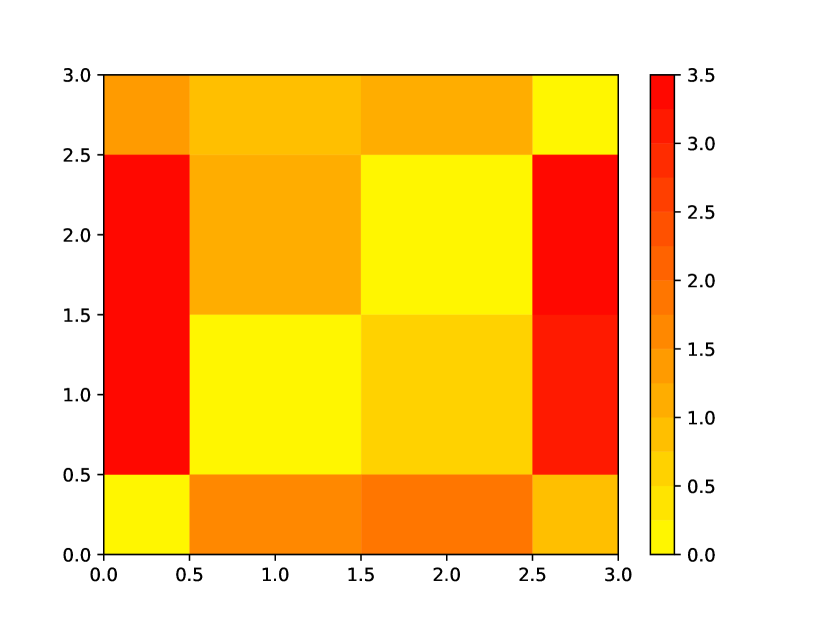
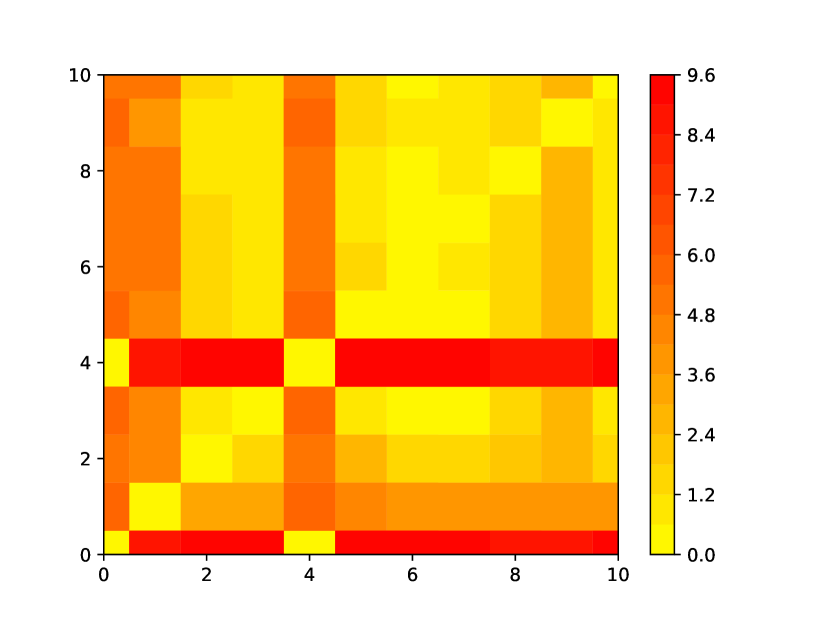
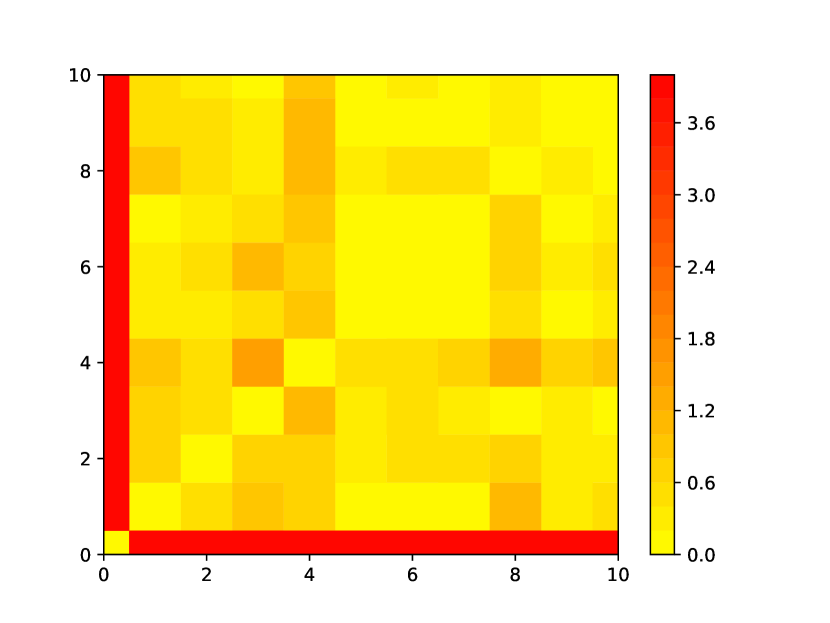
Figure 4 shows how comparable different users are with regards to their information access characteristics. In the graphs, darker colors represent that the corresponding user behavior is more distinct while lighter colors represents that the users have similar behaviors. Also note that the color scale is different for each application. We observe that usage characteristics of Google Play Services are less diverse between users, whereas social media application usage characteristics of users are very distinguishable. Based on Figure 4, although the workloads created by different users share the same queries, the distribution of the queries are different. Hence, we conclude that our method can distinguish workloads created by different users.
IV-D Per-User Behavior Model
In this section, we report our findings on employing our approach of creating user behavior models for each app.
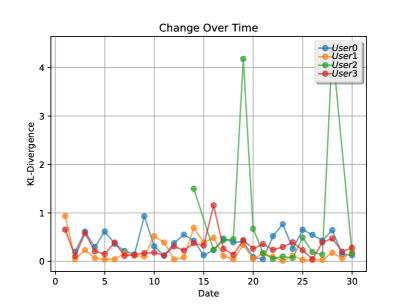
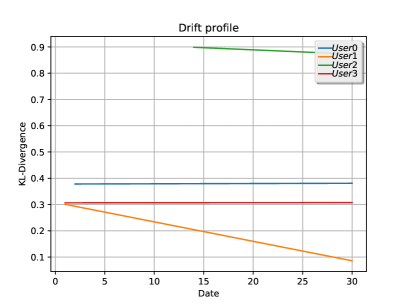
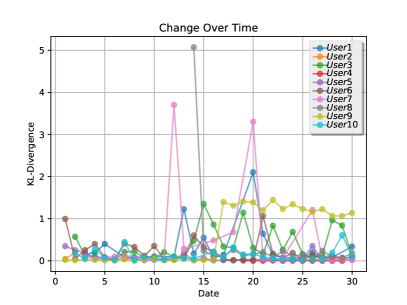
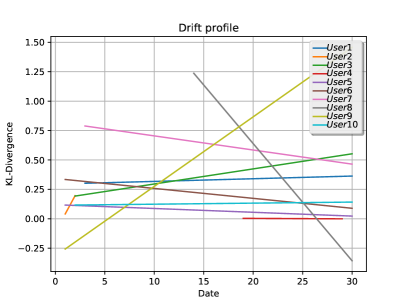
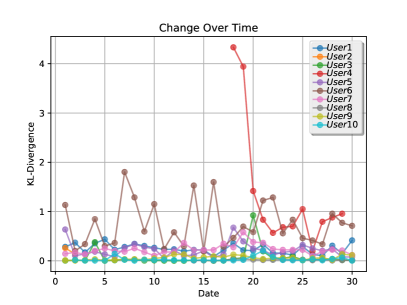
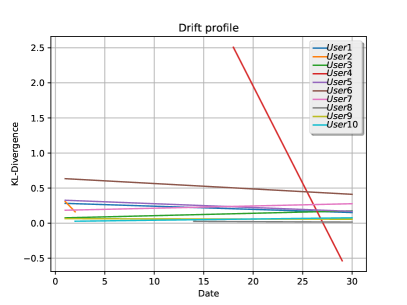
Figure 5 shows how user behavior changes over time on the left side, and profile drift of each user on the right side for different Android applications. The -axis represents the day of the month, the -axis represents the drift score for the user for that specific day compared to the aggregation of all activity in the previous days.
QWA allows its users to investigate reasons of the behavior changes by summarizing the features that caused the highest drift score change. This allows us to quickly inspect the information accessed when an alarm is raised. The trend line for each user represents the observed behavior drift, namely, how fast the behaviors of the user change. Less area under the trend line means the user is less inclined to change their daily routines.
In our dataset, There are 4 users who used Facebook app, and except one, the users have stable profiles. One user, on the other hand, seems to have a distinguishable behavior change over time. However, when inspected, that specific user only uses the application more than 3 minutes twice, which explains the spikes seen in Figure 5(a).
Similarly, except one user, all the users of Google+ application have steady behaviors. Most of the queries issued by Google+ app retrieve information on the user’s account, which clearly shows how Android OS utilizes the Google+ application. Figure 5(b), on the other hand, reveals that this application is mostly affected by the phone usage characteristics.
Google Play Services is an Android system-support app. The drift over time, as shown in Figure 5(c), is low for most of the users. This application controls the install, update, and delete application operations on behalf of the operating system. The inspection we performed shows that the user who has a distinguishing behavior drift is used to install, and delete various applications.
One misconception from Figure 5 can be that similar trends in these graphs mean these users have analogous behavioral characteristics. Similar trends in these graphs only mean that the expectation of behavior change pace is comparable for these users.
In the following section, we will describe the red-teaming approach we used to inject real workloads. Since these workloads were taken from the other users, the variety between users are directly correlated to the success of the experiments.
IV-E Red-teaming approach
We consider two different attack frameworks: (1) Simulated query attack injection, in which we prepare specific attack scenarios for each app, and (2) Real workload injection, in which we input other users’ real workloads into the user’s own workload.
From now on, we will call the actual workload owner the victim, and the owner of the injected workload the adversary.
Simulated workload injection. We inject specifically designed workloads to perform a malicious activity into the user workload. We assume that all the actual query activity in the dataset is benign. Note that we inject the simulated workloads into the log, not into the actual smartphone databases.
This approach addresses free-styler and the first case of translator attack models described in Section II:
-
•
When a new workload consisting of queries that are not generated by the app’s own query generator in addition to the benign workload is injected and run, it would equate to a free-styler attack since normally the app wouldn’t produce these queries therefore not letting the victim the privilege to access the information.
-
•
In translator attack model, the malicious code modifies the query generation mechanism code of the app. The queries can still be generated by the app, but some of them will not reflect the same characteristics as the legitimate queries.
The simulated queries we injected in the victim’s workload are prepared according to the scenarios given below:
-
We delete entries in the feed table and corresponding cache items. To replace them, we insert other feed items that we want the victim to believe.
- Google+
-
We access the account information and the photos stored on the account. We alter the account information in order to redirect the password renewal emails to us.
- Google Play Services
-
We modify the log records in order to confuse the operating system to skip updates for some applications. This would allow an adversary to take advantage of any patched vulnerabilities.
The results for this approach are given in Table II.
|
|
|
|||||||
|---|---|---|---|---|---|---|---|---|---|
| 105 | 98 | 93.3% | |||||||
| Google+ | 225 | 214 | 95.1% | ||||||
| Google Play | 282 | 267 | 94.7% |
Real workload injection. We inject different workloads created by other users into the normal workload of the user. We assume that all the query activity in the dataset is benign. However, we simulate an attack by injecting one user’s normal activity into the workload created by one of the other users. Hence, we only use queries that were created by the app itself.
This approach addresses the copycat and the second case of the translator attack models described in Section II:
-
•
By injecting the adversary’s workload, we simulate copycat attack. The adversary’s workload would reflect its the characteristics of queries generated by legitimate actions while using the victim’s credentials.
-
•
The second case of the translator attack similarly uses legitimate queries generated by the app, however, these queries are being generated by the modified code.
The results for this approach are given in Table III.
|
|
|
|||||||
|---|---|---|---|---|---|---|---|---|---|
| 315 | 283 | 89.8% | |||||||
| Google+ | 2025 | 1818 | 89.7% | ||||||
| Google Play | 2583 | 2092 | 81.0% |
In our experiments, we created the normal user behavior model for each user. To compute detection accuracy rate, we partitioned the workloads of the same application created by all the other users day by day, and we tested each of these partitions of data to see if our system raises an alarm on the specific normal user behavior model that is being tested. As mentioned in Section IV-E, although these injected workloads are actually naive workloads of other users, in our concept, they belong to a different user but still generated legitimately; hence, they represent an extremely skillful attacker. As shown in Table III, our methodology successfully determines these injections do not belong to the user model at least 81% and at most 89.8% of the times depending on the application.
V Related Work
There are two approaches to deal with data leakage from databases: (1) misuse detection, and (2) anomaly detection.
Misuse detection aims to collect a dataset of events that leads to intrusions. These systems observe user behavior, and when a user takes certain actions, the system either raises an alarm, or blocks the user from taking any other actions. These particular actions can be designed for specific scenarios to prevent well-known attacks, or they can be learned from other sources such as successfully caught incidents [28].
Anomaly detection approach, on the other hand, depends on detecting anomalies at a user’s behavior. The systems implemented with these approach can focus on a specific type of resource, or combination of resources [29] such as file access patterns [30], shell commands [31], and SQL queries [7, 20, 32].
There has been extensive level of research in detecting data leakage from databases, but there are still challenges in this field [33]. Chung et al. [34] proposed the use of access patterns to databases to detect typical behavior of users. Kamra et al. [7] developed a SQL query feature extraction method that generalizes complex queries into simpler, and easier to compare forms to use them in detecting insider attacks. Mathew et al. [20] introduced a data–centric approach that requires access to the data that a query returns, which then would be used to compute the overlap between returned result sets. Wang et al. [24] focused on harvesting attacks considering query correlation and result coverage. Maggi et al. [8] is one of the leading works that introduced concept drift in web applications. Their model is designed to track the changes on websites in order to find out if there is a need to retrain the security application.
We use a temporal user behavior drift model in user profiles in this paper. To the best of our knowledge, our work is the first work that performs such an extensive study on SQL query data produced by real world users on temporal behavior drift. Although using temporal concept drift for outlier detection has been studied in a limited number of works before as pointed out, we believe these studies either did not use or create real-world user provided activities, or they used generated data. Our approach takes adaptation to individual behaviors into account which would allow flexibility to adapt to new tasks.
VI Discussion
There are a number of vulnerabilities that have been identified on Android OS which can lead to sensitive data leakage from the app database. In this paper, we discuss two of them, and argue that there may be other vulnerabilities with similar consequences that have not been discovered yet. The solution proposed in this paper is applicable to detect attacks that exploit these vulnerabilities. However, this method requires prior knowledge about how the user utilizes an app. Therefore, zero-day attacks cannot be detected with the proposed method. To address this problem, developers can insert probability distributions for different classes of users in the alpha tests of their app, so that the security layer that utilizes our method can collect enough data about the user, and still be able to detect zero day attacks.
In our experiments, we take the profile drift computation interval as one day, and we compare this distribution with the accumulated user profile over time. Although this approach achieves high detection rates in our setting, applying a sliding window on the streaming data to create the user profile can yield better results for different apps. The ideal length of the interval and sliding window depends on different settings.
Lastly, in this paper, we only propose a method to detect data leakage from databases on Android apps. We do not propose a strategy on how the app reacts when an attack is detected. We believe that this decision should be made by the app developer, and it is out of our scope.
VII Conclusions
The focus of this paper was to highlight a class of vulnerabilities that can lead to data leakage from the database system, and to present a framework for creating user behavior profiles considering the temporal behavior drift to be used in detecting attacks exploiting them. We first provided a user behavior model for data leakage prevention. We argued that without considering the constant change in people’s behaviors and habits, it is impossible for the defense systems to adapt to the new changes. This would result in the need for retraining of the user models for the system. In our experiments, we used real world query workloads and applied two different red teaming approaches: (1) simulated attack workloads, and (2) injection of benign real world workloads of other users.
The model we described in this paper constitutes the first steps of building a temporal behavior drift prediction model. Concretely, we plan to extend our work in several directions: First, we will analyze other regression models, and test their effect on the performance of the system. Second, we will incorporate a prediction model both for security applications, and performance optimization of database systems. Lastly, we will develop a production ready package to be integrated to apps and Android OS.
Acknowledgment
This material is based in part upon work supported by the National Science Foundation under award number CNS - 1409551. Usual disclaimers apply.
References
- [1] IDC, “IDC:Smartphone OS Market Share,” https://www.idc.com/promo/smartphone-market-share/os, accessed: 2017-12-20.
- [2] Android, “Android Security 2016 Year in Review,” https://source.android.com/security/reports/Google_Android_Security_2016_Report_Final.pdf, March 2017.
- [3] B. Hassanshahi and R. H. Yap, “Android database attacks revisited,” in AsiaCCS, 2017.
- [4] V. Jain, S. Bhandari, V. Laxmi, M. S. Gaur, and M. Mosbah, “Sniffdroid: Detection of inter-app privacy leaks in android,” in IEEE Trustcom/BigDataSE/ICESS, 2017.
- [5] S. Bhandari, F. Herbreteau, V. Laxmi, A. Zemmari, P. S. Roop, and M. S. Gaur, “Sneakleak: Detecting multipartite leakage paths in android apps,” in IEEE Trustcom/BigDataSE/ICESS, 2017.
- [6] C. Brodsky, “Database activity monitoring(dam): Understanding and configuring basic network monitoring using imperva’s securesphere,” Sans Institute InfoSec Reading Room, 2015.
- [7] A. Kamra, E. Terzi, and E. Bertino, “Detecting anomalous access patterns in relational databases,” VLDBJ, 2007.
- [8] F. Maggi, W. Robertson, C. Kruegel, and G. Vigna, “Protecting a moving target: Addressing web application concept drift,” in RAID, 2009.
- [9] M. Zhang and H. Yin, “Appsealer: Automatic generation of vulnerability-specific patches for preventing component hijacking attacks in android applications.” in NDSS, 2014.
- [10] L.-K. Yan and H. Yin, “Droidscope: Seamlessly reconstructing the os and dalvik semantic views for dynamic android malware analysis.” in USENIX Security, 2012.
- [11] GuardSquare, “New Android vulnerability allows attackers to modify apps without affecting their signatures,” https://www.guardsquare.com/en/blog/new-android-vulnerability-allows-attackers-modify-apps-without-affecting-their-signatures, accessed: 2017-12-20.
- [12] Y. Z. X. Jiang and Z. Xuxian, “Detecting passive content leaks and pollution in android applications,” in NDSS, 2013.
- [13] V. Jain, M. S. Gaur, V. Laxmi, and M. Mosbah, “Detection of SQLite Database Vulnerabilities in Android Apps,” in Information Systems Security, 2016.
- [14] X. Jin, X. Hu, K. Ying, W. Du, H. Yin, and G. N. Peri, “Code injection attacks on HTML5-based mobile apps: Characterization, detection and mitigation,” in CCS, 2014.
- [15] B. Hassanshahi, Y. Jia, R. H. Yap, P. Saxena, and Z. Liang, “Web-to-application injection attacks on android: Characterization and detection,” in ESORICS, 2015.
- [16] W. Gatterbauer, “Databases will visualize queries too,” pVLDB, 2011.
- [17] G. Kul, D. Luong, T. Xie, P. Coonan, V. Chandola, O. Kennedy, and S. Upadhyaya, “Ettu: Analyzing query intents in corporate databases,” in WWW Companion, 2016.
- [18] N. Khoussainova, Y. Kwon, M. Balazinska, and D. Suciu, “SnipSuggest: context-aware autocompletion for SQL,” pVLDB, 2010.
- [19] K. Stefanidis, M. Drosou, and E. Pitoura, “”You May Also Like” results in relational databases,” in PersDB, 2009.
- [20] S. Mathew, M. Petropoulos, H. Q. Ngo, and S. Upadhyaya, “A data-centric approach to insider attack detection in database systems,” in RAID, 2010.
- [21] J. Aligon, M. Golfarelli, P. Marcel, S. Rizzi, and E. Turricchia, “Similarity measures for olap sessions,” Knowledge and information systems, 2014.
- [22] G. Kul, D. T. A. Luong, T. Xie, V. Chandola, O. Kennedy, and S. Upadhyaya, “Similarity measures for sql query clustering,” IEEE TKDE, 2018.
- [23] V. H. Makiyama, M. J. Raddick, and R. D. Santos, “Text mining applied to SQL queries: A case study for the SDSS SkyServer,” in SIMBig, 2015.
- [24] S. Wang, D. Agrawal, and A. El Abbadi, “Hengha: Data harvesting detection on hidden databases,” in CCSW, 2010.
- [25] V. Chandola, A. Banerjee, and V. Kumar, “Anomaly detection: A survey,” ACM computing surveys (CSUR), vol. 41, no. 3, p. 15, 2009.
- [26] S. Kullback and R. A. Leibler, “On information and sufficiency,” The annals of mathematical statistics, vol. 22, no. 1, pp. 79–86, 1951.
- [27] O. Kennedy, J. Ajay, G. Challen, and L. Ziarek, “Pocket Data: The need for TPC-MOBILE,” in TPC-TC, 2015.
- [28] G. Kul and S. Upadhyaya, “Towards a cyber ontology for insider threats in the financial sector,” JOWUA, 2015.
- [29] M. B. Salem, S. Hershkop, and S. J. Stolfo, “A survey of insider attack detection research,” in Insider Attack and Cyber Security, 2008.
- [30] A. S. McGough, B. Arief, C. Gamble, D. Wall, J. Brennan, J. Fitzgerald, A. van Moorsel, S. Alwis, G. Theodoropoulos, and E. Ruck-Keene, “Ben-ware: Identifying anomalous human behaviour in heterogeneous systems using beneficial intelligent software,” JOWUA, 2015.
- [31] N. Nguyen, P. Reiher, and G. H. Kuenning, “Detecting insider threats by monitoring system call activity,” in IEEE IAW, 2003.
- [32] S. Vavilis, A. Egner, M. Petković, and N. Zannone, “An anomaly analysis framework for database systems,” Computer Security, vol. 53, no. C, pp. 156–173, Sep. 2015.
- [33] R. J. Santos, J. Bernardino, and M. Vieira, “Approaches and challenges in database intrusion detection,” SIGMOD Rec., vol. 43, no. 3, pp. 36–47, Dec. 2014.
- [34] C. Y. Chung, M. Gertz, and K. Levitt, “Demids: A misuse detection system for database systems,” in Integrity and Internal Control in Information Systems, 2000, pp. 159–178.