Stellar and Planetary Characterization of the Ross 128 Exoplanetary System from APOGEE Spectra
Abstract
The first detailed chemical abundance analysis of the M dwarf (M4.0) exoplanet-hosting star Ross 128 is presented here, based upon near-infrared (1.5–1.7 µm) high-resolution (22,500) spectra from the SDSS-APOGEE survey. We determined precise atmospheric parameters =3231100K, log=4.960.11 dex and chemical abundances of eight elements (C, O, Mg, Al, K, Ca, Ti, and Fe), finding Ross 128 to have near solar metallicity ([Fe/H] = +0.030.09 dex). The derived results were obtained via spectral synthesis (1-D LTE) adopting both MARCS and PHOENIX model atmospheres; stellar parameters and chemical abundances derived from the different adopted models do not show significant offsets. Mass-radius modeling of Ross 128b indicate that it lies below the pure rock composition curve, suggesting that it contains a mixture of rock and iron, with the relative amounts of each set by the ratio of Fe/Mg. If Ross 128b formed with a sub-solar Si abundance, and assuming the planet’s composition matches that of the host-star, it likely has a larger core size relative to the Earth despite this producing a planet with a Si/Mg abundance ratio 34% greater than the Sun. The derived planetary parameters – insolation flux (SEarth=1.790.26) and equilibrium temperature (=29410K) – support previous findings that Ross 128b is a temperate exoplanet in the inner edge of the habitable zone.
1 Introduction
Nearby M dwarfs likely provide some of the best opportunities for detecting and characterizing potentially “Earth-like” exoplanets in the near future. M dwarfs produce larger observational signatures from low-mass exoplanets through both the radial velocity and transit methods (Shields et al. 2016, Charbonneau & Deming 2007), making it easier to discover Earth-size or Earth-mass exoplanets orbiting these stars. Discoveries of Earth-size or Earth-mass exoplanets have become common around low-mass stars thanks to the efforts of high cadence radial velocity () programs, as well as the Kepler mission (Batalha et al. 2013). Proxima Cen b and the recent announcement of Ross 128b are examples of RV-detected exoplanets (Anglada-Escudé et al. 2016, Bonfils et al. 2017), while TRAPPIST-1, Kepler-138, and Kepler-186 (Gillon et al. 2017, Jontof-Hutter et al. 2015, Quintana et al. 2014, Souto et al. 2017) are examples of transiting exoplanet systems with cool M dwarf host stars.
An approach to study the exoplanet composition, albeit an indirect one, is the analysis of the individual host star. This method can, for example, provide measurements of a star’s C and O abundance, which play a role in the ice and gas chemistry in protoplanetary disks, as well as Mg, Fe, and Si abundances, that potentially control a rocky planet’s core to mantle mass ratios (Bond et al. 2010, Delgado Mena et al. 2010, Thiabaud et al. 2015, Dorn et al. 2017, Santos et al. 2017, and Unterborn & Panero 2017). Until recently, detailed abundance measurements of M dwarfs were lacking, due in part to the difficulty of obtaining high-S/N, high-resolution spectra, as well as strong molecular absorption from species such as TiO in the optical or H2O in the near-infrared (Allard et al. 2013).
The previous work of Souto et al. (2017) demonstrated that effective temperatures and detailed individual abundances of 13 elements can be measured from near-infrared (NIR) H-band high-resolution APOGEE (Apache Point Galactic Evolution Experiment; Majewski et al. 2017) spectra of warm M dwarfs ( 3900K; see also Schmidt et al. 2016). Also using high-resolution spectra, Önehag et al. (2012), Lindgren & Heiter (2017), have shown that stellar metallicities can be studied from J-band spectra. Most studies, however, use photometric calibrations to determine M dwarf stellar parameters e.g., , log, and mass (Delfosse et al. 2000, Bonfils et al. 2005, Mann et al. 2015) and low-resolution NIR spectroscopy to determine M-dwarf metallicities ([Fe/H]) from equivalent widths in the K-band (Rojas-Ayala et al. 2012). These methods provide a good estimate of the stellar parameters and metallicity; in the context of exoplanet studies, accurate values for and are needed in order to better constrain the exoplanet properties (e.g. insolation, equilibrium temperature). In addition, precise host star abundance measurements for particular elements can help to constrain the composition of the initial refractory materials that build rocky exoplanets.
In this work, we perform the first detailed abundance analysis for Ross 128, a cool M dwarf (M4.0) exoplanet host. We use 22,500 H-band APOGEE spectra to derive precise atmospheric parameters and chemical abundances of eight elements adopting a similar methodology as Souto et al. (2017), but extending the analysis to the cool M dwarf regime. Such parameters are needed to better characterize the mass ( 1.35 M⊕) of the 9.9 day period exoplanet around Ross 128, the second closest (3.37 pc) terrestrial-mass planet, recently discovered by Bonfils et al. (2017).
2 Observations and Spectrum Synthesis
The APOGEE survey (Majewski et al. 2017, see also Blanton et al. 2017, Zasowski et al. 2017) observes primarily red giants, but has also observed M-dwarfs in the solar neighborhood to fill missing fibers or as part of ancillary projects. With APOGEE NIR spectral coverage (15,150-17,000Å) and high-resolution spectroscopic capabilities (Gunn et al. 2006, Wilson et al. 2010), the APOGEE spectrograph has turned out to be an excellent instrument for detailed studies of M dwarfs (see Souto et al. 2017).
The APOGEE spectra of Ross 128 (HIP 57548; GJ 447; 2M11474440+0048164) were obtained with the fiber feed to the NMSU 1.0 meter telescope at APO. We use the processed spectrum of Ross 128 from the DR14 pipeline (Abolfathi et al. 2018, Nidever et al. 2015) representing the combination of two individual observations both obtained on 28 January 2014. The resulting S/N (per-pixel) in the combined spectrum is 230.
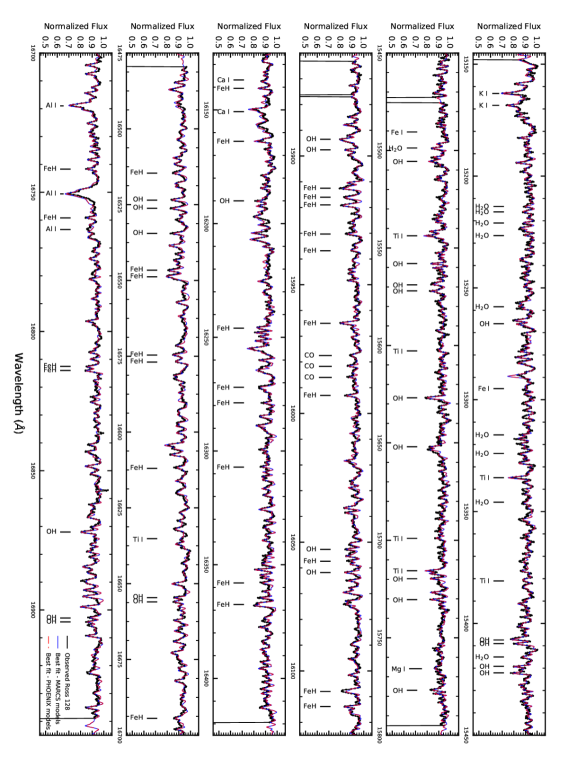
As a first step in the analysis we conducted a careful identification of the main spectral features in the APOGEE spectrum of Ross 128, given that this is a much cooler M dwarf than those previously analyzed in Souto et al. (2017). Figure 1 displays the molecular and atomic lines identified; in this regime most of the APOGEE spectrum is dominated by H2O or FeH lines but some atomic lines of Fe I, Mg I, Ca I, and Al I are also seen. We performed a line-by-line manual abundance analysis to determine the atmospheric parameters of Ross 128 (Section 2.1) and individual chemical abundances of the elements C, O, Mg, Al, K, Ca, Ti, and Fe. The adopted transitions in the line-by-line abundance analysis (a total of 86 lines) are indicated with black vertical tick marks in Figure 1. Figure 1 also shows the best fitted synthetic spectra obtained from this analysis, as discussed below.
A spectrum synthesis analysis is required to analyze cool star (M-dwarf) spectra, rather than the equivalent-width method, due to molecular blends that blanket their spectra. In this work, we adopted 1-D plane-parallel LTE models from MARCS and BT-Settl PHOENIX (Gustafsson et al. 2008, Allard et al. 2013). The synthetic spectra were computed with the Turbospectrum code (Alvarez & Plez 1998, Plez 2012) using the modified version of the APOGEE line list (Souto et al. 2017, Shetrone et al. 2015) that takes into account transitions of FeH. The synthetic spectra were broadened with a Gaussian profile corresponding to the APOGEE resolution (a full width half maximum, FWHM, 0.73Å). We derived a vsin8 km s-1 for Ross 128 and note that this vsin value is at the limit of what can be resolved from APOGEE spectra Gilhool et al. 2018. In all calculations we adopted a microturbulent velocity of =1.00 km s-1. The best fitted synthetic spectra were obtained by defining the pseudo-continuum of the observed spectra over each window analyzed, and the derived abundances are the value best-fitting the observed spectra from a 2 minimization method.
| log | Fe/H | O/H | |||
|---|---|---|---|---|---|
| MARCS | 3231100 | 4.960.11 | 1.00 | +0.02 | -0.03 |
| PHOENIX | 3223100 | 4.890.11 | 1.00 | +0.03 | -0.02 |
| Rojas-Ayala et al. (2012) | 298650 | … | … | +0.03 | … |
| Mann et al. (2015) | 319264 | 5.08 | … | -0.02 | … |
2.1 Effective Temperature and Surface Gravity
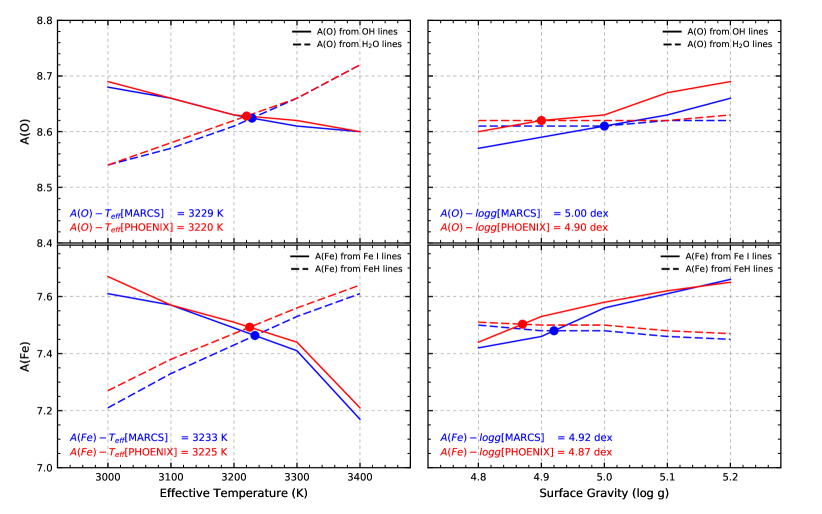
The effective temperature () and surface gravity (log) values of Ross 128 were obtained using a similar methodology as discussed in Souto et al. (2017). That previous study used the OH and H2O lines as oxygen abundance indicators to define the effective temperature. Here we add Fe I and FeH as Fe abundance indicators and use the combination of oxygen and iron abundances from OH, H2O, Fe I and FeH for deriving both the effective temperature and the surface gravity for Ross 128.
Figure 2 shows the derived oxygen and iron abundances as functions of and log for both MARCS and PHOENIX model atmospheres. The effective temperature and log are defined by the agreement between the different abundance indicators (crossing points). The derived effective temperature using the –A(O) pair (top-left panel) is quite similar to the one from the –A(Fe) pair (bottom-left panel), with a difference of only 5K; a similar effective temperature is derived using either family of model atmosphere. The same is true for log, although with slightly larger differences (0.02–0.08 dex). These results indicate that good consistency can be obtained between the different abundance indicators.
The stellar parameters and individual abundances derived from MARCS and PHOENIX models are very similar (Tables 1 and 2). We derive = 3231/3223 100K, log= 4.96/4.89 0.11 dex, and [Fe/H]= +0.03/+0.04 0.09 (MARCS/PHOENIX). The uncertainties in and log were estimated by allowing the Fe abundances from Fe I and FeH lines, and oxygen abundances from H2O and OH lines to differ by 0.1 dex. The values from Rojas-Ayala et al. (2012) displayed in Table 1 were obtained using the same techniques as Muirhead et al. (2014). We adopt the - and - colors to determine the from Mann et al. (2015). The derived surface gravity (log=4.96) agrees well with the log obtained from physical relation (log=5.09) assuming =0.1680.017 from Mann et al. (2015), =0.00367 from Gaia DR2 (Gaia Collaboration et al. 2018), and the of this work using MARCS model, where =5772K and log =4.438 were adopted. Table 2 presents the abundance results, the standard deviation of the mean abundances from the adopted lines (std), and the abundance uncertainties for each species () to changes in the atmospheric parameters (computed following Souto et al. 2017).
| MARCS | PHOENIX | |||||||
|---|---|---|---|---|---|---|---|---|
| A(X) | X/H | std | A(X) | X/H | std | Number of Lines | ||
| FeI | 7.48 | 0.03 | 0.02 | 7.49 | 0.04 | 0.02 | 2 | 0.09 |
| FeH | 7.45 | 0.00 | 0.07 | 7.46 | 0.01 | 0.08 | 30 | 0.08 |
| C | 8.41 | 0.02 | 0.01 | 8.41 | 0.02 | 0.01 | 3 | 0.02 |
| OH | 8.62 | -0.04 | 0.02 | 8.63 | -0.03 | 0.02 | 29 | 0.06 |
| H2O | 8.64 | -0.02 | 0.02 | 8.64 | -0.02 | 0.03 | 10 | 0.08 |
| Mg | 7.43 | -0.10 | … | 7.48 | -0.05 | … | 1 | 0.13 |
| Al | 6.35 | -0.02 | … | 6.36 | -0.01 | … | 1 | 0.10 |
| K | 5.03 | -0.05 | 0.03 | 5.06 | -0.02 | 0.03 | 2 | 0.04 |
| Ca | 6.36 | -0.01 | 0.02 | 6.38 | 0.01 | 0.03 | 2 | 0.03 |
| Ti | 4.73 | -0.17 | 0.21 | 4.77 | -0.13 | 0.20 | 6 | 0.09 |
3 Discussion
In the following discussion we adopt the abundance results derived with the MARCS model atmospheres, keeping in mind, however, that the results computed with PHOENIX models are very similar. The derived abundances of Ross 128 are close to solar for all elements, with the exception of Ti and to a lesser degree Mg (within the uncertainties). For Mg, we derive [Mg/H]=-0.100.13 dex from one neutral Mg I line (15765.842Å), while for the other alpha-elements calcium and oxygen, we find just slightly subsolar abundances ([Ca/H]=-0.010.03 and [O/H]=-0.020.06). For Al we obtain [Al/H]=-0.02 from one Al I line at 16763Å; the other two Al I lines (16718 and 16750Å) present in the APOGEE spectra of Ross 128 are too strong and were not used in our analysis (see also discussion in Nordlander & Lind 2017 for non-LTE effects in Al). For Ti we obtain [Ti/H]=-0.17 from five Ti I lines with large scatter in the abundance results; the standard deviation of the mean is 0.21 dex indicating that the Ti abundance is uncertain to some degree. Non-LTE effects might be relevant for the Ti I H-band lines but these have not been investigated here nor included in our calculations. We also note that the results for Ti for the APOGEE DR14 red-giants present some issues as discussed in Souto et al. (2016), and Jönsson et al. (in preparation).
3.1 Star–Planet Connection
One of the goals in studying individual abundances of exoplanet host stars is to try to infer the composition of the rocky exoplanets that orbit them. Certain abundance ratios (e.g. C/O and Mg/Si) play an important role in the chemistry of exoplanet formation in the disk and may also provide first-order information on the structure and mineralogy of the resulting rocky planets (e.g., Bond et al. 2010, Unterborn & Panero 2017). In this work we derive C/O=0.600.04 for Ross 128. While this is quite similar to solar (C/O=0.54, Asplund et al. 2005), it is below the value where refractory carbon is expected to condense and drastically affect the condensation temperatures of the refractory, rocky planet-building elements Mg, Si and Fe (C/O=0.8–1.0; Lodders 2003). The stellar Mg/Si abundance ratio may affect the resulting silicate mineralogy of Ross 128b, although it is not possible to derive Si abundances in Ross 128 as the Si I lines become severely blended with H2O or FeH. The Fe/Mg ratio, however, can affect the relative fraction of core-to-mantle and provide some broad constraints on the possible interior structure of Ross 128b.
While both mass and radius are not available for Ross 128b, we can estimate its radius given its observed minimum mass and assuming the stellar composition of the host star is a proxy for that of the planet. We calculate the range of radii possible for Ross 128b using the ExoPlex software package (Unterborn et al. 2018) for all masses above the minimum mass of Ross 128b (1.35M⊕; Bonfils et al. 2017). Models were run assuming a two-layer model with a liquid core and silicate mantle (no atmosphere). We increase the input mass until a likely radius of 1.5R⊕ was achieved, roughly the point where planets are not expected be gas-rich mini-Neptunes as opposed to rock and iron-dominated super-Earths (Figure 3, left). ExoPlex conserves the relative molar ratios for the dominant rocky planet-building elements assuming all Fe is present in the core with no light elements (e.g. Si, O, H) present in the core. Adopting our MARCS abundances we get the molar ratios Fe/Mg=1.12, Ca/Mg=0.09, and Al/Mg=0.08; where the Earth and solar values are 0.90/0.07/0.09 (McDonough, 2003) and 0.83/0.06/0.08 (Lodders, 2003), respectively.
Changes in the relative planet’s core size have a large effect on its bulk density (Unterborn et al. 2016) and we thus consider our Fe abundance uncertainty; 0.88Fe/Mg1.3. We also varied Si/Mg between the extremes of 0.5 and 2 (Solar Si/Mg is 0.97). This range of Si/Mg represents an average difference in radius for a given input mass of roughly 0.05R⊕ (Figure 3, left panel). However, because the molar mass of MgO is 1/3 smaller than SiO2 (our chosen mantle oxides), this range of Si/Mg represents core mass fractions between 0.44 and 0.27 (Earth is 0.33) for Si/Mg of 0.5 and 2, respectively. For this model, only if Ross 128b had a super-solar Si/Mg of 1.3 would it match the Earth in its core mass fraction, which equates to Ross 128 having a Si abundance of roughly solar (A(Si) = 7.54). That is to say while the molar ratio of Fe/Mg is conserved, the mass ratio of Fe/Mg in our model is not and depends on the chosen Mg/Si. This means that if Ross 128b’s composition mimics that of its host star and a sub-Solar Si/Mg, it will have a larger relative core size than the Earth, despite having roughly solar iron abundance. This is due to the relative ratio of Fe to Mg being greater than in the Sun and Earth, combined with the density of liquid Fe being greater than that of magnesium silicates (e.g. rock-dominated). We note that the uncertainty in the derived radii is about the thickness of the red curve in Figure 3, left panel.
Our calculated Ross 128b radii – under the assumption that the stellar chemical abundances are also those in the planet – all lie below the 100% rock composition curve of Zeng et al. (2016), i.e., it contains a mixture of rock and Fe, with the relative amounts of each set by Fe/Mg. Given our compositional constraints, these calculated radii represent the minimum radius of Ross 128b in the absence of collisional stripping of silicate relative to iron (see also Benz et al. 1988 and Marcus et al. 2010). This means that the addition of light elements to the core or the presence of surface water or an atmosphere will only lower the planet density, causing a radius increase for the same mass. The Ross 128b relatively Fe-rich composition may affect its geodynamo (Gaidos et al. 2010, Driscoll & Olson 2011), although the geodynamic and geochemical consequences of Fe-rich planets are not well explored.

With the results presented here, we can study some Ross 128b fundamental habitability parameters such as insolation flux (SEarth; flux of energy the exoplanet receives from its host star) and equilibrium temperature (). Bonfils et al. (2017) predict that Ross 128b should have an insolation flux (SEarth) of 1.38. Adopting our MARCS , the stellar radius (=0.2090.002 ; very similar to Mann et al. 2015) derived by us from the spectral energy distribution (Stassun et al. 2017) and adopting the Bonfils et al. (2017) semi-major axis (SMA=0.049 AU), we derive SEarth=1.790.26 for Ross 128b, which is consistent with Bonfils et al. (2017). The of an exoplanet is a function of the stellar , radius, the SMA of the planet and its albedo. We obtain for Ross 128b a =29410K for an Earth-like albedo (0.306). Adopting a Venus and Mars-like albedo (0.77 and 0.25), we derive a of 2230.08 and 29911K, respectively. Our results support the claim of Bonfils et al. (2017) that Ross 128b is a temperate exoplanet in the inner edge of the habitable zone. However, this is not to say that Ross 128b is a “Exo-Earth.” Geologic factors unexplored in Bonfils et al. (2017) such as the planet’s likelihood to produce continental crust, the weathering rates of key nutrients into ocean basins or the presence of a long-term magnetic field could produce a planet decidedly not at all “Earth-like” or habitable due to differences in its composition and thermal history. Furthermore, other aspects of the M-dwarf’s stellar activity and its effect on the retention of any atmosphere and potential habitability should be studied , although we find no evidence of activity in the Ross128 spectra.
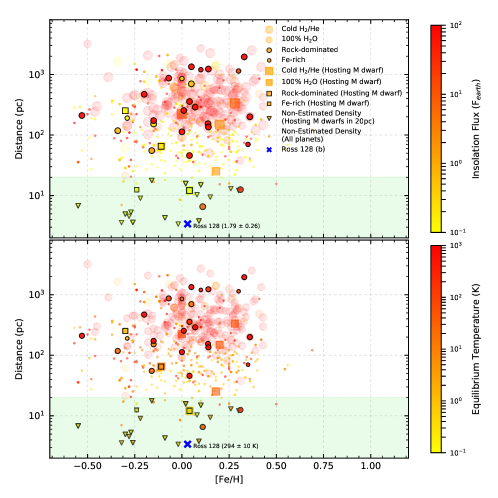
In Figure 3 we use the NASA Exoplanet Archive to study the planetary density (left panel), the metallicity distribution of the host stars as well as the insolation flux and the planet equilibrium temperature as a function of the distance of the systems to the Sun (right panels). We split the sample of known exoplanets into four groups based on the mass-radius-bulk composition curves from Zeng et al. (2016). The planets with density ()1 were tagged as Cold H2/He, with 14 have a predominant H2O atmosphere, the rock-dominated exoplanet have 410, and those with 10 are tagged as Fe-rich exoplanets; we did not take density errors into account for these rough categories. To give particular attention to the M dwarfs hosting exoplanets, we split the sample into stars with 4100K (squared symbols) and 4100K (circled symbols) using the same cuts in density. In Figure 3 left panel, likely rocky-exoplanets are highlighted and the gray shadow region indicates the potential regime for Earth-like exoplanets (with radii from 0–1.5R⊕ and masses from 0–5M⊕). The estimated radii for Ross 128b are displayed as a red solid line. The size of the red line represents the typical uncertainty in the estimated radii.
We show in the right panel of Figure 3 the metallicity ([Fe/H]) distance (pc) distribution of the host stars, with the exoplanet insolation flux (Figure 3 right top panel) and equilibrium temperature (Figure 3 right bottom panel) represented by color bars.
We compute the exoplanet insolation flux and the equilibrium temperature using the , R⋆, and SMA from the NASA Exoplanet Archive with an Earth-like albedo (30%) for all exoplanets.
For the M dwarfs without in the database, we adopt Mann et al. (2015) calibrations to determine the stellar radius.
With a green shadow, we highlight the region with 20 pc, calling attention to the opportunity provided by the nearby M dwarf exoplanetary systems.
The symbols follow the same notation of Figure 3 left panel, with the addition of small dots systems where the exoplanet density is not measured.
The M dwarfs closer than 20 pc that host planets without measured densities are shown as upside down triangles.
Ross 128b is also presented as blue crosses.
We leave the water and gaseous planets as background symbols.
From Figure 3, right top panel, the exoplanets with the lower degree of insolation flux orbit M dwarf stars (yellow squares and triangles). In contrast, the rocky exoplanets around solar-like stars tend to receive much more flux, generally 1000 times more than the Earth.
In summary, our precise spectroscopic atmospheric parameters and individual abundances have allowed us to use theoretical models to study the potential interior composition of Ross 128b. Assuming Ross 128b formed with the same composition as its host star we calculate its mineralogy, structure, and thus its mass. Our model assumes no atmosphere is present, however, because the addition of this layer (or the addition of light elements to the core) would decrease the density for a given radius, our calculated masses represent the maximum mass of Ross 128b in the absence of any mantle stripping due to large impacts. In this scenario, if Ross 128 is also depleted in Si relative to Solar we calculate Ross 128b would have a relatively larger core than the Earth, regardless of the mantle chemistry. It is a likely scenario given the relative depletion of alpha-elements in Ross 128. The derived planetary parameters SEarth=1.790.26 and =29410K support the Bonfils et al. (2017) findings that Ross 128b is a temperate exoplanet in the inner edge of the habitable zone.
References
- Abolfathi et al. (2018) Abolfathi, B., Aguado, D. S., Aguilar, G., et al. 2018, ApJS, 235, 42
- Allard et al. (2013) Allard, F., Homeier, D., Freytag, B., et al. 2013, Memorie della Societa Astronomica Italiana Supplementi, 24, 128
- Alvarez & Plez (1998) Alvarez, R., & Plez, B. 1998, A&A, 330, 1109
- Anglada-Escudé et al. (2016) Anglada-Escudé, G., Amado, P. J., Barnes, J., et al. 2016, Nature, 536, 437
- Asplund et al. (2005) Asplund, M., Grevesse, N., & Sauval, A. J. 2005, Cosmic Abundances as Records of Stellar Evolution and Nucleosynthesis, Astronomical Society of the Pacific Conference Series, 336, 25
- Batalha et al. (2013) Batalha, N. M., Rowe, J. F., Bryson, S. T., et al. 2013, ApJS, 204, 24
- Benz et al. (1988) Benz, W., Slattery, W. L., & Cameron, A. G. W. 1988, Icarus, 74, 516
- Blanton et al. (2017) Blanton, M. R., Bershady, M. A., Abolfathi, B., et al. 2017, AJ, 154, 28
- Bond et al. (2010) Bond, J. C., O’Brien, D. P., & Lauretta, D. S. 2010, ApJ, 715, 1050
- Bonfils et al. (2005) Bonfils, X., Delfosse, X., Udry, S., et al. 2005, A&A, 442, 635
- Bonfils et al. (2017) Bonfils, X., Astudillo-Defru, N., Díaz, R., et al. 2017, arXiv:1711.06177
- Charbonneau & Deming (2007) Charbonneau, D., & Deming, D. 2007, arXiv:0706.1047
- Delfosse et al. (2000) Delfosse, X., Forveille, T., Ségransan, D., et al. 2000, A&A, 364, 217
- Delgado Mena et al. (2010) Delgado Mena, E., Israelian, G., González Hernández, J. I., et al. 2010, ApJ, 725, 2349
- Dorn et al. (2017) Dorn, C., Hinkel, N. R., & Venturini, J. 2017, A&A, 597, A38
- Driscoll & Olson (2011) Driscoll, P., & Olson, P. 2011, Icarus, 213, 12
- Gaia Collaboration et al. (2018) Gaia Collaboration, Brown, A. G. A., Vallenari, A., et al. 2018, arXiv:1804.09365
- Gaidos et al. (2010) Gaidos, E., Conrad, C. P., Manga, M., & Hernlund, J. 2010, ApJ, 718, 596
- Gilhool et al. (2018) Gilhool, S. H., Blake, C. H., Terrien, R. C., et al. 2018, AJ, 155, 38
- Gillon et al. (2017) Gillon, M., Triaud, A. H. M. J., Demory, B.-O., et al. 2017, Nature, 542, 456
- Gunn et al. (2006) Gunn, J. E., Siegmund, W. A., Mannery, E. J., et al. 2006, AJ, 131, 2332
- Gustafsson et al. (2008) Gustafsson, B., Edvardsson, B., Eriksson, K., et al. 2008, A&A, 486, 951
- Jontof-Hutter et al. (2015) Jontof-Hutter, D., Rowe, J. F., Lissauer, J. J., Fabrycky, D. C., & Ford, E. B. 2015, Nature, 522, 321
- Lindgren & Heiter (2017) Lindgren, S., & Heiter, U. 2017, A&A, 604, A97
- Lodders (2003) Lodders, K. 2003, ApJ, 591, 1220
- Majewski et al. (2017) Majewski, S. R., Schiavon, R. P., Frinchaboy, P. M., et al. 2017, AJ, 154, 94
- Mann et al. (2015) Mann, A. W., Feiden, G. A., Gaidos, E., Boyajian, T., & von Braun, K. 2015, ApJ, 804, 64
- Marcus et al. (2010) Marcus, R. A., Sasselov, D., Hernquist, L., & Stewart, S. T. 2010, ApJ, 712, L73
- McDonough (2003) McDonough, W. F. 2003, Treatise on Geochemistry, 2, 568
- Muirhead et al. (2014) Muirhead, P. S., Becker, J., Feiden, G. A., et al. 2014, ApJS, 213, 5
- Nidever et al. (2015) Nidever, D. L., Holtzman, J. A., Allende Prieto, C., et al. 2015, AJ, 150, 173
- Nordlander & Lind (2017) Nordlander, T., & Lind, K. 2017, A&A, 607, A75
- Önehag et al. (2012) Önehag, A., Heiter, U., Gustafsson, B., et al. 2012, A&A, 542, A33
- Plez (2012) Plez, B. 2012, Astrophysics Source Code Library, ascl:1205.004
- Quintana et al. (2014) Quintana, E. V., Barclay, T., Raymond, S. N., et al. 2014, Science, 344, 277
- Rojas-Ayala et al. (2012) Rojas-Ayala, B., Covey, K. R., Muirhead, P. S., & Lloyd, J. P. 2012, ApJ, 748, 93
- Santos et al. (2017) Santos, N. C., Adibekyan, V., Dorn, C., et al. 2017, A&A, 608, A94
- Schmidt et al. (2016) Schmidt, S. J., Wagoner, E. L., Johnson, J. A., et al. 2016, MNRAS, 460, 2611
- Shetrone et al. (2015) Shetrone, M., Bizyaev, D., Lawler, J. E., et al. 2015, ApJS, 221, 24
- Shields et al. (2016) Shields, A. L., Ballard, S., & Johnson, J. A. 2016, Phys. Rep., 663, 1
- Souto et al. (2016) Souto, D., Cunha, K., Smith, V., et al. 2016, ApJ, 830, 35
- Souto et al. (2017) Souto, D., Cunha, K., García-Hernández, D. A., et al. 2017, ApJ, 835, 239
- Stassun et al. (2017) Stassun, K. G., Collins, K. A., & Gaudi, B. S. 2017, AJ, 153, 136
- Thiabaud et al. (2015) Thiabaud, A., Marboeuf, U., Alibert, Y., Leya, I., & Mezger, K. 2015, A&A, 580, A30
- Unterborn et al. (2018) Unterborn, C. T., Desch, S. J., Hinkel, N. R., & Lorenzo, A. 2018, Nature Astronomy, 2, 297
- Unterborn & Panero (2017) Unterborn, C. T., & Panero, W. R. 2017, ApJ, 845, 61
- Unterborn et al. (2016) Unterborn, C. T., Dismukes, E. E., & Panero, W. R. 2016, ApJ, 819, 32
- Wilson et al. (2010) Wilson, J. C., Hearty, F., Skrutskie, M. F., et al. 2010, Proc. SPIE, 7735, 77351C
- Zasowski et al. (2017) Zasowski, G., Cohen, R. E., Chojnowski, S. D., et al. 2017, AJ, 154, 198
- Zeng et al. (2016) Zeng, L., Sasselov, D. D., & Jacobsen, S. B. 2016, ApJ, 819, 127