Confirmation of double peaked Ly emission at ††thanks: Based on observations obtained with the Very Large Telescope, programs: 294.A-5039, 099.A-0254 & 100.A-0213
Distant luminous Lyman- emitters (LAEs) are excellent targets for spectroscopic observations of galaxies in the epoch of reionisation (EoR). We present deep high-resolution () VLT/X-SHOOTER observations, along with an extensive collection of photometric data of ‘COLA1’, a proposed double peaked LAE at (Hu et al., 2016). We rule out that COLA1’s emission line is an [Oii] doublet at on the basis of i) the asymmetric red line-profile and flux ratio of the peaks (blue/red=) and ii) an unphysical [Oii]/H ratio ([Oii]/H). We show that COLA1’s observed -band flux is explained by a faint extended foreground LAE, for which we detect Ly and [Oiii] at . We thus conclude that COLA1 is a real double-peaked LAE at , the first discovered at , confirming the result from Hu et al. (2016). COLA1 is UV luminous (M), has a high equivalent width (EW Å) and very compact Ly emission ( kpc). Relatively weak inferred H+[Oiii] line-emission from Spitzer/IRAC indicates an extremely low metallicity of or reduced strength of nebular lines due to high escape of ionising photons. The small Ly peak separation of km s-1 implies a low Hi column density and an ionising photon escape fraction of %, providing the first direct evidence that such galaxies contribute actively to the reionisation of the Universe at . Based on simple estimates, we find that COLA1 could have provided just enough photons to reionise its own pMpc (2.3 cMpc) bubble, allowing the blue Ly line to be observed. However, we also discuss alternative scenarios explaining the detected double peaked nature of COLA1. Our results show that future high-resolution observations of statistical samples of double peaked LAEs at are a promising probe of the occurrence of ionised regions around galaxies in the EoR.
Key Words.:
Galaxies: high-redshift – Techniques: spectroscopic – Cosmology: dark ages, reionisation, first stars – Galaxies: formation – Galaxies: intergalactic medium1 Introduction
The epoch of reionisation (EoR) is the last phase transition of the Universe. It occurred when the neutral hydrogen of the intergalactic medium (IGM) became reionised (e.g. Madau, 2017). In spite of the increasingly precise measurements of the global progress of reionisation and its patchiness (e.g. Becker et al., 2015; Davies et al., 2018; Bañados et al., 2018; Bosman et al., 2018), its evolution and drivers are still largely unknown. One of the main probes of reionisation is the Lyman- (Ly) line (see Dijkstra et al. 2007 for a review). Due to the low Ly transmission in a partially neutral IGM, the progress of reionisation can be mapped out using the strength of detected Ly emission. This is usually done through the equivalent width distribution among high-redshift galaxies (e.g. Pentericci et al., 2014; Mason et al., 2018a), through the evolution in the luminosity function (e.g. Zheng et al., 2017) and/or its clustering signal (e.g. Jensen et al., 2014; Kakiichi et al., 2018).
Recently, wide-field narrow-band surveys have been highly efficient in identifying and confirming luminous Lyman- emitters (LAEs) into the EoR (; e.g. Matthee et al. 2015; Hu et al. 2016; Santos et al. 2016; Bagley et al. 2017; Zheng et al. 2017; Shibuya et al. 2018). The number densities of extremely luminous LAEs at (L erg s-1) are higher (Matthee et al., 2015; Bagley et al., 2017) than expected based on older, smaller surveys (e.g. Ouchi et al., 2010). While the number densities of faint LAEs decrease by 0.5 dex at (Ouchi et al., 2010), the number densities of the most luminous sources are relatively constant between (e.g. Santos et al., 2016; Zheng et al., 2017), or decrease only slightly by dex (e.g. Konno et al., 2018). These luminous sources likely reside in early ionised bubbles (Hu et al., 2016; Stark et al., 2017; Mason et al., 2018b), facilitating their Ly observability during the EoR (e.g. Matthee et al., 2015; Weinberger et al., 2018; Songaila et al., 2018).
Due to their luminosity, luminous LAEs are ideal for spectroscopic follow-up (e.g. Sobral et al., 2015; Hu et al., 2016; Matthee et al., 2017a; Shibuya et al., 2018). The most Ly-luminous example among these sources at is CR7 (Sobral et al., 2015, 2017a). CR7 has spectacular properties: strong, narrow Ly emission (EW Å), intense H and/or [Oiii] emission (Bowler et al., 2017) and there are indications of strong high-ionisation rest-frame UV emission lines such as Heii (Sobral et al., 2017a). High resolution HST and ALMA observations reveal multiple components in the rest-frame UV separated by kpc and spatially and spectrally resolved [Cii] FIR cooling-line emission (Matthee et al., 2017b), indicating the build-up of a central galaxy through accretion of satellite galaxies.
Recently, Hu et al. (2016) presented the spectroscopic confirmation of a potentially even more luminous LAE at , ‘COLA1’, with an unexpected double peaked Ly line-profile. The presence of multiple peaks in COLA1 had been unprecedented in LAEs (e.g. Matthee et al., 2017a; Shibuya et al., 2018), but Songaila et al. (2018) show that roughly a third of a sample of extremely luminous LAEs at may have such complex line shapes. The transmission on the blue part of the Ly line is typically very low (e.g. Dijkstra et al., 2007; Laursen et al., 2011), particularly due to residual neutral hydrogen in the halos of galaxies (e.g. Mesinger et al., 2015) and the increasing neutral fraction of the inter galactic medium (e.g. Hu et al., 2010).
Several effects help to increase the observability of Ly at high redshift: (i) the redshift of the Ly line with respect to the surrounding gas (e.g. due to outflows), and (ii) the Hubble expansion that may redshift the Ly line out of the resonance frequency of the neutral gas, thus lowering the optical depth in case the galaxy is surrounded by a large, highly ionised region.
However, due to the large-scale infall of gas which shifts the absorption km s-1 towards the red, combined with the extended wing of the absorption profile of the highly neutral IGM, simulations and analytical models expect that even the red part of the Ly emission is diminished significantly (e.g. Haiman, 2002; Mesinger et al., 2004; Dijkstra et al., 2007; Laursen et al., 2011; Mesinger et al., 2015; Sadoun et al., 2017; Weinberger et al., 2018). Furthermore, radiative transfer processes in the interstellar medium (ISM) even shift the blue peak to lower velocities; e.g. Neufeld 1990. Therefore, a detection of intrinsically blue-shifted Ly emission above is theoretically unexpected (e.g. Mason et al., 2018a).
Since the transmission of the blue part of the Ly line depends directly on the ionisation state of the environment of the emitting galaxy, COLA1 could open up a completely new probe of reionisation, if the detection of the blue Ly line is confirmed. With a larger sample, the evolution of the Ly line asymmetry (i.e., comparing the blue and red fluxes) can be quantified more robustly, adding an interesting additional observable to the evolution of LAE clustering and EW. Interestingly, the Ly peak separation correlates strongly with the escape of Lyman-Continuum (LyC) radiation (e.g. Verhamme et al., 2015; Vanzella et al., 2018; Izotov et al., 2018). Therefore, COLA1 could also provide the first direct evidence that galaxies actively contribute to the reionisation of the Universe.
However, the double peaked line could also mean that COLA1 is an [Oii]3727,3730 emitter at (see Songaila et al. 2018 for a detailed investigation on the fraction of such interlopers). We therefore test whether the line may have been misinterpreted, in which case COLA1 is a low-redshift interloper, and not a LAE at . Because of the unique potential of the COLA1 galaxy, we investigate its nature independently using our own narrow-band data (from Sobral et al. 2013, not used in Matthee et al. 2015), new high spectral resolution VLT/X-SHOOTER observations covering a wavelength range from to m and the wealth of public available data from the COSMOS survey which were not explored in Hu et al. (2016).
In this work, we first summarise the available photometric information and present the new X-SHOOTER observations in §2. We analyse the spectrum in detail and conclude on the redshift of COLA1 in §3. §4 presents the properties of COLA1 that we measure from the spectroscopic and photometric data available. We discuss the implications in §5 and summarise the results in §6. Throughout this work we adopt a flat CDM cosmology with , and H km s-1 Mpc-1, a Salpeter (1955) initial mass function and magnitudes in the AB system (Oke, 1974).
2 Data
2.1 Photometric measurements
COLA1 (Hu et al., 2016) is located in the COSMOS field (Capak et al., 2007; Scoville et al., 2007) and hence public imaging data are available in filters from the UV to IR (e.g. Ilbert et al., 2009). This includes high resolution data in the F814W filter from the Hubble Space Telescope (HST)/Advanced Camera for Surveys (Koekemoer et al., 2007). COLA1 is located in a shallow region from the UltraVISTA survey (McCracken et al., 2012) and is covered by Spitzer/IRAC imaging from the SPLASH program (e.g. Steinhardt et al., 2014)111http://splash.caltech.edu. We use optical data from CFHT/Megacam, Subaru/Suprime-cam (Taniguchi et al., 2007)222Available through http://irsa.ipac.caltech.edu/data/COSMOS/ and near-infrared data from UltraVISTA DR3. COLA1 is furthermore covered in Subaru/Suprime-cam NB921 images from Sobral et al. (2012, 2013), similar to the NB921 imaging from Hyper Suprime-Cam from Hu et al. (2016). We show thumbnail images in the , , , NB921, F814W, , , , [3.6] and [4.5] bands in Fig. 1, where red contours illustrate the location of line-emission (measured from the NB921- image). We note that we have confirmed the astrometric alignment of the different images using the position of stars and galaxies around COLA1. Our photometric measurements are summarised in Table 1. The measurements on ground-based images in bands blue-wards of 900 nm are conducted with 1.2′′ diameter apertures optimised to estimate the S/N of potential detections. Measurements in NB921, , , and are performed with 2′′ diameter apertures.
2.1.1 NB921 Narrow-band data
Combining the Suprime-cam NB921 narrow-band data (Sobral et al., 2013) with public band data, we measure a total line-flux of erg s-1 cm-2. As the mean transmission of the NB921 filter is 69 % at the wavelength where the emission-line is detected, we correct this line-flux to erg s-1 cm-2. Spreading this line-flux over the width of the band filter results in , meaning that the full band flux can be explained by line-emission. We use the band (, , measured in a 2′′ diameter aperture and applying an aperture correction of mag) to obtain a weak constraint on the observed equivalent width of EW Å assuming a UV slope . The band magnitude is in good agreement with the measurement in Hu et al. (2016) based on Subaru data. The line-flux we measure is a factor lower than Hu et al. (2016). We have checked that this is not due to the use of a smaller aperture (2′′ used here versus 3′′ diameter in Hu et al. 2016), as using a 3′′ aperture would only increase the flux by 10 %. We note that our photometry in 3′′ apertures is consistent with Hu et al. (2016), meaning that the difference is due to the method to calculate the line-flux.
2.1.2 Ground-based optical data
Visual inspection of the thumbnail images reveals potential detections in the and filters. While the potential flux in the band is offset, this is not as clear in the band. We measure the significance of the flux in the band by performing photometry centred on the NB921 detection in an optimised 1.2′′ diameter aperture. We choose such small aperture to optimise the S/N ratio (the PSF-FWHM of this data is ) and minimise contamination from nearby objects. 333We note that we do not use measurements with different apertures to measure colours. The noise level is measured from the standard deviation of 1000 empty aperture measurements located on random sky positions around COLA1. We measure flux at the 2.4 level with (see Fig. 1, where we use a high contrast to highlight potential detections). No flux above the 2 level is detected in the , , and filters using the same aperture centered on COLA1. We measure flux at the 2 level in the stacked image. While the significance levels of these measurements is low, they may be troublesome for a galaxy at , motivating the need for careful spectroscopic analysis.
2.1.3 High resolution optical data
The HST imaging in the F814W filter (with % transmission between Å, Å, PSF-FWHM ; Koekemoer et al. 2007) reveals a faint point-like detection at the position of COLA1 (Fig. 1). Similarly to the and imaging, F814W imaging also clearly shows another source 1.2′′ south-west of COLA (identified in the HST thumbnail in Fig. 1). This object has ID 593625 in the Laigle et al. (2016) catalogue (with photometric redshift ) and we will refer to it with that ID from now on. COLA1 is detected at 3, with measured in a 0.6′′ diameter aperture and corrected for aperture losses using tabulated encircled fluxes from Bohlin (2016). ID 593625 has a F814W magnitude of . If continuum flux at this level contributes to the NB921 photometry it could contribute to the 10 % increase in the line-flux of COLA1 measured with 3′′ apertures.
| Coordinates | |
|---|---|
| R.A. | 10:02:35.37 (J2000) |
| Dec. | +02:12:13.9 (J2000) |
| Photometry | |
| F814W | |
| NB921 | |
2.1.4 Photometric redshift and the Spitzer/IRAC view
COLA1 is present in the public COSMOS2015 catalogue (Laigle et al. 2016; ID 593751), where it has a photometric redshift of . However, the photometry that is used to estimate this redshift is measured with 2′′ diameter apertures and may suffer contamination from ID 593625. We re-measure the photometry in the Spitzer/IRAC and filters using SPLASH data. We follow the procedure as last described in Stefanon et al. (2017), where the IRAC images are de-confused based on the HST/F814W images using the mophongo software (Labbé et al., 2006, 2015). We measure and in 1.8′′ diameter apertures and including an aperture correction as described in Labbé et al. (2015), see Fig. 1. This results in a moderately blue colour , although with significant uncertainties (see also Harikane et al. 2018, who measure ).
2.2 X-SHOOTER spectroscopic observations & data reduction
We observed COLA1 with the X-SHOOTER echelle spectrograph on UT2 of the Very Large Telescope as part of ESO program 0100.A-0213 (PI Matthee). X-SHOOTER observes in three arms simultaneously: UVB (m), VIS (m) and NIR (m). Observations were performed on 19 January and 18-19 February 2018 with clear conditions and seeing. GD71 was observed as telluric standard star. We used a 1.0′′ slit in the UVB arm and 0.9′′ slits in the VIS and NIR arms.
We first acquired on a magnitude star and then applied a blind offset of 95.86′′ to the position of COLA1 with a position angle of 0 degrees (see Fig. 1). We nodded between two positions along the slit (A and B, offset by 3′′) using the AutoNodOnSlit procedure. Integration times were 700 and 780s for UVB and VIS arms respectively. Four shorter jitters with separations of 1′′ along the direction of the slit were used for NIR exposures of 210s. This observing sequence was repeated ten times (split over two observing blocks with ABBA sequence and one with an AB sequence), resulting in total exposure times of 7.0, 7.8 and 8.4ks for the three arms respectively.
Data are reduced using standard procedures (bias and dark subtraction, flat-fielding, sky subtraction, wavelength calibration and flux calibration) incorporated in the X-SHOOTER pipeline (Modigliani et al., 2010). Individual exposures per observing block are combined using the pipeline. We then combine exposures over multiple observing blocks by computing the noise-weighted average as described in detail in Sobral et al. (2018b). Before extracting 1D spectra, we first smooth the spectrum with 2D gaussian kernels that corresponds to half the resolution ()UVB,VIS = (0.4 Å, 0.32′′) and ()NIR = (0.6 Å, 0.21′′), and bin it in the wavelength direction by 3 pixels (0.6 Å, half the resolution). The spatial extraction window in the VIS arm is 2.2′′ which we find to optimise the S/N. Slit losses of the line at 922 nm are estimated using the NB921 image that is convolved to the PSF-FWHM of our spectroscopic observations. We measure the fraction of the total flux that is retrieved within the slit and extraction window. As COLA1’s line-emission is compact in the NB921 data, the estimated slit losses are only 19 %. The spatial extraction windows in the UVB and NIR arms are 1.2′′ and we do not apply slit loss corrections. Wavelengths are converted to vacuum wavelengths. We measure the effective spectral resolution using unresolved skylines on our extracted 1D spectrum. We find at 0.5m, at m and at m, corresponding to 75, 60 and 80 km s-1, respectively.
2.3 Spectroscopic measurements
In our X-SHOOTER spectrum, we confirm COLA1’s double peaked emission line at Å (), but we also detect faint emission-lines at Å () and Å (). The centroid of these faint emission-lines is however shifted spatially by 1′′ to the west and are therefore not co-located with COLA1 (Fig. 1). We do not detect continuum emission. No other lines are detected in the m coverage above .
For the double peaked emission-line at 923nm, we measure a line-flux of erg s-1 cm-2 and a relative flux ratio between the blue and red component of . The red line has a full width half maximum (FWHM) of km s-1, while the blue line is narrower with FWHM= km s-1. While the red line is clearly asymmetric (with a weighted skewness of Å; following the definition from Kashikawa et al. 2006), the blue line is not ( Å). Our measurements are summarised in Table 2. The spectroscopically measured flux differs from the narrow-band measurement at the level, potentially due to systematic uncertainty in the flux calibration or the aperture correction. For the remainder of the paper we use the narrow-band flux corrected for the filter transmission.
The line at 3821 Å has a line-flux of erg s-1 cm-2 and FWHM km s-1. The line that is observed at 15735 Å has a line-flux of erg s-1 cm-2 and a width FWHM km s-1. The spatial offset of of these lines coincides with ID 593625.
| Observations | COLA1 |
|---|---|
| Dates | 19 Jan 2018, 18-19 Feb 2018 |
| 5000 | |
| 3800 | |
| t | 7.0ks |
| t | 7.8ks |
| t | 8.4ks |
| 923 nm line properties | |
| Fluxspec | erg s-1 cm-2 |
| FluxNB | erg s-1 cm-2 |
| EWobs | Å |
| Peak separation | km s-1 |
| FWHMred | km s-1 |
| FWHMblue | km s-1 |
| Fluxblue/Fluxred | |
| Å | |
| Å | |
| Å | |
| Flux limits of interest | |
| H | erg s-1 cm-2 |
| [Oiii] | erg s-1 cm-2 |
| [Oiii] | erg s-1 cm-2 |
| Civz=6.591 | erg s-1 cm-2 |
| Heiiz=6.591 | erg s-1 cm-2 |
3 Is COLA1 a LAE at or an [Oii] emitter at ?
The tentative detection in the band (although at the level) and the unexpected observation of Ly flux blue-wards of the red asymmetric line might suggest that COLA1 may not be a LAE at , but an [Oii] emitter at instead. Here, we assess the implications of each observed feature to test this hypothesis.
3.1 923nm line strength and consistency with F814W
If the 923nm line from COLA1 is [Oii], it would yield and it would have a high luminosity (L; Khostovan et al. 2015). The [Oii] equivalent width would be extreme, EW Å, well above the typical EW for [Oii] emitters (EW Å) at (Khostovan et al., 2016).
We test whether the F814W photometry can be explained by pure line-emission. Assuming negligible contribution from continuum emission and by spreading the line-flux homogeneously over the full transmission region of F814W results in F814W. Hence, the F814W photometry (we measure F814W) can be perfectly explained by pure line-emission and does not indicate flux blue-wards of the emission-line. Therefore, the F814W detection does not rule out Ly at .
3.2 Line-detections at 382nm and 1573.5nm
As described above, we detect two emission-lines that are offset by to the west of COLA1. This corresponds roughly to the foreground source ID 593625 as can be seen in the band thumbnail image (Fig. 1), which shows that outskirts of this galaxy fall in the X-SHOOTER slit. We identify the two lines as Ly and [Oiii]5007 at , as illustrated in Fig. 2, where we have optimised the centroid of spatial extraction aperture for these lines. Ly is redshifted by km s-1 with respect to the systemic redshift, similar to other LAEs at (Trainor et al., 2015; Sobral et al., 2018b). Without correcting for slit losses, we measure a Ly luminosity of erg s-1, well below the typical Ly luminosity at (; Sobral et al. 2017b). The band magnitude corresponding to pure line-emission at this flux-level is . Ly emission extends to close to the peak position of COLA1 and could thus contribute significantly to the faint band detection () at the COLA1 position. The [Oiii]5007 luminosity is erg s-1. We note that the centroid of the (low S/N) flux in the - near COLA1 is shifted slightly towards a faint band detection that could be explained by this [Oiii] flux. Therefore, several detections in the images (in particular and ) can be attributed to LAE 593625 at .
3.3 923nm line-profile
We show a detailed zoom-in figure of the line-profile of the 923nm line in Fig. 3. In this figure, we shift the spectrum to the rest-frame assuming COLA1 is at . We compare it to a median [Oii] spectrum of galaxies with asymmetric red lines and high red/blue ratios from the VIS3COS survey (Paulino-Afonso et al., 2018a) and also show the best fitted [Oii] doublet. While the peak separation ( km s-1) is fully consistent with the peak separation of the [Oii] doublet, the asymmetry of the red line can not be fitted as an [Oii] doublet. In particular, the blue line would have been expected to be asymmetric as well, similar to the red line. Moreover, the absence of flux between the two lines can also not easily be explained in the case of an [Oii] doublet, unless lines are very narrow.
The skewness of COLA1’s red line is high ( Å; see Table 2), much higher than the typical maximum skewness of a low-redshift galaxy ( Å; Kashikawa et al. 2006), which is similar to the skewness of the full doublet. Finally, the line-ratio between [Oii]3726 and [Oii]3730 would be significantly lower than the line-ratio in our extreme [Oii] emitter reference sample (with a blue-to-red fraction of ). In fact, the line-ratio of the blue and red lines of our best-fit (0.44) is significantly lower than the theoretical minimum line-ratio for electron densities as low as 1 cm-3 ( for an electron temperature of 104 K; Sanders et al. 2016, but also for temperatures between K) and thus unphysical. Therefore, the line-profile strongly disagrees with COLA1 being an [Oii] emitter at even though the peak separation is in perfect agreement.
3.4 No line in the NIR associated with
As we show in Fig. 4, we do not detect H or [Oiii]5007 if COLA1 would be at . We illustrate how these lines would look in our data for the lowest empirical H/[Oii] and [Oiii]/[Oii] line-ratios (e.g. Hayashi et al., 2013). These extreme line-ratios would imply both high metallicities and high ionisation states (properties that are typically anti-correlated; Nakajima & Ouchi 2014). If we conservatively assume the spectroscopic flux of the 923nm line and a FWHM of 200 km s-1 (similar to the red line at 923nm), we measure a 1 limit on the H flux of erg s-1 cm-2 and a lower limit of erg s-1 cm-2 on the combined [Oiii]4959,5007 line. While the lowest [Oiii]/[Oii] ratio is within the 1 noise level, these data rule out H/[Oii] at , additional clear evidence against the interpretation that COLA1 is an [Oii] line at .
3.5 Concluding remarks on the redshift of COLA1
As the line-profiles of the red and blue lines differ, the double peaked emission line around 923nm can not be fitted by an [Oii] doublet, even though the peak separation is similar444As we show in Section 4, the Ly line profile is well-fitted by a Ly shell model and shows properties similar to normal LAEs at .. Photometric indications for COLA1 being at low-redshift (in particular and F814W detections) are explained due to line-emission from COLA1 itself (F814W) and a foreground LAE at close separation (ID 593625 at ). The relatively blue Spitzer/IRAC colours, combined with a optical to near-infrared break of are also not indicative of a red dusty or old interloper at a lower redshift. Finally, if COLA1 would have been an [Oii] emitter at the flux ratio of the lines in the [Oii] doublet and the limits on [Oii]/H indicate unphysical conditions. Combining all the observations from above, we conclude that COLA1 is best explained as a double-peaked LAE at , as initially proposed by Hu et al. (2016) and corroborated by Songaila et al. (2018).
4 Properties of COLA1 – a unique LAE at
Now we have established that COLA1 is a real LAE at , we can have a better look at its properties based on the X-SHOOTER spectrum and available imaging data. The properties are summarised in Table 3.
4.1 Ly luminosity and spectral energy distribution
The transmission-corrected narrow-band magnitude implies a Ly luminosity of L erg s-1, which is among the most luminous LAEs know at (see a compilation in Matthee et al. 2017a). The Ly EW is high (EW Å, based on the continuum estimated from the band flux), but this is a rather common property of LAEs at high-redshift (e.g. Hashimoto et al., 2017; Sobral et al., 2018a) and we note that it is poorly constrained due to uncertainties on the continuum magnitude. The Ly luminosity implies a comoving number density Mpc-3 (Matthee et al., 2015).
COLA1 is weakly detected in the and bands ( and , respectively), see Fig. 1. An off-centred band detection is likely contaminated by strong [Oiii]4959,5007 emission from the foreground galaxy at , and we can only provide a 2 limit on the magnitude of . COLA1 is undetected in the band (). Due to the large uncertainties in the photometry no meaningful constraints can be obtained on the UV slope, and we assume a flat UV slope in the rest of the paper (this is similar to other LAEs at ; Ono et al. 2010; Matthee et al. 2017a).
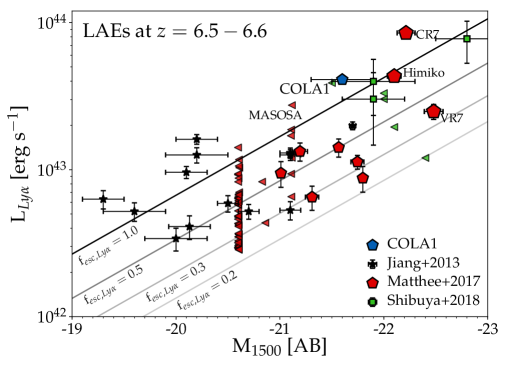
The band magnitude implies an absolute magnitude , slightly above M at (Bouwens et al., 2015), but fainter than other luminous LAEs at (e.g. CR7 and VR7; Matthee et al., 2017a), see Fig. 5. Following Shibuya et al. (2015), such a UV luminosity indicates M M⊙ at , although this could be significantly underestimated in case the source is strongly dust-obscured (which however is at odds with its strong Ly emission; e.g. Matthee et al. 2016). The narrowness of the Ly line indicates that COLA1 is likely a star-forming galaxy, as AGN typically have broader Ly lines (e.g. Matsuoka et al., 2016). COLA1 is unlikely to be significantly magnified: no massive foreground structures are known and no distortions are seen on the images.
COLA1’s colours in the shortest Spitzer/IRAC channels are blue, . This is likely a consequence of H and/or [Oiii] slightly boosting the [3.6] flux more than H is boosting the [4.5] flux (which is in a low transmission wavelength of the [4.5] band). However, COLA1 is not nearly as blue as other confirmed galaxies at . For example, CR7 and Himiko have colours and , respectively (Harikane et al., 2018). This could indicate that COLA1’s [Oiii] line is relatively weaker due to a lower metallicity. When we compare this colour to the predicted colours at using photoionisation analysis and BPASS SED models presented in Bowler et al. (2017), we find that the implied metallicity lies between , but always consistent with within the uncertainties. Alternatively, the IRAC colour could also indicate that an older stellar population is present in COLA1, or that the strength of nebular lines is lower due to a high LyC escape fraction (e.g. Zackrisson et al., 2017).
4.2 Ly size and star formation rate density
As discussed in §3, the detection of COLA1 in the F814W band can be explained by pure Ly emission. As the HST/ACS imaging has a small PSF, we can therefore use these data to constrain the size of the Ly emitting region in COLA1 accurately (e.g. Paulino-Afonso et al., 2018b). We use a non-parametric method to measure the median half-light radius (r50,obs) for 5000 random realisations of the image, where each pixel count is drawn from a Poissonian distribution. Then, we correct for PSF-broadening using , where kpc. This results in kpc. This size is smaller than typical UV-selected galaxies with M, similar to galaxies with M in the UV luminosity - size relation from Shibuya et al. (2015) and similar to the largest star cluster complexes (Bouwens et al., 2017; Vanzella et al., 2017). As the UV sizes of galaxies are typically much smaller than the Ly sizes (e.g. Wisotzki et al., 2016), it could be possible that the galaxy is even more compact in the UV. On the other hand, it is likely that more diffuse Ly emission is resolved out in the broad, high resolution F814W image (similar to e.g. in CR7; more luminous, extended Ly emission that is undetected in similar F814W data), and that the core Ly profile resembles the UV profile. Ly emission is expected to be compact in galaxies with a low Hi column density and high fesc,LyC (Mas-Ribas et al., 2017) – conditions that are likely present in COLA1 as discussed next.
We can estimate the SFR of COLA1 from the UV continuum or from the Ly luminosity. Assuming a UV slope and a Meurer et al. (1999) attenuation law, we find a dust-corrected SFR M⊙ yr-1 ( M⊙ yr-1 without correcting for dust). Alternatively, the Ly luminosity indicates SFR M⊙ yr-1 (assuming a 60 % Ly escape fraction and 15 % LyC escape fraction; following Sobral & Matthee 2018).
If we assume that the UV size is similar to the Ly size, these measurements imply a minimum average SFR surface density M⊙ yr-1 kpc-2. This number would be higher if the UV size is more compact or if significant dust attenuation is present. This is significantly higher than other galaxies known at (e.g. Carniani et al., 2017). The SFR surface density is well above the threshold required to drive galactic outflows (e.g. Heckman et al., 2001), hence such outflows may well be present.
| Property | Best estimate |
|---|---|
| Spectral analysis | |
| LLyα | erg s-1 |
| EW0,Lyα | Å |
| M1500 | |
| Mstar | M⊙ |
| kpc | |
| % | |
| SFRLyα | M⊙ yr-1 |
| SFRUV,nodust | M⊙ yr-1 |
| M⊙ yr-1 kpc-2 | |
| Gas-phase metallicity | |
| Shell model fitting | |
| vexp | km s-1 |
| log10(NHI/cm | |
| log10(T/K) | |
| km s-1 | |
4.3 Ly line properties and modelling
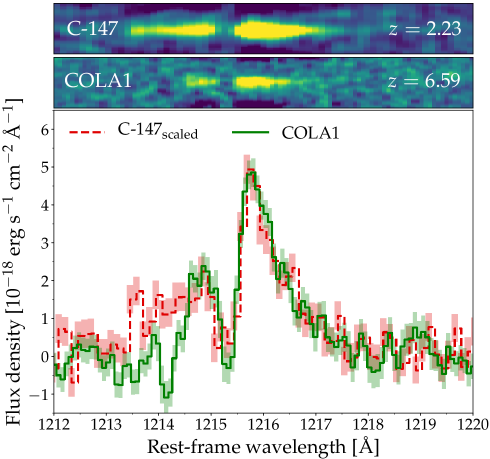
In Fig. 6 we show COLA1’s rest-frame spectrum assuming (the redshift of the red peak) and compare it to the luminous LAE C-147 (a Ly-selected star-forming galaxy at for which a blue peak is also detected in the Ly spectrum and the systemic redshift is confirmed through H and [Oiii] emission; Sobral et al. 2017b, 2018b). The red part of the Ly line of C-147 resembles the red asymmetric line in COLA1 very well. C-147 has a broader blue line, but the peak separation and the fact that there is no significant flux at line-centre is similar to COLA1.
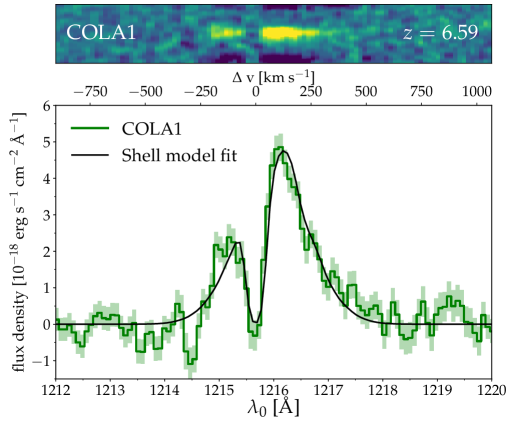
If we assume that the transmitted Ly flux is zero at line-centre (in between the two peaks; e.g. Yang et al. 2017), we measure a systemic redshift for COLA1. The peak separation of the blue and red Ly lines is km s-1. In LyC leaking galaxies in the local Universe, the peak separation is anti-correlated with the amount of leakage of LyC photons (Verhamme et al., 2015, 2017). If this correlation would hold up to , we would infer f % for COLA1, but potentially up to f % if we compare to the most recent results (Izotov et al., 2018). A comparison of the blue-to-red flux-ratio of local LyC leakers also indicates f % (although we note that the IGM could absorb part of the blue line-flux, see §5). For the rest of the paper we thus conservatively assume f %. Therefore, the likely non-zero LyC escape fraction of COLA1 presents the best direct evidence to date that star-forming galaxies contributed to the reionisation of the Universe at . In fact, as we discuss in §5, such a contribution is required to ionise a large enough region to be able to detect the blue peak at its redshift. The prospects for directly detecting LyC photons at are very low because of the typical opacity in the IGM is high at (Inoue et al., 2014). Moreover, while foreground contamination is a major issue (Siana et al., 2015), measuring the Ly peak separation may be a promising alternative.
4.3.1 Ly spectral modelling
In order to get a more quantitative view of the ISM properties implied by the observed Ly line, we fit the Ly profile of COLA1 using a five-parameter shell model as in Dijkstra et al. (2016). This model (e.g. Ahn et al., 2001; Verhamme et al., 2006) consists of a shell of neutral gas and dust around a central ionising source and parameters include the Hi column density, expansion velocity, temperature and dust optical depth of the shell and the intrinsic width of the Ly line (Gronke et al., 2015). This fit does not include transmission through the IGM.
The best fitted parameters are listed in Table 3. Compared to LAEs (Gronke, 2017), these parameters indicate a relatively low Hi column density N cm-2 and a high dust optical depth , while the other parameters are quite common for LAEs. The low Hi column density is inferred from the low peak separation and suggests the possible escape of LyC photons. The high dust optical depth could alternatively be interpreted due to IGM opacity that could lower and narrow the blue peak. The Hi column density and expansion velocity are also significantly lower than the inferred column density around CR7 (e.g. Dijkstra et al., 2016). We note that the shell-model prediction of the systemic velocity of CR7 presented in Dijkstra et al. (2016) agrees perfectly with recent [Cii] measurements in Matthee et al. (2017b), suggesting that shell-model fitting is a good tool to recover the systemic redshift of a LAE at high redshift. The column density is also significantly lower than the column density inferred from absorption line measurements in local LyC leakers (Gazagnes et al., 2018), which lead these authors to conclude that the Hi covering fraction in these galaxies is non-uniform. A relatively high column density in these local LyC leakers is consistent with their larger Ly peak separation compared to COLA1, and their typical escape fraction of %.
As detailed in Verhamme et al. (2015), the Ly line profile can be used as a tracer of as both are sensitive to Hi column density as N where cm2 is the ionisation cross section. According to this equation, the column density derived from the shell-model fit (see Table 3) implies %. This is consistent with the result one would infer by using the correlation between Ly EW0 and fesc,LyC at (Steidel et al., 2018), although we note this correlation has not been tested beyond EW Å and likely breaks down due to a reduced Ly strength in the high fesc,LyC regime. The Ly EW also points towards a 30 % escape fraction as implied by comparison with the most recent measurements in local LyC leakers (Izotov et al., 2018). Such high escape fractions would also affect the strength of nebular emission lines such as H and H and could therefore be tested with future spectroscopic observations with the James Webb Space Telescope (e.g. Jensen et al., 2016; Zackrisson et al., 2017). Indeed, the fact that COLA1 shows a colour that is much closer to zero than other luminous LAEs at the same redshift could potentially indicate a reduced strength of nebular emission lines, see §4.1.
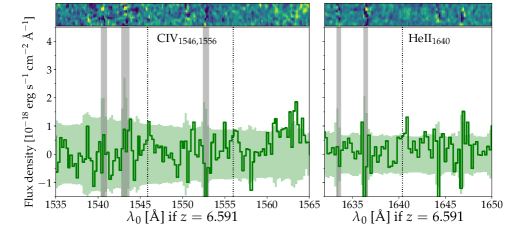
4.4 High ionisation rest-UV emission-lines
Thanks to the wavelength coverage of the X-SHOOTER spectrum, we can inspect the spectrum for the presence of strong rest-UV emission line features (e.g. Stark et al., 2015); see Fig. 8. We do not detect a significant feature besides Ly. We measure 2 limiting line-fluxes of and erg s-1 cm-2 for the Civ1546,1556 and Heii1640 emission lines at , respectively (over 250 km s-1 extraction boxes), corresponding to EW Å and EW Å. These non-detections are not surprising given the fact that the limits are shallower than other unsuccessful spectroscopic follow-up of LAEs at (e.g. Shibuya et al., 2018), and EW limits are higher than detections in e.g. Stark et al. (2017).
|
|
|
|---|
5 Discussion: witnessing a galaxy reionising its surroundings
5.1 The unlikelihood of observing a blue Ly line at
Ly photons resonantly scatter in the presence of neutral hydrogen. Once Ly photons are absorbed, they are re-emitted in a random direction in the rest-frame of the absorbing hydrogen atom, resulting in a diffusion process in real and frequency space. Analytical models show that this process results in a double peaked Ly spectrum in a static medium (e.g. Neufeld, 1990). In the presence of outflows, Ly photons see a larger optical depth towards the blue, resulting in a redshifted asymmetric spectrum. Hence, the Ly profile is sensitive to the neutral hydrogen content and the velocity field of the gas in a galaxy (e.g. Loeb & Rybicki, 1999; Santos, 2004; Dijkstra et al., 2007).
After escaping from the ISM, Ly photons are also affected by Hi in the circum-galactic medium (CGM). The CGM predominantly transmits red Ly photons, enhancing the asymmetry between the red and the blue peak (e.g. Laursen et al., 2011). This is consistent with observations at high-redshift (), where high Hi column densities in the CGM result in a majority of Ly profiles that consist of a single, red asymmetric line (e.g. Erb et al., 2014). Due to the increasing neutral fraction of the IGM, the asymmetry between the transmission of the red and blue line increases and the chances of observing double peaked emission decrease.
This is also found in semi-analytical and hydrodynamical models of the EoR, which typically predict negligible transmission bluewards of the systemic velocity at (Dijkstra et al., 2007; Laursen et al., 2011; Weinberger et al., 2018). In the radiative transfer simulations from Laursen et al. (2011) the median IGM transmission at the blue peak is % only at , while it is % at (similar to more recent simulations by Weinberger et al. 2018). Given that these models predict such low transmission bluewards of the systemic redshift, how is it possible that we observe a strong blue peak in the Ly profile of COLA1 at , a redshift where this is highly unexpected? Here, we propose three scenarios that facilitate the transmission of blue Ly photons and that may explain COLA1’s Ly profile.
5.2 Three scenarios to explain double peaked Ly emission at
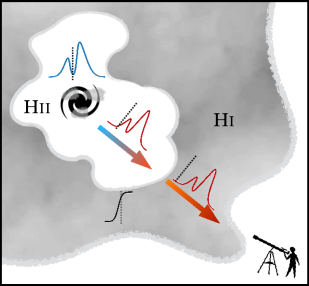
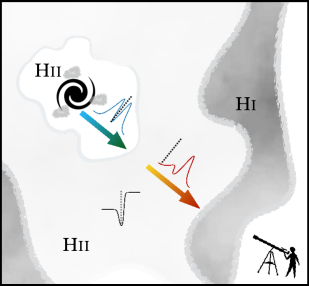
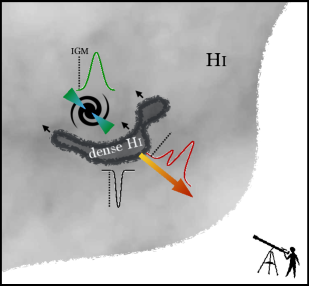
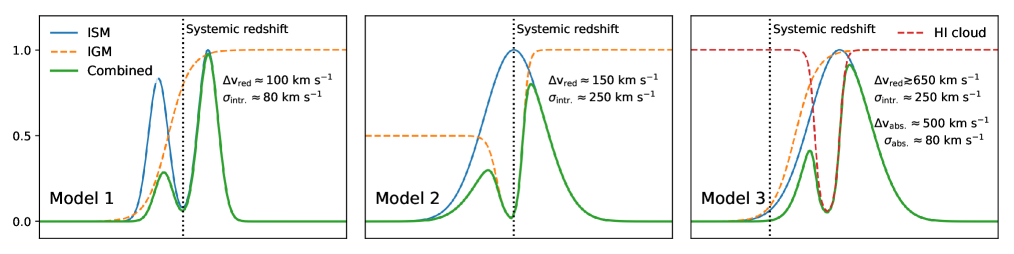
In Fig. 9, we sketch three different physical scenarios that may explain the Ly profile of COLA1. We first describe these models and then we propose observations that may test and differentiate between them. We note that the transmission, line-widths and offsets in Fig. 9 are chosen for illustrative purposes.
In Model 1, COLA1 is surrounded by a highly ionised bubble that is large enough for Ly photons to redshift out of resonance due to the expansion of the Universe before encountering a relatively neutral IGM (e.g. Haiman, 2002; Hu et al., 2016). The Ly profile is therefore only determined by the ISM conditions of the galaxy. In Model 2 the bubble itself is smaller, but is embedded in a larger relatively ionised region. The Ly profile here is mostly affected by the gas in the CGM and IGM. Model 3 attempts to explain COLA1’s Ly profile without invoking IGM attenuation, but rather by an infalling self-shielded cloud of neutral hydrogen. This neutral hydrogen cloud absorbs part of the emitted Ly line, resulting in a double peaked spectrum.
5.2.1 Model 1: Large, highly ionised bubble in a neutral IGM
If COLA1 resides in a large, highly ionised region, it is possible that blue Ly photons redshift out of the resonance wavelength due to the Hubble expansion prior to encountering a neutral IGM (e.g. Malhotra & Rhoads, 2006). Depending on the size of this highly ionised region, it is possible that only (part of) the blue peak is attenuated (e.g. Haiman, 2002). In the left panel of Fig. 9, we illustrate this scenario where a double peaked Ly line escapes from the ISM of the galaxy (resulting from resonant scattering effects, e.g. Neufeld 1990; Gronke et al. 2017), before the blue part of the line is attenuated by a sigmoid transmission function of the IGM.
The Ly photons in the blue peak of COLA1 need to redshift out of the resonance wavelength by at least km s-1 (the maximum velocity at which we observe blue Ly flux compared to line-centre, see Fig. 7) before encountering significant amounts of neutral hydrogen. This requires a large ionised region. Ignoring peculiar velocities of inflowing gas, we can calculate the required size as follows:
| (1) |
Here, dprop is the proper distance photons are required to travel, the required velocity offset and is the Hubble parameter at , which is km s-1 Mpc-1 in our assumed cosmological model. Therefore, in order for Ly photons to redshift by km s-1 would require an ionised sightline/region of at least 0.3 pMpc; or cMpc. Simulations indicate that this bubble-size is similar to the characteristic bubble size for a global ionised fraction of % (e.g. Furlanetto et al., 2006; Lin et al., 2016). As the ionised region needs to be at least 0.3 pMpc, and could be larger, this means the bubble size of COLA1 would correspond to a mean IGM at . On the other hand, the bubble around COLA1 may also be an outlier as COLA1 is likely a relatively massive galaxy. This could imply a higher neutral fraction.
Can such an ionised region be explained using the observed properties of COLA1? Following Haiman (2002), we estimate the maximum proper radius of the ionised region around a galaxy (in the absence of neighbouring ionising sources and ignoring recombinations):
| (2) |
Here, is the radius of the Strömgren sphere, the escape fraction of ionising photons, the produced number of ionising photons per second and the age of the burst of star formation. As listed in Table 4, we estimate (based on the Ly peak offset), s-1 (based on either the Ly luminosity, or based on the UV luminosity, combined with a ionising photon production efficiency of Hz erg-1; Bouwens et al. 2016) and yr (based on the high Ly EW; e.g. Charlot & Fall 1993) at . This results in pMpc555We note that these uncertainties are the propagated errors corresponding to the UV and Ly luminosities and ignore uncertainties in the age of the burst of star formation and the escape fraction. and pMpc, corresponding to cMpc. The maximum radius would marginally increase by 0.03 pMpc when correcting the UV luminosity for a (high) attenuation .
Therefore, under basic assumptions, the star-formation in COLA1 may provide enough photons that can ionise a large enough region for allowing the blue peak to be observed up to km s-1 from line-centre. However, there are important caveats that require attention. For example, our estimate conservatively assumes that the IGM does not affect Ly photons red-wards of line-centre (as illustrated in the left panel of Fig. 9) and the real required ionised region may have to be significantly larger.
Moreover, the calculation so far also ignores peculiar velocities that typically blueshift Ly photons with respect to neutral gas in the IGM (Laursen et al., 2011). Our calculation also ignores self-shielded neutral regions in the CGM around galaxies, that could be challenging to ionise by the galaxy itself and therefore may form a major source of opacity (e.g. Mesinger et al., 2015; Sadoun et al., 2017). The recent simulations from Weinberger et al. (2018) suggest that these self-shielded regions may be more common for galaxies that reside in halos with M M⊙, for which the fraction of sight-lines that has a significant transmission on the blue side of the systemic redshift is consequently extremely low. Sight-lines with high blue-transmission do exist in a significant fraction of low mass halos (M M⊙). These simulations therefore suggest that COLA1 resides in a low mass halo, unless the ionisation from galaxies themselves have been under-estimated.
Finally, as noted in Haiman (2002), the radius of the ionised sphere is over-estimated in case recombinations are important, for example when the clumping factor in the IGM is high () or the age of the star formation burst is yr. It is thus unclear whether the ionised bubble can also be sustained, in particular when the star formation rate of COLA1 would decline or if the escape fraction would decrease. A solution would be if a quasar or (faint) neighbouring galaxies contribute to the local ionising budget (e.g. Kakiichi et al., 2018). COLA1 is not located nearby a known quasar (Bañados et al., 2016). However, COLA1 is at a relatively close separation to CR7, the most luminous LAE known at . The projected distance on the sky of , which corresponds to a comoving distance of 77 Mpc (proper distance 10.1 Mpc) and the velocity difference is km s-1. No (faint) neighbouring galaxies are known around COLA1 (Bowler et al., 2014; Matthee et al., 2015), although the sensitivity to neighbouring galaxies is limited (corresponding to SFR M⊙ yr-1) and deeper observations are required.
Our calculations differ somewhat from those in Hu et al. (2016), who argue that a change in the Ly properties is expected when the number of escaping ionising photons is s-1 (corresponding to pMpc and hence consistent with our assumptions above). While Hu et al. (2016) find that this is achieved with f % in case of f % and a Ly luminosity erg s-1, we find that this requires a higher escape fraction f % at fixed luminosity. This can be mitigated to f % in case of a slightly higher Ly luminosity and lower Ly escape fraction (see Table 4), indicating that a change in the Ly line properties is still expected around COLA1’s Ly luminosity.
| Property | Value | Motivation |
|---|---|---|
| 15 % | (Conservative) Ly peak separation and blue-to-red flux ratio in local LyC leakers | |
| % | Ly EW calibration, tested at (Sobral & Matthee 2018) | |
| s-1 | Ly luminosity, and (Sobral & Matthee 2018) | |
| s-1 | UV luminosity (no dust correction) and Hz erg-1 | |
| yr | High Ly EW (Charlot & Fall 1993) | |
| pMpc | Velocity offset km s-1 due to expansion of the Universe | |
| pMpc | Eq. 2, assuming no recombinations and ionisation by the Ly source of COLA1 | |
| pMpc | Eq. 2, assuming no recombinations and ionisation by the UV source of COLA1 |
5.2.2 Model 2: Large mildly ionised region
In our second scenario, COLA1 resides in a relatively large ionised region with a high transmission away from line-centre, while the galaxy itself is not able to ionise gas clouds in its direct vicinity, causing the low transmission at line-centre. This scenario is illustrated in the centre panel of Fig. 9. Here, the double peaked emission does not emerge from the galaxy itself, but is caused by the environment of COLA1 that transmits flux at different velocities differentially.
Here, the gas in the CGM of the galaxy still contains significant amounts of neutral hydrogen (e.g. due to self-shielding), while the gas at larger distances from the galaxy is mildly ionised and has a transmission of % at km s-1 from the systemic redshift (similar to the simulated IGM properties at in Laursen et al. 2011). The double peaked emission originates from residual hydrogen in the vicinity of COLA1, absorbing flux around the systemic velocity. In this scenario, the intrinsic Ly profile (that escapes the ISM) is broader than the observed red Ly line, but the resulting blue and red lines have similar widths. While this scenario still requires a highly ionised region (a transmission of 50 % corresponds to , or a mean neutral fraction of at ), less ionising photons originating from COLA1 are required compared to Model 1.
We point out that double peaked Ly profiles with low flux at line centre are the norm among Green Pea galaxies in the local Universe (; e.g. Henry et al. 2015; Yang et al. 2017), emerging from scattering in the ISM. Therefore, it would be a remarkable coincidence if an emerging spectrum at would have a similar profile, but due to the effect of the IGM (and without scattering in the ISM).
5.2.3 Model 3: Large velocity offset and intervening absorber
The last scenario follows an alternative explanation which does not require a strong imprint from the IGM (either highly ionised, neutral, or partly ionised) in the vicinity of the emitting galaxy. Here, the emergent Ly spectrum consists of a significantly redshifted broad peak (e.g. due to an outflow), such that line is not affected by Hi in the CGM or IGM. The right panel of Fig. 9 shows that the double peaked profile originates from an absorbing system on top of this emission profile. This scenario is similar to the ‘cold flow’ scenario that is used to explain the Ly profiles of high-redshift radio galaxies (e.g. van Ojik et al., 1997), but with the difference that the column density is much lower.
The absorbing system could be interpreted as an inflow (e.g. Matsuda et al., 2006), or potentially a wall between two ionised regions (although we note that the IGM in model 3 can also be fully neutral), such as a filament that has not yet reionised (e.g. Finlator et al., 2009). We explore the Hi column density that such an absorber would imply by fitting the line-profile with a voigt profile absorber on top of a gaussian emission line. The upper Hi column density limit is mostly determined by the width of the absorber, which implies a marginally self-shielded column density N cm-2, blue shifted by km s-1 with respect to the peak of the emission. The intrinsic line-width FWHM is km s-1.
How likely is such a scenario? In this model, both observed lines are redshifted with respect to the systemic redshift. This is not seen in galaxies with double peaked Ly emission, where the systemic redshift typically lies between peaks (e.g. Kulas et al., 2012; Henry et al., 2015; Sobral et al., 2018b). Vanzella et al. (2018) identify a luminous system at (M, L erg s-1) that has four Ly components, of which only one is redshifted by km s-1, while the others are either systemic or blueshifted. Multiple redshifted lines are seen in high-redshift radio galaxies (van Ojik et al., 1997), but these lines are typically much broader ( km s-1) and likely a consequence of large amounts of hydrogen present around the massive galaxies that harbour radio AGN. Therefore, unless particular conditions in the EoR are important, this scenario may be quite unlikely.
5.2.4 Summary and predictions
The sketched scenarios in Fig. 9 may be over-simplified and reality may be a combination of different aspects of the models. Even though Models 2 and 3 may be unlikely, some aspects of these models may be combined with the general scenario in Model 1. For example, the absorber from Model 3 could reside in the highly ionised region from Model 1. Other complications would arise if the galaxy is undergoing a major merger, with multiple emission line regions at different relative velocities (although there are currently no indications for this scenario). How can observations discriminate between the different explanations and make progress?
As illustrated in Fig. 9, it is clear that the key quantities that would allow to differentiate between the models are the intrinsic line-width and the systemic redshift (marked as dashed, vertical lines in Fig. 9). These properties can be measured from the H or the H lines, accessible with the James Webb Space Telescope. The systemic redshift can alternatively also be measured using [Cii] FIR emission with ALMA (e.g. Matthee et al., 2017b), which can also test whether a merger of multiple components is ongoing. Furthermore, if COLA1 is surrounded by a large ionised region, additional sources of ionising photons are likely present. It is therefore expected that COLA1 resides in a larger scale over-density of faint galaxies, potentially observable using deep Ly observations with VLT/MUSE and/or with ALMA observations that can identify [Cii].
5.3 Implications & considerations for surveys
Why have only a few double peaked LAEs been found at (e.g. Songaila et al., 2018)? Why do we find a double peaked LAE at a redshift where the IGM transmission towards the blue is likely very low, instead of around ? Could it be that more double-peaked LAEs have been found, but they have been discarded as [Oii] interlopers?
5.3.1 Observational biases against identifying double peaked LAEs?
As already noted in Dijkstra et al. (2007), LAEs with a strong blue peak show a relatively low asymmetry (quantified by skewness) and could thus be classed as low-redshift interlopers in the case of low resolution spectroscopy. Moreover, the range of observed peak separations in double peaked LAEs ( km s-1; Verhamme et al. 2017) corresponds to observed wavelength differences Å, similar to the observed wavelength difference of the [Oii] doublet Å at all observed wavelengths in the optical. Therefore, ‘single’ line-identifications may be biased against confirming double peaked LAEs. This bias may particularly be important when spectral wavelength coverage is limited to the optical, but less important for , as potential interlopers of LAEs at these wavelengths will likely be detected in multiple lines (such as H and [Oiii], besides [Oii]).
There are also other explanations of why the number of known double-peaked LAEs at may be low. One explanation is that the fraction of double-peaked LAEs increases strongly with Ly luminosity (as discussed in Hu et al. 2016) and current samples at do not yet include enough luminous sources (as the majority of very wide-field surveys prioritised ; e.g. Songaila et al. 2018). As the typical Ly luminosity increases with redshift, this explanation would indirectly imply that the LyC escape fraction increases with Ly luminosity and with redshift (as L increases; Sobral et al. 2018a).
Alternatively, it may be possible that spectroscopic follow-up observations and/or publication efforts may be biased towards and double-peaked LAEs at simply have not yet been observed spectroscopically or published; or that the typical S/N of spectroscopic observations at is too low to identify similar blue peaks. The flux in the blue peak is a factor lower than the brighter red component and can therefore only be detected at 3 significance if the red peak is detected at significance, which is not always the case.
5.3.2 A preference for observing narrow peak separations only in luminous LAEs at ?
Multiple peaked Ly profiles have regularly been observed in LAEs at (e.g. Rauch et al., 2008, 2011; Kulas et al., 2012; Yamada et al., 2012; Trainor et al., 2015; Vanzella et al., 2016; Rivera-Thorsen et al., 2017), but also in quasars and in high-redshift radio galaxies (e.g. van Ojik et al., 1997; Miley & De Breuck, 2008). As COLA1 does not show evidence for AGN activity, we focus our comparison to LAEs at (combining data from Yamada et al. 2012, Saez et al. 2015 and Sobral et al. 2018b) and Ly analogues (i.e. Green Pea galaxies; GPs; Yang et al. 2017). The fraction of double peaked LAEs at is % (Kulas et al., 2012; Yamada et al., 2012; Trainor et al., 2015), who find typical peak separations of km s-1, although we note that the spectral resolution of these observations ( km s-1) may not identify peaks with low velocity separations. The peak separation in COLA1 is smaller than the peak separation of the ultra-faint (M), lensed LAE at identified in Vanzella et al. (2016), which is an extremely compact, highly ionising star-forming galaxy.
As shown in Fig. 10, there is no clear relation between peak separation and Ly luminosity for LAEs at (although the dynamic range is limited). On the other hand, a clear anti-correlation is seen between peak separation and luminosity for Ly emitting GPs. COLA1, which is the most luminous LAE with the lowest known peak separation, seems to follow this relation. However, we note that this anti-correlation may be a selection effect, as GPs are selected on compactness and strong [Oiii]/[Oii] ratios (Cardamone et al., 2009), that may trace density bounded Hii regions. For example, GPs may all have a similar intrinsic Ly luminosity, but because of a correlation between the Ly escape fraction and the peak separation (Yang et al., 2017) a strong anti-correlation is observed (Fig. 10).
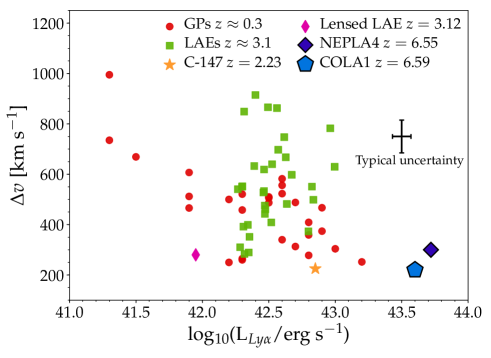
If Ly luminosity is anti-correlated with the peak separation at , this may explain why double peaked Ly profiles may only be observed in the most luminous LAEs. As the IGM transmission strongly decreases towards the blue of the systemic redshift (e.g. Laursen et al., 2011; Weinberger et al., 2018), the blue lines of faint LAEs are more likely to be reduced. Luminous LAEs may however reside in larger ionised bubbles (because of a higher amount of ionising photons), facilitating the observability of a blue peak. This would for example imply that NEPLA4 (Songaila et al., 2018), resides in a larger ionised bubble than COLA1. 666NEPLA4 has a larger peak separation than COLA1, inconsistent with the peak separation that an [Oii] interloper would have. On the other hand, simulations argue that the blue peak transmission may be higher for fainter galaxies, as there is less self-shielded Hi present in their CGM (e.g. Weinberger et al., 2018). The low observed peak separation in COLA1 could also indicate that the CGM/IGM attenuated a significant amount of the flux at even bluer wavelengths. Hence, it may simply be expected that observed peak separations at are lower than at . A crucial test would therefore be to map out the evolution of the relation between peak separation and Ly luminosity from with high resolution spectroscopy, and explore how the blue-to-red flux ratio evolves with redshift.
The Ly observability of luminous galaxies at appears to be boosted with respect to the observability of fainter galaxies (e.g. Stark et al., 2017). While recent models with uniform ionising backgrounds reproduce this result (e.g. Mason et al., 2018b), they can not yet explain the highest Ly equivalent widths. We speculate that this could be mitigated in case the local ionising background is enhanced around bright galaxies (i.e. similar to Model 1 discussed here).
6 Summary
We have presented a detailed analysis of the COLA1 galaxy, a double peaked LAE at (Hu et al., 2016), using deep multi-wavelength photometry and new deep, high resolution optical and near infrared spectroscopy with VLT/X-SHOOTER. Due to the opacity of the CGM and IGM for blue Ly photons, detecting a blue peak at is highly unlikely. We therefore test whether the line profile is interpreted correctly as Ly at and study the properties of COLA1 and their implications. Our results are summarised as follows:
-
•
We rule out that the double peaked line is [Oii] emission at based on 1) the shape of the line-profile: the asymmetric wing of the red line is not observed in the blue line and no flux is detected in the middle of the blue and red lines; 2) the extremely low blue-to-red flux ratio that is inconsistent with [Oii] and 3) the non-detection of H at ruling out even the lowest observed ratios with respect to [Oii].
-
•
A tentative detection in the band is explained by a contribution from Ly emission in a foreground LAE at , confirmed through [Oiii]5007 emission in addition to Ly.
-
•
We confirm that COLA1 is a double peaked LAE at and summarise its properties in Table 3. The Ly luminosity and EW are high (L erg s-1 and EW Å) and the Ly emission is compact ( kpc based on HST imaging).
-
•
The Ly peak separation is km s-1 and the flux of the blue peak is times the flux in the red peak. The Ly lines are narrow (FWHM km s-1 and km s-1 for the red and blue peak, respectively) and the full Ly line-profile resembles the profile of a luminous LAE at with a prominent blue peak (Fig. 6). Due to the narrowness of the Ly line, COLA1 is unlikely to be powered by an AGN.
-
•
By modelling the Ly profile with a five-parameter shell model, we find that the line-profile is characterised by a very low Hi column density (N cm-2), indicating a non-zero escape of ionising photons. Based on correlations between the escape fraction and the peak separation in LyC leaking galaxies, we infer an escape fraction of %, but potentially up to %. Other inferences imply escape fractions up to f %. This means that we are witnessing a star-forming galaxy that is actively contributing to the reionisation of the Universe.
-
•
COLA1 has a high UV luminosity, M, implying a M⊙ yr-1. The Spitzer/IRAC colours imply relatively weak contribution from [Oiii]/H contributing to the band, implying a metallicity as low as or reduced strength of nebular emission lines due to escaping ionising photons.
-
•
The detectability of blue Ly emission from COLA1 implies a low Ly optical depth out to km s-1 of the galaxy, potentially due to a surrounding pMpc (2.3 cMpc) ionised region. Based on the observed properties of COLA1 and simple assumptions (detailed in Table 4), we find that enough ionising photons have escaped COLA1 to ionise a pMpc (2.3 cMpc) bubble. However, keeping this region ionised likely requires a contribution from faint neighbouring sources. No faint neighbouring galaxies are known, but COLA1 is likely in the same large scale over-density as CR7 with a separation of ( pMpc) and km s-1.
As we have shown, the confirmation of COLA1 as a double peaked LAE at allows us to witness directly that galaxies contribute to the reionisation of the Universe. Several assumptions made here can be overcome with future observations of the intrinsic line-profile and systemic redshift of COLA1. In particular, future high resolution spectroscopic observations of samples of LAEs may reveal the dependence on double peaked Ly profiles on luminosity and redshift, providing a new probe of the reionisation process.
Acknowledgements
JM acknowledges the award of a Huygens PhD fellowship from Leiden University. MG acknowledges support from NASA grant NNX17AK58G. APA, PhD::SPACE fellow, acknowledges support from the FCT through the fellowship PD/BD/52706/2014. Based on observations made with ESO Telescopes at the La Silla Paranal Observatory under programme IDs 294.A-5018, 098.A-0819, 099.A-0254 and 0100.A-0213. We are grateful for the excellent data-sets from the COSMOS and UltraVISTA survey teams. This research was supported by the Munich Institute for Astro- and Particle Physics (MIAPP) of the DFG cluster of excellence ”Origin and Structure of the Universe”. We thank the referee for their comments that improved the paper. We also thank Christoph Behrens, Len Cowie, Koki Kakiichi, Peter Laursen, Charlotte Mason, Eros Vanzella, Lewis Weinberger and Johannes Zabl for discussions. We have benefited from the public available programming language Python, including the numpy, matplotlib, scipy and astropy packages (Hunter, 2007; Astropy Collaboration et al., 2013), the astronomical imaging tools Swarp (Bertin, 2010) and ds9 and the Topcat analysis tool (Taylor, 2013).
References
- Ahn et al. (2001) Ahn, S.-H., Lee, H.-W., & Lee, H. M. 2001, ApJ, 554, 604
- Astropy Collaboration et al. (2013) Astropy Collaboration et al. 2013, AAP, 558, A33
- Bañados et al. (2016) Bañados, E. et al. 2016, ApJS, 227, 11
- Bañados et al. (2018) Bañados, E. et al. 2018, Nature, 553, 473
- Bagley et al. (2017) Bagley, M. B. et al. 2017, ApJ, 837, 11
- Becker et al. (2015) Becker, G. D., Bolton, J. S., Madau, P., et al. 2015, MNRAS, 447, 3402
- Bertin (2010) Bertin, E. 2010, SWarp: Resampling and Co-adding FITS Images Together, Astrophysics Source Code Library
- Bohlin (2016) Bohlin, R. C. 2016, AJ, 152, 60
- Bosman et al. (2018) Bosman, S. E. I., Fan, X., Jiang, L., et al. 2018, MNRAS, 479, 1055
- Bouwens et al. (2017) Bouwens, R. J., van Dokkum, P. G., Illingworth, G. D., et al. 2017, ArXiv e-prints [arXiv:1711.02090]
- Bouwens et al. (2015) Bouwens, R. J. et al. 2015, ApJ, 803, 34
- Bouwens et al. (2016) Bouwens, R. J. et al. 2016, ApJ, 831, 176
- Bowler et al. (2014) Bowler, R. A. A., Dunlop, J. S., McLure, R. J., et al. 2014, MNRAS, 440, 2810
- Bowler et al. (2017) Bowler, R. A. A. et al. 2017, MNRAS, 466, 3612
- Capak et al. (2007) Capak, P. et al. 2007, ApJS, 172, 99
- Cardamone et al. (2009) Cardamone, C. et al. 2009, MNRAS, 399, 1191
- Carniani et al. (2017) Carniani, S. et al. 2017, ArXiv e-prints [arXiv:1712.03985]
- Charlot & Fall (1993) Charlot, S. & Fall, S. M. 1993, ApJ, 415, 580
- Davies et al. (2018) Davies, F. B., Becker, G. D., & Furlanetto, S. R. 2018, ApJ, 860, 155
- Dijkstra et al. (2016) Dijkstra, M., Gronke, M., & Sobral, D. 2016, ApJ, 823, 74
- Dijkstra et al. (2007) Dijkstra, M., Lidz, A., & Wyithe, J. S. B. 2007, MNRAS, 377, 1175
- Erb et al. (2014) Erb, D. K. et al. 2014, ApJ, 795, 33
- Finlator et al. (2009) Finlator, K., Özel, F., Davé, R., & Oppenheimer, B. D. 2009, MNRAS, 400, 1049
- Furlanetto et al. (2006) Furlanetto, S. R., McQuinn, M., & Hernquist, L. 2006, MNRAS, 365, 115
- Gazagnes et al. (2018) Gazagnes, S., Chisholm, J., Schaerer, D., et al. 2018, ArXiv e-prints [arXiv:1802.06378]
- Gronke (2017) Gronke, M. 2017, AAP, 608, A139
- Gronke et al. (2015) Gronke, M., Bull, P., & Dijkstra, M. 2015, ApJ, 812, 123
- Gronke et al. (2017) Gronke, M., Dijkstra, M., McCourt, M., & Peng Oh, S. 2017, AAP, 607, A71
- Haiman (2002) Haiman, Z. 2002, ApJL, 576, L1
- Harikane et al. (2018) Harikane, Y. et al. 2018, ApJ, 859, 84
- Hashimoto et al. (2017) Hashimoto, T. et al. 2017, AAP, 608, A10
- Hayashi et al. (2013) Hayashi, M., Sobral, D., Best, P. N., Smail, I., & Kodama, T. 2013, MNRAS, 430, 1042
- Heckman et al. (2001) Heckman, T. M., Sembach, K. R., Meurer, G. R., et al. 2001, ApJ, 558, 56
- Henry et al. (2015) Henry, A., Scarlata, C., Martin, C. L., & Erb, D. 2015, ApJ, 809, 19
- Hu et al. (2010) Hu, E. M., Cowie, L. L., Barger, A. J., et al. 2010, ApJ, 725, 394
- Hu et al. (2016) Hu, E. M., Cowie, L. L., Songaila, A., et al. 2016, ApJL, 825, L7
- Hunter (2007) Hunter, J. D. 2007, Computing in Science and Engineering, 9, 90
- Ilbert et al. (2009) Ilbert, O. et al. 2009, ApJ, 690, 1236
- Inoue et al. (2014) Inoue, A. K., Shimizu, I., Iwata, I., & Tanaka, M. 2014, MNRAS, 442, 1805
- Izotov et al. (2018) Izotov, Y. I., Worseck, G., Schaerer, D., et al. 2018, MNRAS, 478, 4851
- Jensen et al. (2014) Jensen, H., Hayes, M., Iliev, I. T., et al. 2014, MNRAS, 444, 2114
- Jensen et al. (2016) Jensen, H., Zackrisson, E., Pelckmans, K., et al. 2016, ApJ, 827, 5
- Jiang et al. (2013) Jiang, L. et al. 2013, ApJ, 772, 99
- Kakiichi et al. (2018) Kakiichi, K. et al. 2018, MNRAS, 479, 43
- Kashikawa et al. (2006) Kashikawa, N. et al. 2006, ApJ, 648, 7
- Kennicutt (1998) Kennicutt, Jr., R. C. 1998, ARAA, 36, 189
- Khostovan et al. (2015) Khostovan, A. A., Sobral, D., Mobasher, B., et al. 2015, MNRAS, 452, 3948
- Khostovan et al. (2016) Khostovan, A. A., Sobral, D., Mobasher, B., et al. 2016, MNRAS, 463, 2363
- Koekemoer et al. (2007) Koekemoer, A. M. et al. 2007, ApJS, 172, 196
- Konno et al. (2018) Konno, A. et al. 2018, PASJ, 70, S16
- Kulas et al. (2012) Kulas, K. R., Shapley, A. E., Kollmeier, J. A., et al. 2012, ApJ, 745, 33
- Labbé et al. (2006) Labbé, I., Bouwens, R., Illingworth, G. D., & Franx, M. 2006, ApJL, 649, L67
- Labbé et al. (2015) Labbé, I. et al. 2015, ApJS, 221, 23
- Laigle et al. (2016) Laigle, C. et al. 2016, ApJS, 224, 24
- Laursen et al. (2011) Laursen, P., Sommer-Larsen, J., & Razoumov, A. O. 2011, ApJ, 728, 52
- Lin et al. (2016) Lin, Y., Oh, S. P., Furlanetto, S. R., & Sutter, P. M. 2016, MNRAS, 461, 3361
- Loeb & Rybicki (1999) Loeb, A. & Rybicki, G. B. 1999, ApJ, 524, 527
- Madau (2017) Madau, P. 2017, ApJ, 851, 50
- Malhotra & Rhoads (2006) Malhotra, S. & Rhoads, J. E. 2006, ApJL, 647, L95
- Mas-Ribas et al. (2017) Mas-Ribas, L., Hennawi, J. F., Dijkstra, M., et al. 2017, ApJ, 846, 11
- Mason et al. (2018a) Mason, C. A., Treu, T., Dijkstra, M., et al. 2018a, ApJ, 856, 2
- Mason et al. (2018b) Mason, C. A. et al. 2018b, ApJL, 857, L11
- Matsuda et al. (2006) Matsuda, Y., Yamada, T., Hayashino, T., Yamauchi, R., & Nakamura, Y. 2006, ApJL, 640, L123
- Matsuoka et al. (2016) Matsuoka, Y. et al. 2016, ApJ, 828, 26
- Matthee et al. (2017a) Matthee, J., Sobral, D., Darvish, B., et al. 2017a, MNRAS, 472, 772
- Matthee et al. (2016) Matthee, J., Sobral, D., Oteo, I., et al. 2016, MNRAS, 458, 449
- Matthee et al. (2015) Matthee, J., Sobral, D., Santos, S., et al. 2015, MNRAS, 451, 400
- Matthee et al. (2017b) Matthee, J. et al. 2017b, ApJ, 851, 145
- McCracken et al. (2012) McCracken, H. J. et al. 2012, AAP, 544, A156
- Mesinger et al. (2015) Mesinger, A., Aykutalp, A., Vanzella, E., et al. 2015, MNRAS, 446, 566
- Mesinger et al. (2004) Mesinger, A., Haiman, Z., & Cen, R. 2004, ApJ, 613, 23
- Meurer et al. (1999) Meurer, G. R., Heckman, T. M., & Calzetti, D. 1999, ApJ, 521, 64
- Miley & De Breuck (2008) Miley, G. & De Breuck, C. 2008, AAPR, 15, 67
- Modigliani et al. (2010) Modigliani, A. et al. 2010, in SPIE, Vol. 7737, Observatory Operations: Strategies, Processes, and Systems III, 773728
- Nakajima & Ouchi (2014) Nakajima, K. & Ouchi, M. 2014, MNRAS, 442, 900
- Neufeld (1990) Neufeld, D. A. 1990, ApJ, 350, 216
- Oke (1974) Oke, J. B. 1974, ApJS, 27, 21
- Ono et al. (2010) Ono, Y., Ouchi, M., Shimasaku, K., et al. 2010, ApJ, 724, 1524
- Ouchi et al. (2010) Ouchi, M. et al. 2010, ApJ, 723, 869
- Paulino-Afonso et al. (2018a) Paulino-Afonso, A., Sobral, D., Darvish, B., et al. 2018a, ArXiv e-prints [arXiv:1805.07371]
- Paulino-Afonso et al. (2018b) Paulino-Afonso, A. et al. 2018b, MNRAS, 476, 5479
- Pentericci et al. (2014) Pentericci, L. et al. 2014, ApJ, 793, 113
- Rauch et al. (2011) Rauch, M., Becker, G. D., Haehnelt, M. G., et al. 2011, MNRAS, 418, 1115
- Rauch et al. (2008) Rauch, M. et al. 2008, ApJ, 681, 856
- Rivera-Thorsen et al. (2017) Rivera-Thorsen, T. E. et al. 2017, AAP, 608, L4
- Sadoun et al. (2017) Sadoun, R., Zheng, Z., & Miralda-Escudé, J. 2017, ApJ, 839, 44
- Saez et al. (2015) Saez, C. et al. 2015, MNRAS, 450, 2615
- Salpeter (1955) Salpeter, E. E. 1955, ApJ, 121, 161
- Sanders et al. (2016) Sanders, R. L. et al. 2016, ApJ, 816, 23
- Santos (2004) Santos, M. R. 2004, MNRAS, 349, 1137
- Santos et al. (2016) Santos, S., Sobral, D., & Matthee, J. 2016, MNRAS, 463, 1678
- Scoville et al. (2007) Scoville, N. et al. 2007, ApJS, 172, 1
- Shibuya et al. (2015) Shibuya, T., Ouchi, M., & Harikane, Y. 2015, ApJS, 219, 15
- Shibuya et al. (2018) Shibuya, T. et al. 2018, PASJ, 70, S15
- Siana et al. (2015) Siana, B. et al. 2015, ApJ, 804, 17
- Sobral et al. (2012) Sobral, D., Best, P. N., Matsuda, Y., et al. 2012, MNRAS, 420, 1926
- Sobral & Matthee (2018) Sobral, D. & Matthee, J. 2018, ArXiv e-prints [arXiv:1803.08923]
- Sobral et al. (2015) Sobral, D., Matthee, J., Darvish, B., et al. 2015, ApJ, 808, 139
- Sobral et al. (2018a) Sobral, D., Santos, S., Matthee, J., et al. 2018a, MNRAS, 476, 4725
- Sobral et al. (2013) Sobral, D., Smail, I., Best, P. N., et al. 2013, MNRAS, 428, 1128
- Sobral et al. (2017a) Sobral, D. et al. 2017a, ArXiv e-prints [arXiv:1710.08422]
- Sobral et al. (2017b) Sobral, D. et al. 2017b, MNRAS, 466, 1242
- Sobral et al. (2018b) Sobral, D. et al. 2018b, MNRAS, 477, 2817
- Songaila et al. (2018) Songaila, A., Hu, E. M., Barger, A. J., et al. 2018, ApJ, 859, 91
- Stark et al. (2015) Stark, D. P. et al. 2015, MNRAS, 450, 1846
- Stark et al. (2017) Stark, D. P. et al. 2017, MNRAS, 464, 469
- Stefanon et al. (2017) Stefanon, M. et al. 2017, ApJ, 851, 43
- Steidel et al. (2018) Steidel, C. C., Bogosavlevic, M., Shapley, A. E., et al. 2018, ArXiv e-prints [arXiv:1805.06071]
- Steinhardt et al. (2014) Steinhardt, C. L. et al. 2014, ApJL, 791, L25
- Taniguchi et al. (2007) Taniguchi, Y. et al. 2007, ApJS, 172, 9
- Taylor (2013) Taylor, M. 2013, Starlink User Note, 253
- Trainor et al. (2015) Trainor, R. F., Steidel, C. C., Strom, A. L., & Rudie, G. C. 2015, ApJ, 809, 89
- van Ojik et al. (1997) van Ojik, R., Roettgering, H. J. A., Miley, G. K., & Hunstead, R. W. 1997, AAP, 317, 358
- Vanzella et al. (2016) Vanzella, E. et al. 2016, ApJL, 821, L27
- Vanzella et al. (2017) Vanzella, E. et al. 2017, MNRAS, 467, 4304
- Vanzella et al. (2018) Vanzella, E. et al. 2018, MNRAS, 476, L15
- Verhamme et al. (2015) Verhamme, A., Orlitová, I., Schaerer, D., & Hayes, M. 2015, AAP, 578, A7
- Verhamme et al. (2017) Verhamme, A., Orlitová, I., Schaerer, D., et al. 2017, AAP, 597, A13
- Verhamme et al. (2006) Verhamme, A., Schaerer, D., & Maselli, A. 2006, AAP, 460, 397
- Weinberger et al. (2018) Weinberger, L. H., Kulkarni, G., Haehnelt, M. G., Choudhury, T. R., & Puchwein, E. 2018, MNRAS, 479, 2564
- Wisotzki et al. (2016) Wisotzki, L. et al. 2016, AAP, 587, A98
- Yamada et al. (2012) Yamada, T., Matsuda, Y., Kousai, K., et al. 2012, ApJ, 751, 29
- Yang et al. (2017) Yang, H. et al. 2017, ApJ, 844, 171
- Zackrisson et al. (2017) Zackrisson, E. et al. 2017, ApJ, 836, 78
- Zheng et al. (2017) Zheng, Z.-Y. et al. 2017, ApJL, 842, L22