Electronic structure and magnetic anisotropies of antiferromagnetic transition-metal difluorides
Abstract
We compare GGA+U calculations with available experimental data and analyze the origin of magnetic anisotropies in MnF2, FeF2, CoF2, and NiF2. We confirm that the magnetic anisotropy of MnF2 stems almost completely from the dipolar interaction, while magnetocrystalline anisotropy energy plays a dominant role in the other three compounds, and discuss how it depends on the details of band structure. The last mentioned is critically compared to available optical measurements. The case of CoF2, where magnetocrystalline anisotropy energy (MCA) strongly depends on , is put into contrast with FeF2 where theoretical predictions of magnetic anisotropies are nearly quantitative.
pacs:
laterI Introduction
Several rutile-structure difluorides of transition metals (TMs) such as MnF2 have long been known to be antiferromagnetically ordered at low temperatures. Albeit not the first antiferromagnets (AFMs) ever identified, they received significant attention in the late ’50s and ’60s when their magnetic anisotropy was effectively determined using measurements of spin flop. These materials are arguably one of the simplest AFMs one can imagine: their two magnetic sublattices are oriented in opposite directions (collinearity) and they exhibit uniaxial MA, which reduces the complexity of domain building. Renewed interest in these materials has arisen recently in the context of antiferromagnetic spintronics Baltz:2017_a . Very recent device concepts using these traditional AFMs include bilayers where spin pumping by AFM Johansen:2017_a or spin Seebeck effect Rezende:2016_a could be observed Wu:2016_a . Spin currents can be passed through insulating AFMs Moriyama:2015_a and devices involving MnF2 and FeF2 have been suggested Johansen:2017_a ; Gulbrandsen:2018_a .
Motivated initially by the lack of theoretical estimates of magnetocrystalline anisotropy (MCA), we soon realized that not even the band structures of magnanese, iron, cobalt and nickel difluorides are well established in the literature. We therefore present DFT+U calculations (described in detail in Appendix C), compare them to optical measurements where available, identify the missing information (and propose experiments and calculations to be still carried out) and finally present the MCA calculations and discuss their agreement with experimentally determined magnetic anisotropies of these materials.
For certain purposes, simple (in the sense explained above), AFMs can be described by Stoner-Wohlfarth model Bogdanov:2007_a where the energy (per volume) divided by sublattice magnetization reads
| (1) |
Here, and are the unit vectors giving the direction of sublattice magnetizations and magnetic field , respectively. The two material-specific parameters of this model are the exchange field and anisotropy field and, typically, . For , model Eq. (1) implies a spin flop at , i.e., abrupt ground state transition from with strictly antiparallel to, approximately with slightly canted (see Fig. 8 in Appendix B). Using this effect, can be determined from magnetometry provided that the exchange field is known or estimated.
| MnF2 | FeF2 | CoF2 | NiF2 | |||||
|---|---|---|---|---|---|---|---|---|
| exp | calc | exp | calc | exp | calc | exp | calc | |
| mag.mom. [] | 5.04 Strempfer:2004_a | 4.4 | 3.93 Strempfer:2004_a , 3.75 Novak:2006_a | 3.6 | 2.21 Strempfer:2004_a | 2.6 | 1.96 Strempfer:2004_a | 1.63 |
| ideal S | 2.5 | 2 | 1.5 | 1 | ||||
| [T] | 46.5 Carrico:1994_a , 57.5 Rezende:2016_a | 85.5 | 43.4 Carrico:1994_a , 62 Rezende:2016_a | 116.7 | 32.4 Carrico:1994_a | 67.4 | 163.5 | |
| [T] | 0.697 Carrico:1994_a , 0.8 Rezende:2016_a | 0.42 | 14.9 Carrico:1994_a , 19.2 Rezende:2016_a | 2.6 | 3.2 Carrico:1994_a | 0.73∗ | ||
| [T] | 0.2 | 2.3 | 0.52∗ | |||||
| dipolar term | 418 mT | 317 mT | 211 mT | 203 mT | ||||
| [T] | 9.27 Jacobs:1961_a | 12.0 | 41.9 Jaccarino:1983_a | 34.8 | 14.0 Carrico:1994_a | *** | ||
| [K] | 67.7 Strempfer:2004_a | 75.8 Strempfer:2004_a | 37.7 Nagamiya:1955_a | 74.1 Strempfer:2004_a | ||||
We summarize the measured values of for the first three compounds of the series in Tab. 1 and compare them to theoretically calculated values. The latter are obtained by combining , which comprises MCA and dipolar interaction (the former, , calculated by ab initio methods detailed in Sec. III), and , based on an estimate of the exchange coupling from the Néel temperature explEq2 ,
| (2) |
where is the TM atom magnetic moment (relation between the exchange coupling and is given in Sec. III). We find a satisfactory agreement between experimental and theoretical values of spin-flop fields for MnF2 and FeF2 and the following conclusions can be made. Magnetic anisotropy of MnF2 is primarily driven by dipole interactions (see Appendix A), which is not surprising given the atomic configuration of manganese ( orbital singlet), which does not allow any appreciable MCA (see commentssim-MnF2 on single-ion model in Sec. III). On the other hand, this does not apply to FeF2, where the TM shell is not half-filled and sizable matrix elements of then lead to a strong magnetocrystalline anisotropy, which translates into spin-flop fields as large as 42 T.
Calculations of MCA in CoF2 yield ambiguous results (see Sec. III) and we, therefore, use opposite reasoning for this material: using and , we estimate , which is then shown to imply consistent with our ab initio calculation. Again, this consistency check is explained in Sec. III and in Tab. 1, the values of are marked with an asterisk to indicate that they are calculated using experimental . Regarding NiF2, we find negative in agreement with experimental evidence Shi:2004_a of oriented in plane. Spin-flop measurements are more complicated in this case since there are multiple easy axes (such a system is prone to build multidomain states) and therefore no data is given for in Tab. 1.
Theoretical calculation of MCA relies on a solid knowledge of the band-structure. It is essentially the difference between two large numbers and , the total energy of the occupied electron states for and , so that even small inaccuracies may lead to completely wrong results unless such inaccuracies accurately cancel (i.e., any error in the band-structure determination has the same effect on both and ). It should be pointed out that these calculations must include the effect of spin-orbit interaction without which the MCA vanishes (). Band structures of the four compounds considered in this article have been calculated previously under various approximations: LSDA band structures of MnF2 and NiF2 were first calculated by Dufek, Schwarz, and BlahaDufek:1993_a and, a little later, the same group also added FeF2 and CoF2 using GGA Dufek:1994_a (see also Appendix C), albeit with unrealistically small gaps. This improved with the advent of GGA+U Lopez-Moreno:2012_a ; Barreda-Argueso:2013_a where, however, not much attention was paid to how large the values of the model parameters actually should be. Unrestricted Hartree-Fock calculations Valerio:1995_a produce optical gap in excess of 10 eV for FeF2, which is beyond any doubt too large, realistic size being close to 3 eV (see below). We now proceed to a discussion of band structures calculated using GGA+U (based on the same package as in Ref. [Dufek:1994_a, ]) and critical comparison of these to experimentally accessible quantities such as band gap, TM magnetic moment, and lattice parameters.
II Electronic structure
Given the identical crystal structure (Fig. 7) and the position of Mn, Fe, Co, and Ni in the periodic table, it is not surprising that structures of all four difluorides are mutually similar. It can explained using the sketch in Fig. 1 (see also Fig. 8 in Appendix C). Fermi level () lies in the middle of TM -state bands and other atomic orbitals (such as fluorine -states) are relatively far away. The gap that opens within the TM -state band is partly due to electron-electron interactions (EEIs), which we model, within density functional theory, by GGA+U (see Appendix C) and partly (in the case of Mn and Ni) due to crystal field effects. Surprisingly, the size of band gaps at low temperature (i.e., in the AFM phase) is nowhere to be found in the literature and we can therefore use only some indirect arguments to support the actual band structure calculations in Fig. 2.
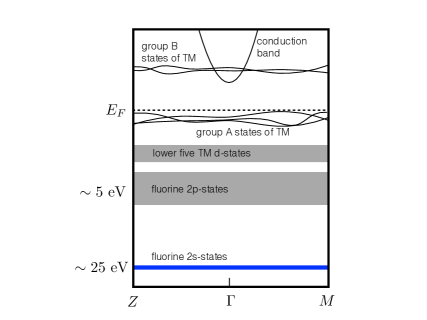
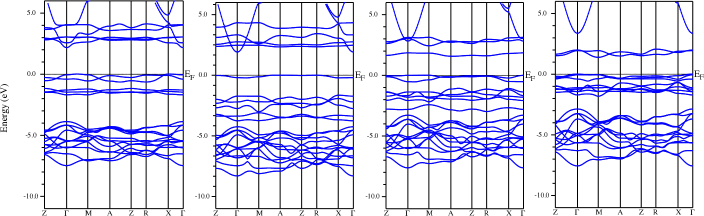
The band structures for spin up and down are the same — this is a consequence of the simple antiferromagnetic order (see Fig. 1 in Ref. [Baltz:2017_a, ] for explanation). Focusing on one spin, the total of ten -orbitals (for two TM atoms in the unit cell, see also Fig. 7) divides first into two quintuplets that could be thought of as of bonding and antibonding orbitals. The lower quintuplet always lies below , the higher is either partly or completely above . Starting with MnF2 in its configuration, is located at the top of the lower five TM -bands and all other five bands are high above ( eV or more); in terms of the sketch in Fig. 1, there are no bands in group A and all five are in group B as the leftmost panel in Fig. 2 shows. Another highly dispersive band, which we call “conduction band” in Fig. 1, crosses these relatively flat -bands (we comment on this band in Appendix C). Now the effect of adding Hubbard is to push the bands in group B away from the “lower five” so that, since remains pinned at the top of the latter, the group B bands move higher into the conduction band (compare also the leftmost panel of Fig. 2 to Fig. 8 in Appendix C). In other words, the band structure of MnF2 does not change substantially when is increased even though the gap does increase slightly; the gap occurs mainly due to the splitting between the two quintuplets of -bands and would be present even in the absence of correlations. However, the effect of Hubbard is much more dramatic for the other compounds under scrutiny. We do not discuss the best choice explMMMnF2 of in MnF2 any further since, by virtue of the argument of half-filled -shell, the MCA is anyway small in this material.
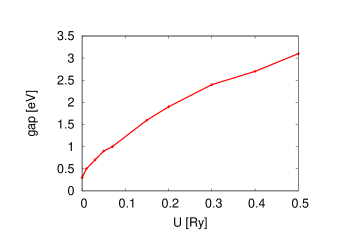
There is one more occupied band in FeF2 than in MnF2 and therefore one band from group B (Fig. 1) has to be transferred into group A. Because all five -bands are very close to one another, forming some kind of local spaghetti in the band structure, this would render FeF2 metallic (at least on the LDA level). A better treatment of EEIs is needed. In fact, a gap opens already by switching to GGA but its size is unrealistically small ( eV). Figure 3 shows that within GGA+U, the gap grows with and for values used typically in literature Lopez-Moreno:2012_a , it reaches a reasonable Novak:2006_a size of eV. We point out that a room temperature measurement of optical absorption Santos-Ortiz:2013_a leads to a similar gap size; however, we will discuss below the plausibility of using around 2.5 eV which is somewhat smaller than usual Thunstrom:2012_a . Our choice of corresponds to the second panel from the left in Fig. 2 and seems to give optical spectra closer to another experimental work on FeF2. Impact of the choice of on MCA will be discussed in Sec. III.
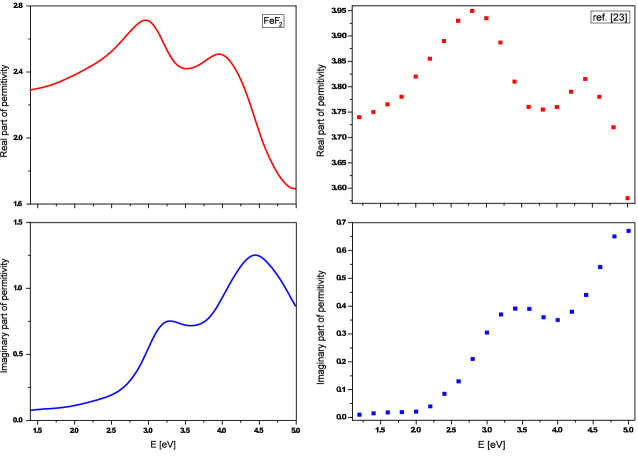
The experimental work in question Pistora:2010_a concerns room-temperature ellipsometry of FeF2 layers. The gap inferred in Fig. 4 of that paper is certainly smaller than in Ref. [Santos-Ortiz:2013_a, ] and, moreover, it turns out that the actual theoretical gap may be even smaller because of suppressed transitions from the -band directly below to the other low-lying bands of group B and the “conduction band” (as defined in Fig. 1). In fact, it is remarkable how similar are theoretically calculated optical spectra for as small as 0.1 Ry (shown in Fig. 4) to the experimental data Pistora:2010_a mentioned above. Given that optical gap at low temperatures will probably be larger, we opted for showing band structure with Ry in Fig. 2. Calculated magnetic moment, which is smaller than the one experimentally determined (see Tab. 1), also suggests that this choice of may be better.
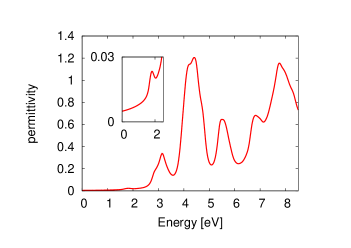
Both for FeF2 and CoF2, we chose rather small values of to have gaps around 2 eV in Fig. 2. This choice is arbitrary and since measurements of structural parameters and/or magnetic moment provide only a relatively benevolent test Yang:2012_a on the values of within usual ab initio calculations, not much progress can be expected here until low-temperature optical measurements in a broad spectral range are available. We show an example of such spectra (for CoF2) in Fig. 5: There is an abundance of spectral features that could be tested against experiments. In fact, absorption edge around 0.8 eV was measured Eremenko:1964_a at low temperature in CoF2, which would suggest very small value of . This spectral feature is associated with a relatively narrow band whose origin could be in interband transitions (see the inset of Fig. 5) but also in electron-phonon interactions Young:1969_a , which would, in turn, indicate a much larger gap. Nevertheless, large values of the Hubbard parameter (like eV taken from cobalt oxide Thunstrom:2012_a ) seem in contradiction with relatively small MCA as explained in Sec. III.
Finally, NiF2 again retains a gap even for vanishing . Under the action of the crystal field, the upper quintuplet of -bands splits into a doublet and a triplet. The former remains completely depopulated and is separated by eV from the occupied three bands forming bands of the group A (see the sketch in Fig. 1). Similar to MnF2, the effect of Hubbard is to increase the gap size by moving the group A and B bands away from each other. The small values of calculated TM magnetic moment in Tab. 1, however, suggest that, similar to MnF2, using non-zero may be reasonable. To conclude this section, we stress that in spite of uncertainty about what value of may lead to the best description of the actual system, the qualitative character of the band structure of all four compounds is clear: larger values of push the bands in group B higher and make the optical gap larger. We believe that combining data from several different experimental sources provides a solid basis for band-structure validation and, to this end, we put emphasis on optical spectra in this work.
III Magnetocrystalline anisotropy
Based on sufficiently accurately calculated electronic bands (with effects of spin-orbit interaction included explSO ), total energy in the in-plane () and out-of-plane magnetic configurations () can be calculated. Sublattice magnetization (where is the volume of unit cell which contains one TM atom of each sublattice) can then be used to obtain and also, using Eq. (2), . The central question now is how the total energies depend on : other quantities such as optimal structure parameters (lattice constants) or TM magnetic moment do Yang:2012_a , and it is not a priori clear how sensitive the MCA is to the variation of .
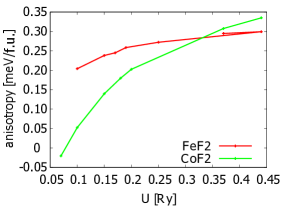
Keeping in mind that MCA must be very small for MnF2 (recall the argument of half-filled -shell), there is no need to investigate its dependence on . The more-than-satisfactory agreement between calculated and measured in Tab. 1 (the former one being larger by 29%) relies on the dipolar term, which is not as difficult to evaluate. Regarding the quantitative agreement between calculations and experiment, we should once again stress that the limiting factor is now probably the estimate of , based on . The situation is different with FeF2: the value in Tab. 1 corresponds to calculations with Ry. Now, as Fig. 6 shows, while the MCA does depend on , the variation is moderate. It is possible to conclude that for FeF2, magnetic anisotropies can be fairly well predicted theoretically (Tab. 1 shows that theoretical estimate of is only about 17% lower than the measured value). Considering the fact that sometimes Lopez-Moreno:2012_a the ab initio calculations are extended to include another Hubbard-like parameter , we also calculated MCA for Ry and Ry and found it to be somewhat smaller than what would correspond to Ry. This further highlights the limits of quantitative predictions of MCA based on ab initio calculations.
As an alternative to ab initio calculations, we note that the sign and, to some extent, also the order of magnitude of MCA in FeF2 can be deduced from the single-ion model Hutchings:1970_a . Orbital multiplet of the Fe2+ ion () is fully split by the crystal field in the rutile structure and the action of spin-orbit interaction on the lowest (non-degenerate) level can be written in terms of a spin Hamiltonian, . Corrections to this form of are small Hutchings:1970_a , derivation of this result is explained below when we discuss CoF2; note that the argument in Eq. (5) explains the negative sign of as a consequence of level repulsion. Exchange splitting oriented along the direction of the Néel vector , combined with , leads to a simple model exhibiting MCA: . The lowest energy (with respect to spin) for and , respectively, is thus obtained by diagonalizing
| (3) |
which yields and for the lowest eigenvalue in the limit. Given , the former direction is preferred implying uniaxial anisotropy. The values of (around 1 meV) determined by various experimental techniques Lines:1967_a are consistent, yet not quite in agreement with, calculated and measured magnetic anisotropy of FeF2.
A very different situation is found with CoF2. For small values of , MCA even changes sign (see again Fig. 6) and if we take the experimental value of in Tab. 1 as a means to estimate and, once the dipolar term has been subtracted, also , we find that the MCA changes with rapidly around the corresponding value (0.05 meV per formula unit). Hence the conclusion, at minimum, that it is not possible to rely on theoretical calculations of MCA in this case, unless some additional guidance is provided. Moreover, values of that produce MCA of this size are rather small (below 0.1 Ry) while more commonly Thunstrom:2012_a larger values are used. It should be noted, however, that CoF2 seems to be anomalous within the series of four materials considered in this paper (contrary to the other three, it has a significantly lower ) and it is possible that the estimate of in Tab. 1 is too large. This would allow for larger and, in the spirit of Fig. 6, for larger values of as well. Reliable experimental determination of optical gap (at low temperatures) could resolve this issue.
Analysis based on the single-ion modelIshikawa:1970_a for Co2+ leads quantitatively to an even worse estimate of MCA than for FeF2 but still predicts the correct sign and also the negligible in-plane anisotropies. The orbital multiplet () is now split by octahedral crystal field and the lowest lying triplet is further split by Kamimura:1963_a eV into a ground state doublet and an excited state (singlet ; in the following, we will use this notation for the orbital part of wave functions). Rhombohedral crystal field lifts the degeneracy of the doublet, producing states
| (4) |
whose energy splitting is a fractionKamimura:1963_a of . The perturbative action of on the lower state can now be evaluated to the second order in spin-orbit interaction . Provided we neglect coupling to the state, we obtain
| (5) |
because and, given in Eq. (4), the matrix elements of the raising (lowering) operators () vanish. This construction predicts by virtue of but, quantitatively, it implies a larger MCA than for FeF2 since both is larger (for CoF2) and the energy splitting of the lowest two states smaller. The absent in-plane anisotropy amounts to , containing no , operators and this, in turn, is a consequence of . Perturbative coupling to the singlet will introduce the terms to , however, their coefficients will be small ().
Concerning the quantitative disagreement between the single-ion model for CoF2 and calculated by ab initio, a more advanced approach seems necessary such as some kind of cluster model, e.g., FeF6, constructed along the lines of Ref. [Subramanian:2013_a, ] where a model of MnAs4 cluster was used to explain certain magnetic anisotropy terms in (Ga,Mn)As dilute magnetic semiconductor. Such an attempt to make sense of the ab initio calculations is nevertheless clearly beyond the scope of this paper. On the other hand, the single-ion model is successful in case of FeF2 and also sim-MnF2 MnF2.
IV Conclusion
Magnetic anisotropies of MnF2, FeF2, CoF2, and NiF2 have been investigated theoretically and it was found that, with the exception of CoF2, ab initio calculations described in Appendix C lead to reliable results. For comparison to experiments, we used well-established spin-flop measurements (spin-flop field , see Tab. 1). Regarding CoF2, we conclude that while the calculations are consistent with experimentally determined , the MCA depends too sensitively on Hubbard parameter so that quantitative prediction is impossible, without knowing in advance what the correct result is.
We pointed out that band structures should be validated, for example, through optical measurements, before using them for further calculations. It would be desirable to perform such low-temperature measurements for all four compounds and determine the optical gap. This would afford greater confidence in the values of used in ab initio calculations.
Acknowledgements
It is our pleasure to express gratitude to Pavel Novák for his guidance in crystal field theories and literature dating back deep into the 20th century. We acknowledge support from National Grid Infrastructure MetaCentrum provided under the programme “Projects of Large Research, Development, and Innovations Infrastructures” (CESNET LM2015042) and also discussions with Ondřej Šipr, Jindřich Kolorenč, and Gerhard Fecher, and also funding via Contract No. 15-13436S (GAČR) and EU FET Open RIA Grant no. 766566 (ASPIN). C.A.C. acknowledges the extended financial support by the ERDF, Project NanoCent No. CZ.02.1.01/0.0/0.0/15_003/0000485.
Appendix A Dipolar interactions
Dipolar magnetic energy (per unit cell) of an (infinite) lattice of magnetic moments is where the sum goes over all magnetic moments in the unit cell. Magnetic field generated, at the position of given , by all other magnetic moments is
| (6) |
where is the relative position of with respect to . The dipolar magnetic energy depends on the orientation of the magnetic moments; values labeled “dipolar term” in Tab. 1 are recalculated into field using the same procedure as for MCA (see Sec. III). Magnetic moments used in Eq. (6) were taken from experiments Strempfer:2004_a , as given in Tab. 1.
Dipolar interactions do not contribute to MA in cubic lattices while they may even constitute its dominant source if the high symmetry is broken (or completely absent). To explain qualitatively the effect of the broken symmetry, we consider a five-atom cluster (magnetic sublattice A atom located at the center of coordinate system and four atoms of magnetic sublattice B located at and with strictly antiparallel magnetic moments) and calculate the energy of the four B atoms in the dipolar field implied by Eq. (6). This energy, , depends in general on the magnetic moment orientation . For , however, is constant owing to being independent on . Once the symmetry is broken (), the configuration with moments parallel to () ceases to have the same dipolar energy as the case, the ratio of the respective energies being .
Appendix B Structural parameters
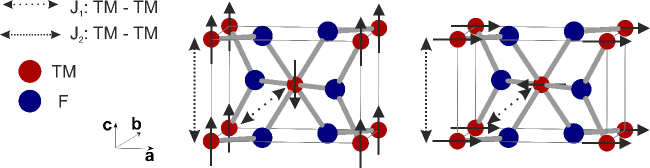
Crystal structure with two orientations of magnetic moments is shown in Fig. 7. Antiferromagnetic () and ferromagnetic () interactions between nearby magnetic moments are highlighted, the coupling discussed in Sec. III is a weighted average of them. Lattice constants and atom positions (taken from Ref. [Baur:1971_a, ]) are given in Tab. 2. It is important to note that, upon introducing the magnetic order, the space group of the crystal structure is modified from the tetragonal to the orthorhombic because the TM atoms sitting at and are no longer equivalent by symmetry, as their spins are antiparallel (Fig. 7). In our calculations, we used muffin-tin radii () as shown in Tab. 3 and all data shown in this paper are based on .
| Chemical formula MnF2 | |
|---|---|
| a, c (Å) | 4.8738(1), 3.3107(1) |
| V (Å3) | 78.642(3) |
| atomic positions | |
| Mn1 | (0,0,0) |
| Mn2 | (0.5,0.5,0.5) |
| F1 | (0.3053(12),0.3053(12),0) |
| F2 | (0.8053(12),0.1947(12),0.5) |
| Chemical formula FeF2 | |
| a, c (Å) | 4.6945(4), 3.3097(1) |
| V (Å3) | 72.940(9) |
| atomic positions | |
| Fe1 | (0,0,0) |
| Fe2 | (0.5,0.5,0.5) |
| F1 | (0.3010(8),0.3010(8),0) |
| F2 | (0.8010(8),0.1990(8),0.5) |
| Chemical formula CoF2 | |
| a, c (Å) | 4.6954(4), 3.1774(4) |
| V (Å3) | 70.051(12) |
| atomic positions | |
| Co1 | (0,0,0) |
| Co2 | (0.5,0.5,0.5) |
| F1 | (0.3052(8),0.3052(8),0) |
| F2 | (0.8052(8),0.1948(8),0.5) |
| Chemical formula NiF2 | |
| Crystal system, space group | Tetragonal, No. 136 |
| a, c (Å) | 4.6498(3), 3.0838(1) |
| V (Å3) | 66.674(6) |
| atomic positions | |
| Ni1 | (0,0,0) |
| Ni2 | (0.5,0.5,0.5) |
| F1 | (0.3012(13),0.3012(13),0) |
| F2 | (0.8012(13),0.1988(13),0.5) |
| Mn, F | 2.08, 1.88 | Co, F | 1.97, 1.78 | ||
|---|---|---|---|---|---|
| Fe, F | 1.97, 1.78 | Ni, F | 1.95, 1.77 |
Appendix C Electronic structure calculations
For our density functional theory (DFT) calculations, we use the linearized augmented plane wave method Blaha:2001 , with added orbital-dependent correction (so called DFT+U). The chosen orbitals for this Hubbard-like term are the -states of the TM, scheme of Ref. [Anisimov:1993_a, ] is used to avoid double counting and GGA to the density functional is employed. Scalar relativistic approach to the spin-orbit interaction is taken from the very beginning of our calculations. Convergence with respect to the number of points in the -space () is achieved already around , meaning that energies and are converged to several Ry while their difference is about an order of magnitude larger. Within this precision, we find no significant difference between in-plane directions, which agrees, assuming the single-ion model to be valid, with the perturbative argument [see Eq. (4) and below].
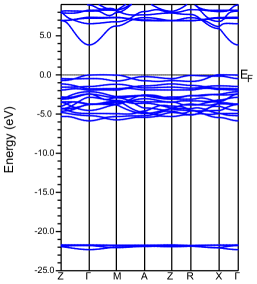
As described in the main text and Fig. 1, the main effect of increasing is to push the group B -bands away from the lower quintuplet of the -states and, if present (as for FeF2, CoF2, and NiF2), also from the group A -bands. This can be seen by comparing Fig. 8 (exemplifying the effect of large ) to the leftmost panel of Fig. 2. As a side remark, we note that the position of the low-lying fluorine states also depends on the TM ion type.
Figure 8 also clearly shows the “conduction band” (lowest lying unoccupied parabolic band). Its effective mass is moderately anisotropic and smaller than the free electron rest mass ; wave functions of this band are largely localized in the interstitial space. Averaged over directions, we find about 0.22 for MnF2, 0.25 for FeF2, 0.51 for CoF2, and 0.36 for NiF2.
References
- (1) V. Baltz et al., Rev. Mod. Phys. 90, 015005-1 (2018); T. Jungwirth et al., Nat. Phys. 14, 200 (2018).
- (2) Ø. Johansen and A. Brataas, Phys. Rev. B 95, 220408 (2017).
- (3) S. M. Rezende et al., Phys. Rev. B 93, 014425 (2016).
- (4) S.M. Wu et al., Phys. Rev. Lett. 116, 097204 (2016).
- (5) T. Moriyama et al., Appl. Phys. Lett. 106, 162406 (2015).
- (6) S.A. Gulbrandsen and A. Brataas, Phys. Rev. B 97, 054409 (2018).
- (7) A.N. Bogdanov et al., Phys. Rev. B 75, 094425 (2007).
- (8) J. Strempfer et al., Phys. Rev. B 69, 014417 (2004).
- (9) P. Novák et al., Phys. Stat. Sol. (B) 243, 563 (2006).
- (10) A.S. Carriço et al., Phys. Rev. B 50, 13453 (1994).
- (11) I.S. Jacobs, J. Appl. Phys. 32, s61 (1961).
- (12) V. Jaccarino et al., J. Magn. Magn. Mater. 31-34, 1117 (1983).
- (13) T. Nagamiya et al., Adv. Phys. 4, 1 (1955).
- (14) M. Balkanski et al., J. Chem. Phys. 40, 1897 (1964).
- (15) H. Shi et al., Phys. Rev. B 69, 214416 (2004).
- (16) P. Dufek et al., Phys. Rev. B 48, 12672 (1993).
- (17) P. Dufek et al., Phys. Rev. B 49, 10170 (1994).
- (18) S. López–Moreno et al., Phys. Rev. B 85, 134110 (2012).
- (19) M.T. Hutchings et al., J Phys C: Sol St Phys 3, 307 (1970).
- (20) M.E. Lines, Phys. Rev. 156, 543 (1967).
- (21) A. Ishikawa and T. Moriya, J. Phys. Soc. Jpn. 30, 117 (1970).
- (22) J.A. Barreda–Argüeso et al., Phys. Rev. B 88, 214108 (2013).
- (23) G. Valerio et al., Phys. Rev. B 52, 2422 (1995).
- (24) R. Santos-Ortiz et al., Appl. Mater. Interfaces 5, 2387 (2013).
- (25) P. Thunström et al., Phys. Rev. Lett. 109, 186401 (2012).
- (26) J. Pištora et al., J. Phys. D:Appl. Phys. 43, 155301 (2010).
- (27) Z. Yang et al., Trans. Nonferrous Met. Soc. China 22, 386 (2012).
- (28) V.V. Eremenko and A.I. Zvyagin, Sov. Phys.‐Solid State 6, 1013 (1964), in Russian: Fiz. Tverd. Tela 6, 1013 (1964).
- (29) P.A. Young, Thin Sol. Films 4, 25 (1969).
- (30) H. Kamimura and Y. Tanabe, J Appl Phys 34, 1239 (1963).
- (31) H. Subramanian and J.E. Han, J. Phys.: Cond. Matter 25, 206005 (2013).
- (32) Within the single-ion model, the ground state of a Mn2+ ion is an orbital singlet according to the Hund’s rule. Hence, the ground state cannot be split by crystal field and the only way for , defined above Eq. (4), to come into play is to mix the singlet with an excited state. Energy of the latter is orders of magnitude larger than the crystal field splittings in FeF2, CoF2, and NiF2 so that the perturbative effect of on the Mn2+ ground state and hence MCA is small.
- (33) W.H. Baur and A.A. Khan, Acta Cryst. B 27, 2133 (1971).
- (34) E. Stavrou et al., Phys. Rev. B 93, 054101 (2016).
- (35) This is a standard result of Weiss theory of magnetism [see, for instance, Eq. (11) in Phys. Rev. 123, 425], where is assumed for interaction between a given localized magnetic moment and a mean field produced by all other magnetic moments.
- (36) Note that the calculated value of magnetic moment in Tab. 1 is significantly lower than the experimental value. This suggests that appreciable should in fact be used.
- (37) Band structure does not change when direction of magnetic moments is varied unless spin-orbit interaction is included in the DFT calculations.
- (38) P. Blaha et al., WIEN2k, An Augmented Plane Wave + Local Orbitals Program for Calculating Crystal Properties (Karlheinz Schwarz, Techn. Universität Wien, Austria, 2001).
- (39) V.I. Anisimov et al., Phys. Rev. B 48, 16929 (1993).