Geometric and magnetic properties of coronal flux ropes associated with CMEs leading to geomagnetic storms
Abstract
We have studied three Interplanetary Coronal Mass Ejections (ICMEs) having clear signatures of magnetic cloud (MC) arrival at 1 AU and their associated solar sources during 2011 to 2013. Comparing the axial magnetic field strength (B0) of the near-Sun coronal flux-ropes with that of the MC at 1 AU, we have found that the average inferred value of B0 at 1 AU assuming the self-similar expansion of the flux-rope is two times smaller than the value of B0 obtained from the results of MC fitting. Furthermore, by comparing the initial orientation of the flux-rope near the Sun and its final orientation at 1 AU we have found that the three CMEs exhibited more than 80∘ rotation during its propagation through the interplanetary medium. Our study suggests that although the near-Sun magnetic properties of coronal flux-ropes can be used to infer the field strength of the associated MC at 1 AU, it is difficult to estimate the final orientation of the MC axis in order to predict the geo-effectiveness of the ICMEs.
keywords:
Flares, coronal mass ejections (CMEs), magnetic fields.1 Introduction
Predicting the strength and orientation of the magnetic field associated with the interplanetary coronal mass ejections (ICMEs) is one of the key challenges in space weather physics. Study of both the remote-sensing and in-situ data are required in order to infer the magnetic properties of ICMEs in advance. Recent studies reveal that the magnetic properties of near-Sun coronal flux ropes are well-correlated with that of the ICMEs at 1 AU (Gopalswamy et al., 2017). In this work, we aimed to study the geometric and magnetic properties of near-Sun coronal flux-ropes and that of ICMEs in order to understand the geo-effectiveness of the associated magnetic clouds.
CME Tilt Tilt B0 [mG] at 10 Rs at 10 Rs Tilt B0 Helicity in LASCO angle on angle from at 10 Rs [ Mx] [ Mx] angle of [nT] at [ Mx] [ Mx] [Mx2] of dd/mm/yy solar disk GCS fitting PEA FRA PEA FRA PEA FRA the MC 1 AU at 1 AU at 1 AU the MC 01/19/2012 74∘ 60∘ 46.9 32.2 9.4 6.4 12.8 8.8 -40∘ 9 0.9 0.1 9 15:12 UT 07/12/2012 45∘ 52∘ 130 48 1.4 5.3 0.6 2.2 -62∘ 43 29.6 32.1 9.5 16:48 UT 03/15/2013 53∘ 70∘ 40 – 3.8 – 1.9 – -12∘ 13 0.6 0.3 2 07:12 UT
2 Summary and Discussion:
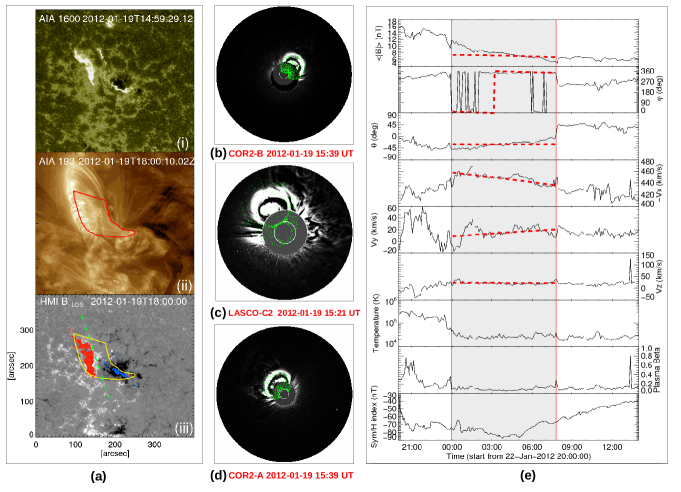
Estimating the reconnection flux underlying the post eruptive arcades (PEA) and the cumulative flare ribbon area (FRA)(Figure 1), we have calculated the near-Sun properties of the coronal flux-ropes using the FRED model (Gopalswamy et al. 2017) for the three CMEs listed in Table 1. B0 of the coronal flux ropes at 10 RS for these events ranges between 32 to 130 mG for both the PEA and FRA methods, whereas using the MC fitting method (Wang et al. 2016) we have found that B0 of the associated MCs at 1 AU ranges between 9 to 43 nT. The average observed value of B0 for the MCs at 1 AU is 22nT for these three events. This value is almost two times larger than the average inferred value of B0 ( 13 nT) at 1 AU assuming the self-similar expansion of the CMEs. Comparing the orientation of the flux-rope axis we have found that the MCs at 1 AU show 80 to 110∘ deviation from the initial orientation near the Sun. This significant deviation in the axis orientation of the MCs suggests that the interplanetary deflection and rotation of the CMEs need to be quantified in order to predict the geo-effectiveness of the associated ICMEs.
Acknowledgements We sincerely thank Dr. Yuming Wang, USTC, China for providing the numerical codes to fit the MC structure from the in-situ data.
References
- [] Gopalswamy, N., Akiyama, S., Yashiro, S., Xie, H. (2017), J. Atmos. Sol. Terr. Phys, https://doi.org/10.1016/j.jastp.2017.06.004
- [] Wang, Y., B. Zhuang, Q. Hu, R. Liu, C. Shen, and Y. Chi. (2016), J. Geophys. Res. Space Physics, 121, 9316–9339