Repeated transient jets from a warped disk in
the symbiotic prototype Z And:
a link to the long-lasting active phase
Abstract
Active phases of some symbiotic binaries survive for a long time from years to decades. The accretion process onto a white dwarf (WD) sustaining long-lasting activity, and sometimes leading to collimated ejection, is not well understood. We present the repeated emergence of highly collimated outflows (jets) from the symbiotic prototype Z And during its 2008 and 2009-10 outbursts and suggest their link to the current long-lasting (from 2000) active phase. We monitored Z And with the high-resolution spectroscopy, multicolor –and high-time-resolution–photometry. The well-pronounced bipolar jets were ejected again during the 2009-10 outburst together with the simultaneous emergence of the rapid photometric variability ( mag) on the timescale of hours, showing similar properties as those during the 2006 outburst. These phenomena and the measured disk-jets connection could be caused by the radiation-induced warping of the inner disk due to a significant increase of the burning WD luminosity. Ejection of transient jets by Z And around outburst maxima signals a transient accretion at rates above the upper limit of the stable hydrogen burning on the WD surface. The enhanced accretion through the disk warping, supplemented by the accretion from the giant’s wind, can keep a high luminosity of the WD for a long time, until depletion of the disk. In this way, the jets provide a link to long-lasting active phases of Z And.
Subject headings:
Stars: binaries: symbiotic – stars: individual: (Z And) – ISM: jets and outflows1. Introduction
Symbiotic stars are the widest interacting binaries with orbital periods of a few years. They consist of a red giant (RG) as the donor and a white dwarf (WD) as the accretor (Boyarchuk, 1967; Kenyon, 1986). Symbiotic stars are well detached binary systems (Mürset & Schmid, 1999), which implies that their activity is triggered via the wind mass transfer.
According to the behavior of optical light curves (LC) we distinguish between the quiescent and active phases. During quiescent phases, the WD accretes throughout the accretion disk formed from the giant’s wind. This process heats up the WD to K and increases its luminosity to , which in return ionizes a portion of the neutral wind from the giant, giving rise to the nebular emission (Seaquist et al., 1984). Optical LCs are characterized with a periodic wave-like variation. No sudden brightenings are indicated. On the other hand, active phases are characterized by a few magnitude (multiple) brightening(s)–outbursts–observed on the timescale of a few months to years/decades (see, e.g., historical LCs of FN Sgr, Z And, AX Per of Brandi et al., 2005; Leibowitz & Formiggini, 2008, 2013) with signatures of a mass outflow (e.g., Fernández-Castro et al., 1995; Esipov et al., 2000; Sokoloski et al., 2006; McKeever et al., 2011). They are called ‘Z And-type’ outbursts, because they were observed in the past for a prototype of the class of symbiotic stars – Z And (Kenyon, 1986). In rare cases, these outbursts are followed by collimated ejection. To date, its signature in the optical spectra has been recorded only for a few objects: MWC 560 (e.g. Tomov et al., 1990), Hen 3-1341 (Tomov et al., 2000; Munari et al., 2005), StH 190 (Munari et al., 2001), Z And (Skopal & Pribulla, 2006), BF Cyg (Skopal et al., 2013) and St 2–22 (Tomov et al., 2017).
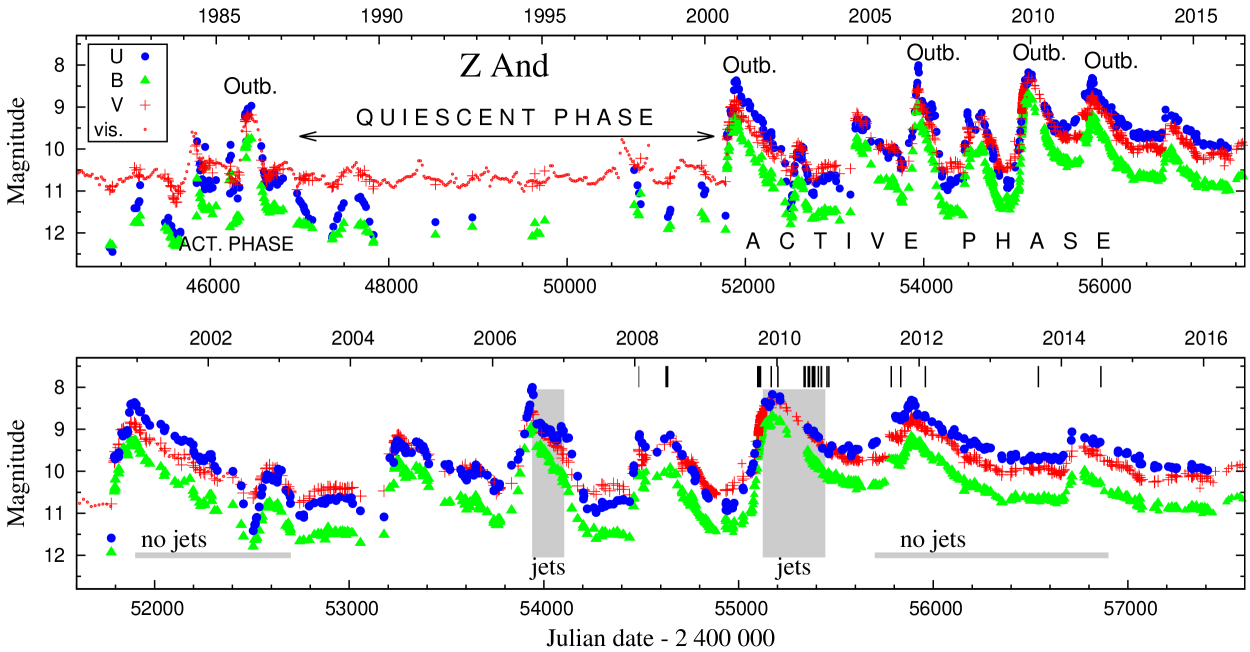
The Z And binary consists of a late-type M4.5 III RG and a WD accreting from the giant’s wind on the 758-day orbit (e.g. Nussbaumer & Vogel, 1989; Fekel et al., 2000). During the quiescent phase, a high luminosity of its hot component, on the order of (Mürset et al., 1991; Skopal, 2005), is generated by the stable nuclear burning of hydrogen on the WD surface (e.g., Paczyński & Rudak, 1980). We call these systems nuclearly powered.111For a comparison, accretion-powered systems generate the luminosity of the order of by converting the gravitational potential energy of the WD via the accretion disk. In September 2000, Z And started a new active phase showing a series of outbursts with the main optical maxima in December 2000, July 2006, December 2009 and December 2011 (see Fig. 1). At/after the 2006 maximum, highly collimated bipolar jets were detected for the first time as the satellite emission components to H and H lines (Skopal & Pribulla, 2006). Their presence was confirmed by Burmeister & Leedjärv (2007) and Tomov et al. (2007). Temporal development of jets and their possible origin were investigated by Skopal et al. (2009). The event of jets was transient, being detected through the end of 2006, along the decrease of the star’s brightness. During this period, a low amplitude irregular photometric variation from the low stage ( mag) increased its amplitude to mag on the timescale of hours. Its source was identified with a large disk around the WD. The authors ascribed these phenomena to a disruption of the inner parts of the disk caused by its radiation-induced warping.
In this contribution, we present an analysis of collimated mass outflow, which we measured again during the 2008 and 2009–10 outbursts. We compare the new jet event with that from the 2006 outburst to establish a more trustworthy disk-jets connection. In this way, we aim to understand better accretion process onto the WD that keeps the current active phase of Z And for a long time, showing outbursts with or without jets. Our observations are described in Sect. 2. Their analysis and results are introduced in Sect. 3. A discussion of the results and a summary are provided in Sects. 4 and 5, respectively.
2. Observations and data reduction
Our observations of Z And during its current active phase, from 2008 to 2014, were carried out at different observatories.
2.1. Spectroscopy
(i) At the Crimean Astrophysical Observatory (denoted as CrAO in Table 1) the high-resolution spectra were performed with the coudé spectrograph of the 2.6 m ZTSH telescope. The size of the ANDOR IKON-L CCD detector DZ936N was 20482048 pixels. The spectral resolving power was R25 000 around H. The low-resolution spectra (R1 000) were obtained using a spectrograph mounted at the Nasmyth telescope focus. The detector was a SPEC-10 CCD camera (1340100 pixels). The spectrophotometric standard HR 8965 was observed each night to calibrate the measured flux in the star’s spectrum. The primary reduction of the spectra, including the bias subtraction and flat fielding, was performed with the SPERED code developed by S. I. Sergeev at the CrAO.
(ii) At the Ondřejov Observatory (Ondr.), spectra of Z And were secured with a SITe-005 8002030 CCD detector attached to the medium 0.7-m camera of the coudé focus of the Ondřejov 2.0 m telescope. The spectra were obtained between June 2010 and July 2014, and have a linear dispersion of 17.2 Å/mm and a 2-pixel resolving power of about 12 600 (11–12 km s-1 per pixel). Standard initial reduction of CCD spectra was carried out using modified MIDAS and IRAF packages. Final processing of the data was done with the aid of the SPEFO-package software (Horn et al., 1996; Škoda, 1996).
(iii) At the David Dunlap Observatory, University of Toronto (DDO), spectra of Z And were performed with a Jobin Yovon Horiba CCD detector (2048512 pixels of 13.5 m size) attached to the single dispersion slit spectrograph of the Cassegrain focus of the 1.88 m telescope. The slit width was 240 m corresponding to 1.5 arcsec at the focal plane. Around the H region, the resolving power was 12 000. Standard reduction of the spectra was performed with the IRAF-package software.
A journal of the spectra is given in Table 1.
| Date | JD | Region | Obs.⋆ |
| (mm/dd/yyyy) | 2 45… | (nm) | |
| 2008 burst | |||
| 01/23/2008 | 4488.547 | 642-670 | DDO |
| 06/11/2008 | 4628.844 | 642-670 | DDO |
| 06/11/2008 | 4628.856 | 461-491 | DDO |
| 06/13/2008 | 4630.836 | 642-670 | DDO |
| 06/19/2008 | 4636.822 | 642-670 | DDO |
| 2009-10 outburst | |||
| 09/26/2009 | 5100.535 | 335-740 | CrAOa |
| 10/01/2009 | 5106.237 | 653-659 | CrAOb |
| 10/08/2009 | 5113.297 | 653-659 | CrAOb |
| 12/02/2009 | 5168.235 | 653-659 | CrAOb |
| 01/05/2010 | 5202.273 | 651-661 | CrAOb |
| 05/21/2010 | 5337.499 | 353-757 | CrAOa |
| 05/25/2010 | 5342.465 | 653-661 | CrAOb |
| 06/10/2010 | 5358.508 | 626-677 | Ondr. |
| 06/16/2010 | 5364.561 | 626-677 | Ondr. |
| 07/01/2010 | 5379.472 | 651-661 | CrAOb |
| 07/02/2010 | 5380.503 | 622-674 | Ondr. |
| 07/13/2010 | 5391.509 | 626-677 | Ondr. |
| 08/01/2010 | 5410.481 | 651-661 | CrAOb |
| 09/24/2010 | 5464.434 | 647-665 | CrAOb |
| 2012 and 2014 brightenings | |||
| 08/10/2011 | 5784.379 | 639-691 | Ondr. |
| 09/28/2011 | 5833.270 | 640-691 | Ondr. |
| 02/02/2012 | 5960.221 | 640-691 | Ondr. |
| 09/04/2013 | 6540.445 | 641-688 | Ondr. |
| 07/22/2014 | 6861.495 | 641-688 | Ondr. |
| Notes: ⋆Observatory, aNasmyth, bcoudé | |||
2.2. Photometry
(iv) At the Skalnaté Pleso and Stará Lesná (pavilion G2) observatories, classical photoelectric measurements were carried out by single-channel photometers mounted in the Cassegrain foci of 0.6 m reflectors. Data are plotted in Fig. 1. Each value represents the average of the observations during a night. Corresponding inner uncertainties are of a few times 0.01 mag in the , and bands, and up to 0.05 mag in the band (see Vaňko et al., 2015a, b). The data were published by Skopal et al. (2012). New observations (from November 2011) will be published elsewhere (Sekeráš et al., in preparation). To get a better coverage of the investigated period, we complemented our photometry with the CCD measurements available at the AAVSO database. 222https://www.aavso.org/data-download.
(v) At the Stará Lesná observatory (pavilion G1) the high-time resolution CCD photometry was performed during nights on 06/24/2007, 09/21/2007 and 07/11/2008. The SBIG ST10 MXE CCD camera (21841472 pixels; 6.8 m) mounted at the Newtonian focus of the 0.5 m telescope was used (see Parimucha & Vaňko, 2005, in detail). The star BD+47 4192 ( = 8.99, = 0.41, = 0.14, = 0.19; Skopal et al., 2012, and references therein) was used as the standard star for both photoelectric and CCD observations.
(vi) At the Astronomical Observatory on the Kolonica Saddle, the fast CCD photometry was performed during the nights on 11/01/2009, 11/02/2009 and 08/14/2011. A FLI Pro Line PL1001E CCD camera with the chip 10241024 pixels (24 m) was attached to the Ritchey-Chretien telescope 300/2400 mm. The star TYC3641-00678-1 (B=9.43, V=9.05, Rc=8.83, Ic=8.62, Henden & Honeycutt, 1997) was used as the comparison. All CCD frames were dark subtracted, flat-fielded, and corrected for cosmic rays. Our high-time-resolution photometry is plotted in Fig. 4.
Arbitrary flux units of the high-resolution spectra around the H line were converted to absolute fluxes with the aid of magnitudes corrected for the H equivalent width (see Eq. (10) of Skopal, 2007). Magnitudes were converted to fluxes according to the calibration of Henden & Kaitchuck (1982) and Bessel (1979). Observations were dereddened with = 0.30 and resulting parameters were scaled to a distance of 1.5 kpc (Mürset et al., 1991; Mikołajewska & Kenyon, 1996). Orbital phase was calculated according to the ephemeris of the inferior conjunction of the cool giant (Fekel et al., 2000) as
| (1) |
3. Analysis and results
3.1. Photometric evolution
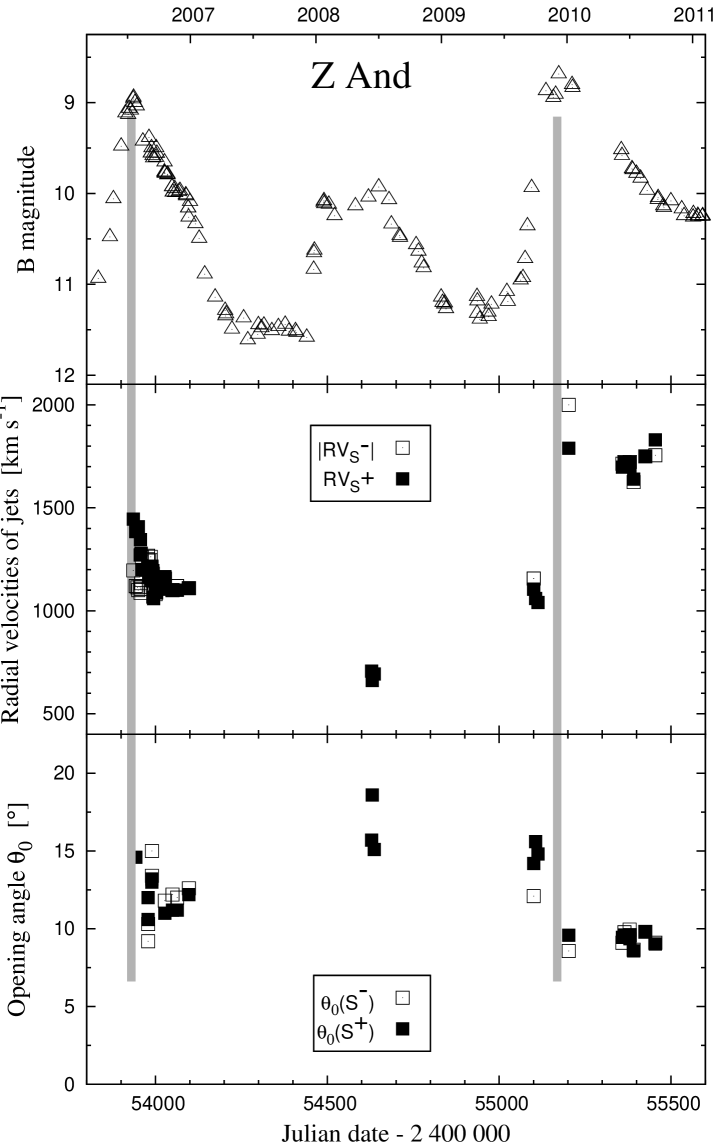
Figure 1 shows the LCs of Z And covering its quiescent and active phases from 1981. The recent active phase began in September 2000 (Skopal et al., 2000). Our spectra (Table 1) cover three brightenings in the recent evolution of the LC. The burst in 2008 with , the main outburst that peaked at on December 2009 and the 2012 and 2014 brightenings with and 9.0.
To justify the connection between the rapid photometric variability and ejection of jets as suggested by Skopal et al. (2009), we searched for a short-term photometric variability on the timescales of minutes to hours. During the 2007 quiescent phase, prior to the 2008 burst, we observed an irregular variation within mag, comparable with that of standard stars. During the 2008 burst, we observed light variations with mag on the timescale of 1–2 hours, whereas at the maximum of the main 2009 outburst, the light variations increased to mag and enlarged its timescale to 7–9 hours throughout the whole night (Fig. 4). Similar evolution in the rapid photometric variability was also indicated during the previous 2006 major outburst, when the jet features were measured for the first time (see Fig. 3 of Skopal et al., 2009).

3.2. Evolution of the H profile
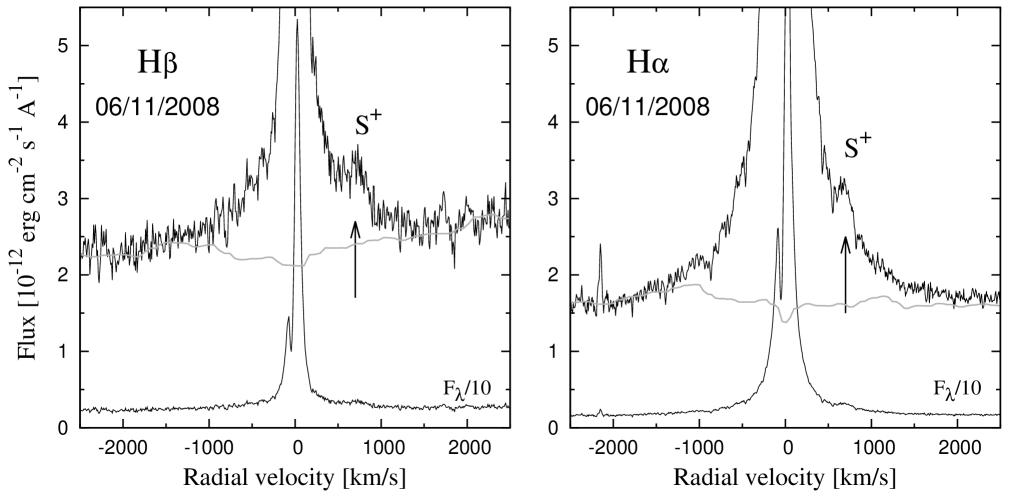
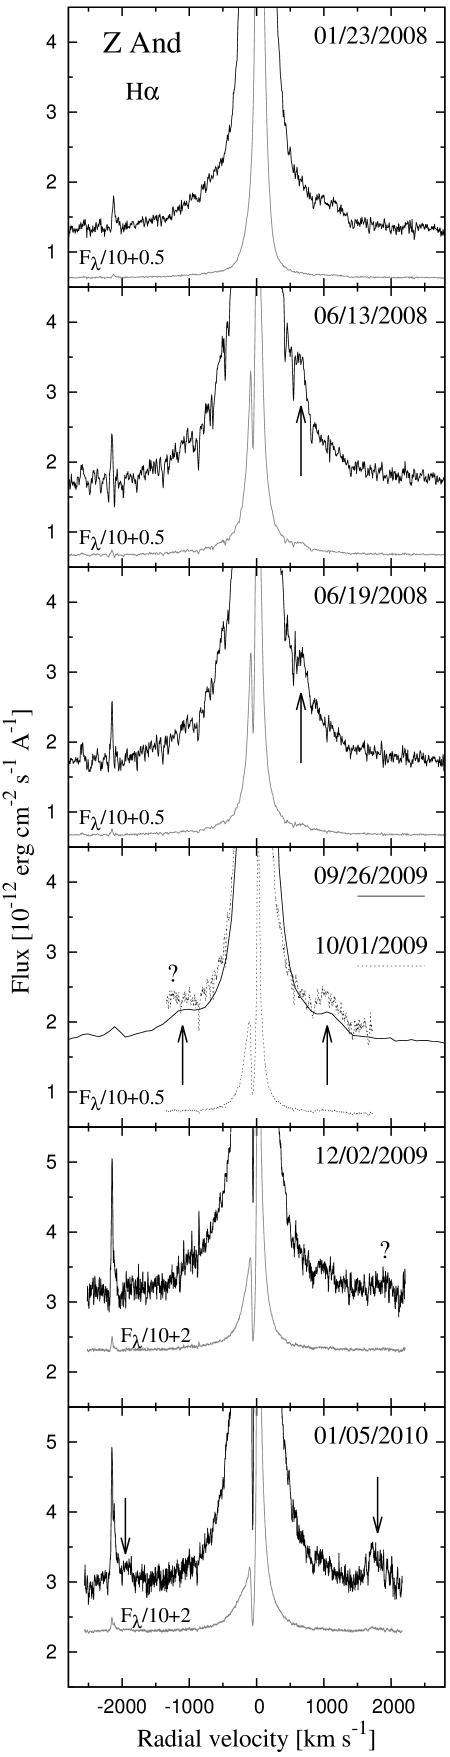
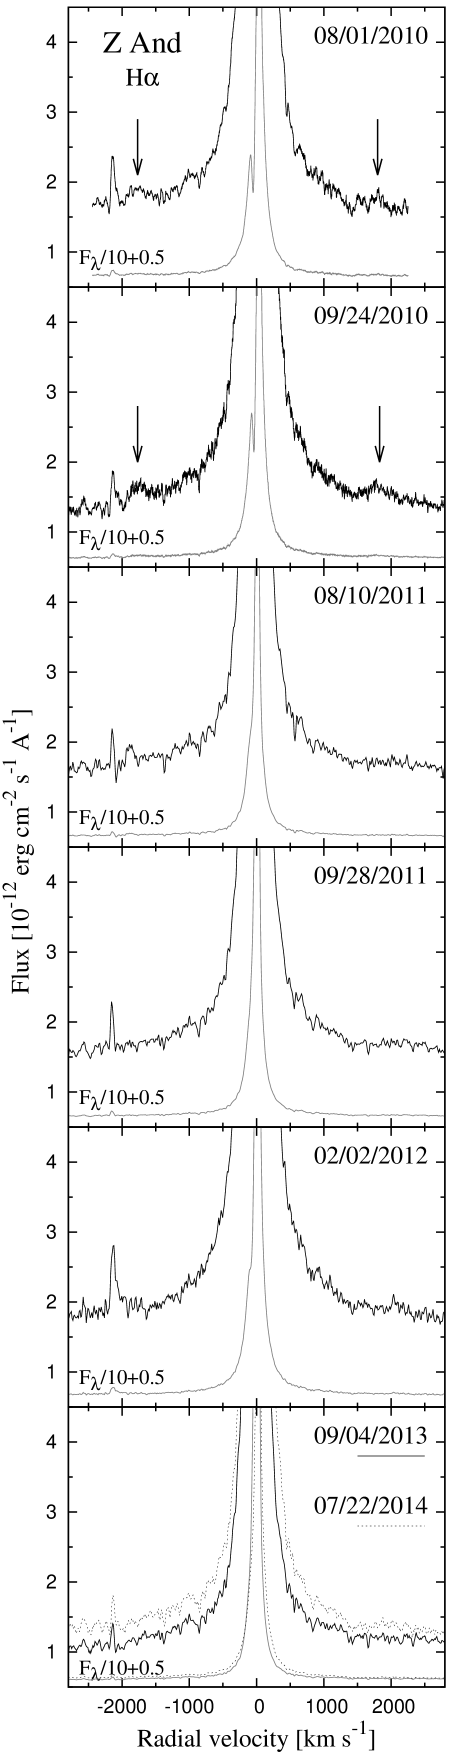
During the 2008 burst, the H line showed broad wings extended to km s-1 and a sharp absorption cutting the emission core at -50 km s-1. A faint satellite component was seen at 700 km s-1 (Fig. 3, spectra from January 23 to June 19, 2008). Its presence was confirmed by a similar feature in the H profile (Fig. 2).
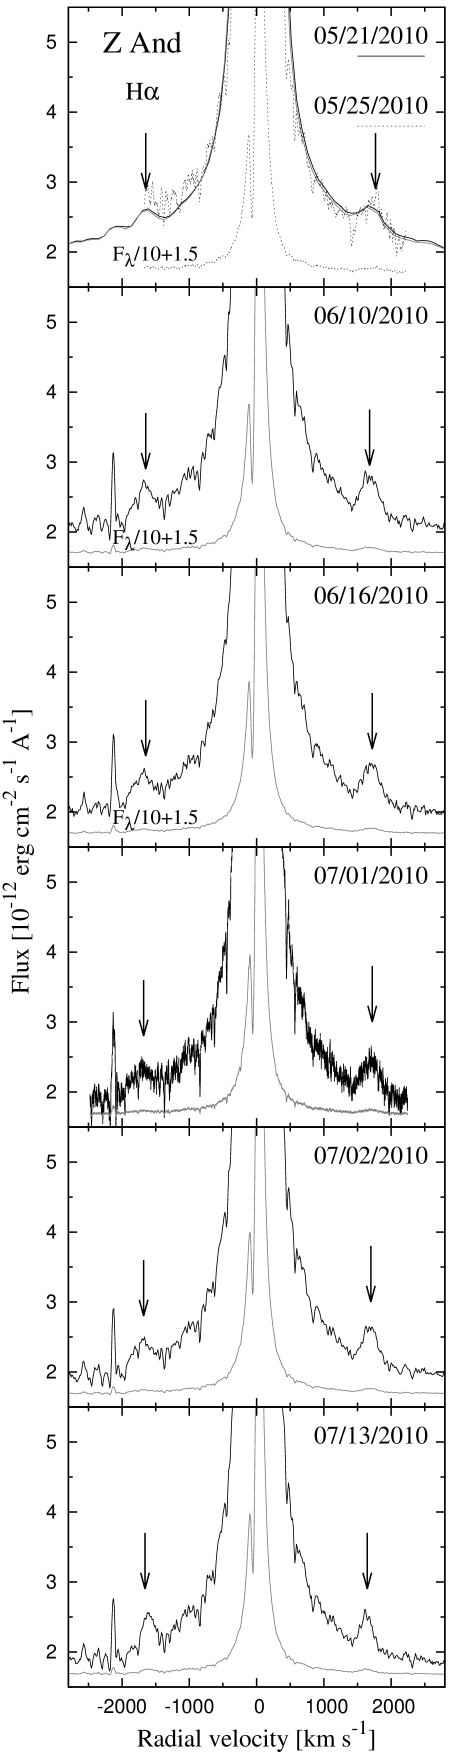
During the major 2009-10 outburst, the H profile was also of a P-Cyg type with broad wings (Fig. 3, spectra from September 26, 2009 to September 24, 2010). The first satellite components were recorded on September 26, 2009, prior to the light maximum, at km s-1. However, at the maximum of the star’s brightness (our spectrum from 12/02/2009) the satellite components were hardly recognizable. They appeared again when the brightness of Z And began to fall (spectrum from January 5, 2010). Their position with respect to the reference wavelength increased to km s-1 during January to September 2010 (Table 2, Fig. 6), when the star’s brightness gradually decreased by 1 magnitude in , from 8.2 to 9.2 (Fig. 1).
The last of our spectra taken around the following brightenings (December 2011 and January 2014; see Fig. 1) did not show any clear signatures of satellite components in the H profile. We observed a simple emission core with a reduced wings and the width of the line with respect to the 2009-10 outburst (Fig. 3).
3.3. Parameters of satellite components
To determine measured parameters of the satellite components, we isolated them from the whole line profile by fitting the emission line core and its extended wings with two Gaussian functions. Then the residual satellite emissions were compared with additional Gaussians. Using their fitted parameters (the central wavelength, maximum, , and the width ) we determined the radial velocity of satellite components, , their flux and the width . Resolution of our spectra allowed us to estimate uncertainties in to 1025 km s-1, in fluxes within 1020% of the observed values and in widths within 0.20.3 Å. The results are given in Table 2.
3.4. Physical parameters of jets
According to reasons discussed by Skopal et al. (2009), the geometry of the emitting medium that gives rise to the satellite components can be approximated by a narrow cone with the peak at the central object characterized with an opening angle . This implies that the measured narrow satellite components can be produced by highly collimated emitting particles – jets. Therefore, using the measured parameters of the satellite components, we can determine some physical parameters of jets.
3.4.1 Opening angle
Assuming that jets were launched with a constant velocity, , perpendicularly to the disk plane, which coincides with the orbital one (i.e. ), the opening angle can be approximated as
| (2) |
where is the orbital inclination (see Skopal et al., 2009). Corresponding parameters from Table 2, orbital inclination (Shagatova, 2017) and adopting yield the average value of the jet opening angle as
| (3) |
after its maximum. Prior to the maximum of the 2009-10 outburst, . Uncertainties were determined as standard error of function (2) using its total differential for the uncertainty in . Influence of uncertainties in and (Sect. 3.3) can be neglected. Individual values of are given in Table 2. Figure 6 depicts also data from the 2006 outburst recalculated for .
3.4.2 Emission measure
Assuming that (i) the jet radiation is produced by the recombination transitions in the H line, (ii) the medium is completely ionized, (i.e. ) and radiates at a constant electron temperature , the luminosity of jets in H is related to the line emissivity, , by
| (4) |
where is the volume emission coefficient in H, is the mean particle concentration and is the volume of the jets. For the optically thin medium of jets, the luminosity can be determined from the observed fluxes as . According to the definition of the emission measure, , and assumptions above, we can express it as,
| (5) |
The emission measure for one jet is of a few cm-3 for K) = 1.83 (e.g. Osterbrock, 1989) (Table 2).
| Date | EMjet | ||||||||
| mm/dd/yyyy | S- | S+ | S- | S+ | S- | S+ | S- | S+ | |
| 06/11/2008 | - | 707 | - | 2.3 | - | 194 | - | 15.7 | 3.4 |
| 06/13/2008 | - | 661 | - | 3.0 | - | 215 | - | 18.6 | 4.4 |
| 06/19/2008 | - | 693 | - | 1.7 | - | 183 | - | 15.1 | 2.5 |
| 09/26/2009⋆ | -1157 | 1105 | |||||||
| 10/01/2009† | 1060 | 2.3 | 290 | 15.6 | |||||
| 10/08/2009† | 1040 | 2.2 | 269 | 14.8 | |||||
| 12/02/2009 | no jets | ||||||||
| 01/05/2010 | -2000 | 1790 | 3.3 | 5.1 | 301 | 301 | 8.57 | 9.58 | 12.4 |
| 05/21/2010⋆ | -1670 | 1740 | |||||||
| 05/25/2010† | 1750 | 5.4 | 312 | 10.1 | |||||
| 06/10/2010 | -1714 | 1698 | 4.0 | 4.8 | 274 | 282 | 9.10 | 9.45 | 12.9 |
| 06/16/2010 | -1723 | 1721 | 3.7 | 4.2 | 296 | 290 | 9.78 | 9.60 | 11.6 |
| 07/01/2010 | -1723 | 1720 | 3.1 | 3.7 | 301 | 290 | 9.95 | 9.60 | 10.0 |
| 07/02/2010 | -1723 | 1703 | 3.1 | 3.9 | 290 | 280 | 9.59 | 9.36 | 10.3 |
| 07/13/2010 | -1625 | 1639 | 3.1 | 3.1 | 247 | 247 | 8.65 | 8.58 | 9.1 |
| 08/01/2010 | -1750 | 1750 | 1.8 | 2.0 | 301 | 301 | 9.80 | 9.80 | 5.6 |
| 09/24/2010 | -1755 | 1830 | 1.3 | 1.3 | 280 | 290 | 9.10 | 9.02 | 5.3 |
| Notes: ⋆low-resolution spectrum, †spectrum does not cover the component | |||||||||
3.4.3 Radius
The conical shape of jets defines their volume as , where is the solid angle of the jet nozzle. Using Eq. (4) the jet radius, , can be expressed by means of the parameters and as a function of ,
| (6) |
For average values of and of one jet measured during 2010 (Table 2, Eq. (3)), the average jet radius can be expressed as a function of as
| (7) |
3.4.4 Mass-loss rate
According to the mass continuity equation, the geometrical and kinematics parameters of the jets allow us to determine the mass-loss rate through jets as
| (8) |
where is the mean molecular weight and is the mass of the hydrogen atom. For the average value of the jet velocity during 2010, km s-1 (Table 2) and the angle of the jet nozzle of 9.°4, we obtain
| (9) |
and/or as a function of the radius as
| (10) |
for one jet. Determination of thus requires a knowledge of or (see Skopal et al., 2009, for details).

3.5. Comparison with the 2006 outburst
To date, bipolar jets in the form of satellite components to the H (H) line were identified in the spectrum of Z And only during the 2006 and 2009-10 outbursts (Fig. 1). Our monitoring of the latter showed that the spectroscopic and photometric characteristics of both outbursts are very similar. We summarize them as follows:
(i) The jets appeared around their optical maxima, and were gradually vanishing along the decrease of the star’s brightness. Thus the event of jets was transient (Figs. 6 and 7).
(ii) In both cases, large variation in were observed at the beginning of their emergence, around optical maxima, and then settled on a constant level (see Fig. 2 of Tomov et al. (2007), Fig. 6 of Skopal et al. (2009) and Fig. 6 here).
(iii) During both outbursts, rapid light variation on the timescale of hours within mag developed from irregular 0.02 mag fluctuations outside the outbursts. (see Fig. 3 in Skopal et al. (2009) and Fig. 4 here).
The outbursts diversified only in duration of the star’s brightness decline with jets, and in . For the 2009-10 outburst, the period with jets lasted for 10 months and satellite components settled on km s-1, whereas for the 2006 outburst the relevant quantities were 5 months and km s-1, respectively (Figs. 6 and 7).
4. Discussion
Here we discuss basic conditions of the jet’s ejection by the nuclearly powered WD in the symbiotic binary Z And, and its possible consequences for the accretion process during Z And-type outbursts of symbiotic stars.
Skopal et al. (2009) interpreted the ejection of jets during the 2006 outburst as a result of disruption of the inner parts of the disk due to the radiation-induced warping caused by a significant increase of the WD luminosity at the outburst maximum. Close similarity of both the outbursts with jets (Sect. 3.5) suggests their common nature.
However, there is no theoretical application of the radiation-induced warping of disks around WDs in symbiotic binaries. Therefore, we first briefly introduce main results of its application to selected types of objects.
4.1. On the radiation-induced warping of disks
Petterson (1977) found that the effect caused by the pressure of radiation from the center of an X-ray source on the disk structure is very important. Iping & Petterson (1990) confirmed that radiation forces can make rings of the disk precess in either direction, and change their inclination angle. In this way, they explained the inclination of the disk in Her X-1.333Her X-1 is an intermediate-mass X-ray binary containing an accreting neutron star with jets (van den Eijnden et al., 2018). Using a simple analytic approach, Pringle (1996) showed that even an initially flat disk is unstable to warping, because the surface of a warped disk is illuminated by a central radiation source in a non-uniform manner. Livio & Pringle (1996) showed that also the accretion disk around the central stars of PNe can become unstable to a radiation-induced self-warping. Livio & Pringle (1997) demonstrated that this effect is accompanied by a wobbling motion in both the inclination and azimuthal directions. They used the term ”wobble” to describe rather erratic motions. Pringle (1997) investigated the effect of radiation-induced warping on accretion disks around massive black holes in active galactic nuclei. He calculated that the axis of the jets can be severely misaligned from the normal to the outer disk. Southwell et al. (1997) derived radiation-induced precession of the disk with a timescale of the order of months for a strong supersoft X-ray source CAL 83. Wijers & Pringle (1999) explored the effect of self-induced warping of disks in different types of X-ray binaries. They found that at high luminosities the inner disk can tilt through more than 90, which may explain the torque reversals in systems such as 4U 1626-67.4444U 1626-67 is an ultra-compact X-ray binary bearing a neutron star with the orbital period of 42 min (Beri et al., 2018, and references therein).
For symbiotic stars, a disruption of the disk has been considered for the accretion-powered symbiotic system CH Cyg by Sokoloski & Kenyon (2003). They interpreted the change of the fastest variations (timescale of minutes) into smooth, hour-timescale variations by disruption of the inner disk in association with the mass ejection event. For the nuclearly powered symbiotic star Z And, Skopal et al. (2009) suggested that the jets ejection during its 2006 outburst could be also triggered by the radiation-induced disk warping.
In the following section, we will show how the basic conditions for the disk warping and jet ejection are supported by observations for the Z And outbursts with jets.
4.2. Indication of radiation-induced warping of the disk during Z And outbursts with jets
According to Sect. 4.1 the necessary ingredients for disk warping and jets ejection are: (i) The presence of a disk, (ii) emergence of a strong central radiation source, and (iii) an observational response of the wobbling motions of the disk. The corresponding critical results confirming these terms for the case of Z And are described as follows.
(i) The presence of a disk-like formation around the WD during active phases of symbiotic stars was proven by modeling their UV to near-IR SED (see Skopal, 2005). The disk-like structure is indicated by the two-temperature-type of the hot component spectrum. The cooler spectrum is produced by a warm stellar pseudophotosphere radiating at K, whereas the hotter one is represented by the highly ionized emission lines and a strong nebular continuum. The former is not capable of producing the observed nebular emission and thus the latter signals the presence of a strong ionizing source ( K) in the system, which is not seen directly by the outer observer. This type of the SED can be explained by a disk-like structure of the hot component viewed under a high inclination angle. Then the flared outer rim of the disk (which is the warm pseudophotosphere indicated by model SED) occults the central ionizing source in the line of sight, while the nebula above/below the disk can easily be ionized (see Fig. 27 of Skopal, 2005).
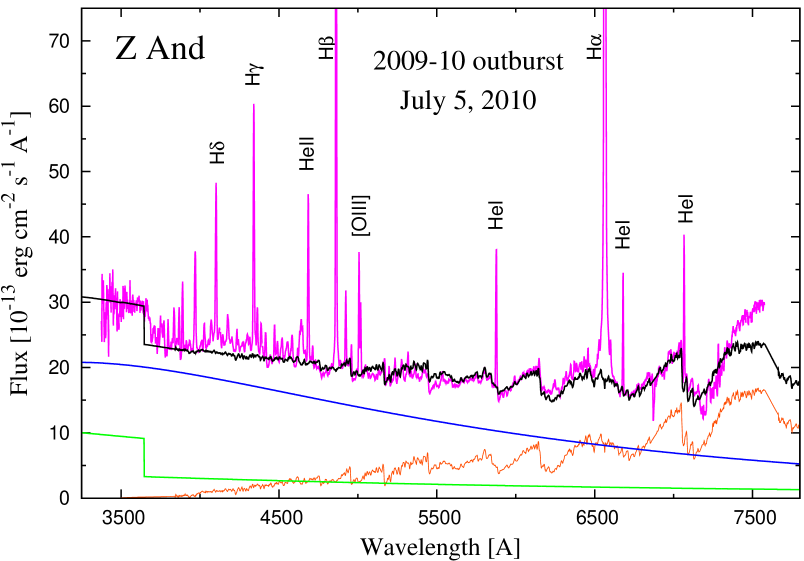
During the 2009-10 outburst of Z And, creation of such a disk around the burning WD was documented by models of SED from September 2009 to November 2010 (see Fig. 8 of Tarasova & Skopal, 2012). Here, Fig. 5 shows example of a representative model SED of the optical spectrum from July 5, 2010. The two-temperature-type of the hot component spectrum consists of a stellar radiation produced by a warm pseudophotosphere (the cooler component) and a strong nebular emission (the hotter component). The former radiates at K and has the luminosity of (the blue line in the figure), while the latter composes of the nebular continuum with a high emission measure cm-3 (the green line) and emission lines of highly ionized elements (e.g. H I, He I, He II, [O III]). The warm pseudophotosphere generates the flux of hydrogen ionizing photons s-1, which is not capable of producing the observed that requires s-1 for the total hydrogen recombination coefficient (e.g., Nussbaumer & Vogel, 1987). This implies that the warm pseudophotosphere cannot be a sphere, but a disk, as described above. Independently, the presence of jets indicates the presence of a disk, because jets require an accretion disk (e.g. Livio, 1997).
(ii) The emergence of a strong central radiation source is connected with outbursts, when a significant increase of the central source luminosity is indicated. For example, the emission measure of cm-3 requires the luminosity of the ionizing source to be of the order of (see Skopal et al., 2017, in detail). Also a high cm-3, as indicated around the maximum of the 2006 outburst (see Sect. 3.1. of Skopal et al., 2009), suggests similarly high luminosity. For the 2000-03 outburst, Sokoloski et al. (2006) estimated the hot star luminosity to , lasting approximately for one year. Thus the high luminosity of the central source during outbursts can illuminate the disk, which can become unstable to warping.
(iii) Observational response of the radiation-induced warping of the disk can be associated with the higher-amplitude photometric variability ( mag) on the timescale of hours that emerges exclusively during major outbursts, during which the bipolar jets are launched (Fig. 4). According to models SED, this type of variability is produced by the warm pseudophotosphere, i.e., the outer rim of the disk, because its contribution dominates the passbands (see Fig. 5 and point (i) above). In this way, we directly indicate the response of the disk warping in the form of the short-term variations in the continuum. As the dynamical timescale of the disk is comparable with the timescale of the smooth light variations (see Appendix A), this can be caused by a variable projection of the disk surface into the line of sight. We thus observe wobbling of the outer parts of the disk – in agreement with the general view that the warped disk starts to wobble or precess (Livio & Pringle, 1997, Sect. 4.1). Alternatively, the smooth light variations could be partly caused by the brightness variation of the outer disk due to reprocessing flickering light from its inner warping part (see Appendix B).
4.3. Jets’ radial velocities from the warping disk
Complex variations in around the maxima of both 2006 and 2009-10 outbursts (Sect. 3.5) could also be a direct result of the radiation-induced disk warping. Assuming jets to be perpendicular to the inner disk, their initial chaotic wobbling motions can produce shifts in due to the different inclination of a jet to the line of sight, as considered for PNe by Livio & Pringle (1997). One can also imagine that the twisted inner disk can cause that axis of both jet nozzles not to be parallel, which causes the observed jet’s asymmetry (see Fig. 6 of Skopal et al., 2009).
However, after a short time of 1 and a few months, the values of settled at around km s-1 and (1700 – 1800) km s-1 for 2006 and 2009-10 outburst, respectively. During the small 2008 burst, the only present S+ component was located at 700 km s-1 (Table 2). This suggests that the wobbling motions of the disk ceased.
Diversity of the final during each outburst could be caused by different conditions for the radiation-driven warping during these events. According to Pringle (1996), the radiation-driven warping of the disk can occur at radii, which depend on the central star mass and luminosity, accretion rate, and viscosities in the disk. During the Z And-type outbursts, additional energy is liberated by thermonuclear burning on the WD surface due to a transient high accretion rate (see, e.g., Skopal et al., 2017, for AG Peg). Depending on its quantity during different outbursts with different properties of the disk, the warping can occur at different radii. Qualitatively, the material liberated at different heights above the WD then converts different amounts of the gravitational potential energy into the kinetic energy at its accretion and thus can be expelled at different velocities in the form of jets. The energy power of these outbursts, as given by their brightness maximum and duration, seems to be consistent with this view (see Fig. 1).
4.4. Disk-jets connection in Z And
Figure 7 shows the evolution of the measured flux of jets and the effective radius of the warm pseudophotosphere, , along the 2006 and 2009-10 outbursts. Note that the disk radius (e.g., Eq. (11) of Skopal et al., 2011). Effective radii were derived from modeling the SED during the 2009-10 outburst (see Table 5 of Tarasova & Skopal, 2012). From the 2006 outburst, there is only one estimate of available around the optical maximum (Skopal et al., 2009). Gradual decrease of the disk radius and the flux of jets along the decline of the star’s brightness implies a gradual dilution of the disk.
Shrinking of the disk radius is also indicated by the radial velocities of the absorption component in the H profile that decelerate along the decline of the star’s brightness (bottom panel of Fig. 7). This effect can be a result of expansion of the outer parts of the disk leading to a shrinkage of the optically thick part of the warm pseudophotosphere. Therefore, the optically thick wind in the H line at/above the warm pseudophotosphere will also originate at smaller radii, where it is driven outside with a smaller velocity.
Below we describe how the disk–jets connection can be understood in the context of the accretion process onto the WD during Z And outbursts with jets.

4.4.1 On the accretion during Z And outbursts with jets
Significant increase of the WD luminosity around the optical maximum, the indication of the disk warping (Sects. 4.2 and 4.3), and the presence of jets is a result of a significant increase of the accretion rate through the disk, so that an excess of angular momentum of the accreting material has to be removed via jets. A fraction of the disk material, accreted onto the WD, enhances nuclear shell burning on its surface. As a consequence, the high radiation output makes the surrounding disk unstable to warping and enhances the stellar wind during outbursts (see Sect. 4.5 for some details). The rest of the accreting material is liberated in the form of jets, whose kinetic energy comes from their accretion energy. This leads to a gradual removal of the disk material from its inner parts onto the WD and into the jets. As a result, the gradual decrease of fueling the WD and the release of the accretion energy lead to a gradual decline of the star’s brightness, shrinking of the disk radius and vanishing of the jets as documented by observations in Fig. 7.
In a nutshell, expanding of the outer parts of the disk and sucking its inner parts by the luminous WD via the radiation-induced warping lead to a gradual dilution of the disk. This gives reasons for the observed disk-jets connection and explains why the launching of jets is transient.
4.5. On jets and Z And-type outbursts
During quiescent phases of symbiotic stars, no jets have been indicated, although their WDs accrete throughout the accretion disk and, in most cases, at high rates of to power their high luminosities by stable hydrogen burning on the WD surface (e.g., Paczyński & Żytkow, 1978; Hachisu et al., 1996; Shen & Bildsten, 2007). To date, jets were indicated only during outbursts (see Sect. 1), during which a large optically thick disk is created around the WD (Skopal, 2005). The presence of jets thus confirms the presence of the disk and constrains accretion at a high rate, although enhanced mass-outflow from the hot component is directly indicated (see below).
For the nuclearly powered symbiotics, the appearance of transient jets signals transient accretion at rates above the limit of the stable hydrogen burning on the WD surface. According to theoretical predictions, at these rates the luminosity of the burning WD can increase to the Eddington limit (e.g., Fig. 2 of Shen & Bildsten, 2007), and the mass-outflow from the WD in the form of wind enhances (Hachisu et al., 1996). Both characteristics are well supported by observations. (i) The high luminosity of the WD, burning hydrogen above the stable limit, was recently evidenced for AG Peg during its 2015 Z And-type outburst (Skopal et al., 2017). For Z And, the WD’s luminosity of the order of was determined for the 2000-03, 2006 and 2009-10 outbursts (see the point (ii) of Sect. 4.2). (ii) Enhanced mass-outflow via the wind is directly indicated by broadening of emission lines during outbursts (e.g. Fernández-Castro et al., 1995). Modeling the broad H wings, Skopal (2006) found an increase of the mass-loss rate via the wind from hot components during outbursts to , i.e., factor of higher with respect to values from quiescent phases.
Appearance of jets during Z And-type outbursts thus manifests their nature by nuclear burning of hydrogen on the WD surface at rates above the upper limit of the stable burning. The highly energetic events we observe during these outbursts (the luminosity close to the Eddington value and the wind outflow at ) require a relevant source of material that effectively fuels the WD. Indication of a large neutral disk at/around the orbital plane during Z And-type outbursts was described in the point (i) of Sect. 4.2. According to Cariková & Skopal (2012) such a disk can be formed during outbursts by compression of the enhanced wind toward the equatorial plane due to rotation of the WD. This means that the disk consists of the material previously accreted onto the WD from the giant. Due to the thermal warping, this material is reaccreted again, which prolongs the period with a high luminosity. The continuous flow of material from the giant’s wind helps to refill in the disk until the next possible instability will cause another (out)burst. This process can repeat up to depletion of the disk formed during outbursts. Then an accretion disk will be created from the giant’s wind, and the system enter a quiescent phase.
According to Leibowitz & Formiggini (2008), the main active phases of Z And last approximately of 15–20 years and appear quasi-periodically with a separation of their centers by years (see their Fig. 1). Assuming this evolution also for the current active phase, it should cease around 2020.
5. Summary
We continued monitoring of the prototypical symbiotic star Z And after its major 2006 outburst, during which two-sided jets in the optical spectrum were indicated for the first time. We used the high-resolution spectroscopy around H, multicolor photometry, and high-time-resolution photometry to search for the reappearance of jets during the following outbursts of the current active phase (Fig. 1). Our findings may be summarized as follows.
- 1.
-
2.
The evolution of jets during both the 2006 and the 2009-10 outbursts was similar. The jets appeared around the outburst maxima, weakened along the decline of the star’s brightness, and ceased after 5 and 10 months during 2006 and 2009-10 outbursts. A large variation in jets radial velocities was measured at their emergence, but after 1–3 months they settled on a constant level of and km s-1, respectively (Sect. 3.5, Fig. 6).
-
3.
During both outbursts, a smooth light variation within mag on the timescale of hours developed from rapid, 0.02 mag, stochastic fluctuations outside the outbursts (Sects. 3.1 and 3.5, Fig. 4). This type of variability is produced by the outer rim of the flared disk that develops during outbursts (see point (iii) of Sect. 4.2).
- 4.
-
5.
Jets launched by nuclearly powered symbiotics require transient accretion at rates above the upper limit of the stable hydrogen burning on the WD surface. The jets thus prove the nature of Z And-type outbursts by their ignition at these rates (Sect. 4.5). Then the WD generates the luminosity of the order of and drives the wind at .
-
6.
The large disk created at the beginning of the outbursts ( , Fig. 7) consists of the material originally accreted onto the WD from the giant (Cariková & Skopal, 2012). It represents a reservoir of mass for fueling the burning WD, because its inner part can be reaccreted via the radiation-induced warping. In this way, a high luminosity of the burning WD can be sustained for a longer time, until depletion of the disk (Sect. 4.5). The jets thus signal the presence of the reaccretion process, providing a link to long-lasting active phases of Z And.
Observations of transient jets along the decline from the optical maximum of some Z And-type outbursts (to-date observed for Hen 3-1341 (Munari et al., 2005), Z And (e.g. Burmeister & Leedjärv, 2007) and BF Cyg (Skopal et al., 2013)) represent new challenges for the theoretical modeling of the radiation-induced warping of disks formed during outbursts of symbiotic stars. This should provide us with a better understanding of the accretion process during nuclearly powered eruptions on the surface of WDs with prolonged stages of high luminosity and signatures of collimated mass ejection.
Appendix A Dynamical timescale of the disk
Here we compare the timescale of the observed light variability (Sect. 3.1) with the dynamical time of the disk with radius around the WD with the mass of ,
| (A1) |
A representative value of (see Fig. 7) and corresponds to hrs. If we consider for the outer part of the disk, then hrs–well comparable with the variation in the optical light as measured during the outbursts with jets. On the other hand, shorter variations from a low state, hr (Fig. 4), correspond to .
Appendix B Diffusion timescale of the disk
A contribution to the smooth light variation could also come from the inner warping part of the disk, whose flickering light is hidden, but can be reprocessed in the outer disk. The timescale for this process is given by the diffusion timescale,
| (B1) |
where is the radius of the reprocessing medium, is the light speed, and is the mean-free path of a photon. For the opacity and density of the medium, . If we can assume that and are constant along the path of the photon, then the corresponding optical depth , and the diffusion timescale can be expressed as , or
| (B2) |
If the thickness and its total optical depth is as large as 1–104, the diffusion timescale = 12 s–1.3 days is sufficiently short to observe the inner disk light variation at its outer rim (which is the warm pseudophotosphere), well within the timescale of the jet ejection period ( years).
References
- Beri et al. (2018) Beri, A., Paul, B., & Dewangan, G. C. 2018, MNRAS, 475, 999
- Bessel (1979) Bessel, M. S. 1979, PASP, 91, 589
- Boyarchuk (1967) Boyarchuk, A. A. 1967, Soviet Astronomy, 11, 8
- Burmeister & Leedjärv (2007) Burmeister, M., & Leedjärv, L. 2007, A&A, 461, L5
- Brandi et al. (2005) Brandi, E., Mikołajewska, J., Quiroga, C. et al. 2005, A&A, 440, 239
- Cariková & Skopal (2012) Cariková, Z., & Skopal, A. 2012, A&A, 548, A21
- Esipov et al. (2000) Esipov, V. F., Kolotilov, E. A., Mikołajewska, J., et al. 2000, Astronomy Letters, 26, 162
- Fekel et al. (2000) Fekel, C. F., Hinkle, K. H., Joyce, R., & Skrutskie, M. F. 2000, AJ, 120, 3255
- Fernández-Castro et al. (1995) Fernández-Castro, T., González-Riestra, R., Cassatella, A., Taylor, A. R., & Seaquist E. R. 1995, ApJ, 442, 366
- Fluks et al. (1994) Fluks, M. A., Plez, B., The, P. S., de Winter, D., Westerlund, B. E., & Steenman, H. C. 1994, A&AS, 105, 311
- Hachisu et al. (1996) Hachisu, I., Kato, M., & Nomoto, K. 1996, ApJ, 470, L97
- Henden & Kaitchuck (1982) Henden, A. A., & Kaitchuck, R. H. 1982, Astronomical Photometry, (New York: Van Nostrand Reinhold Company), 50
- Henden & Honeycutt (1997) Henden, A. A., & Honeycutt, R. K. 1997, PASP, 109, 441
- Horn et al. (1996) Horn, J., Kubát, J., Harmanec, P., et al. 1996, A&A, 309, 521
- Iping & Petterson (1990) Iping, R. C., & Petterson, J. A. 1990, A&A, 239, 221
- Kenyon (1986) Kenyon, S. J. 1986, The symbiotic stars, CUP, New York
- Leibowitz & Formiggini (2008) Leibowitz, E. M., & Formiggini, L. 2008, MNRAS, 385, 445
- Leibowitz & Formiggini (2013) Leibowitz, E. M., & Formiggini, L. 2013, ApJ, 146:117
- Livio (1997) Livio, M. 1997, in ASP Conf. Ser. 121, Accretion Phenomena and Related Outflows, ed. D. T. Wickramashinge , G. V. Bicknell, & L. Ferrario, (San Francisco: ASP), 845
- Livio & Pringle (1996) Livio, M., Pringle, J. E. 1996, ApJ, 465, L55
- Livio & Pringle (1997) Livio, M., Pringle, J. E. 1997, ApJ, 486, 835
- McKeever et al. (2011) McKeever, J., Lutz, J., Wallerstein, G., Munari, U., & Siviero, A. 2011, PASP, 123, 1062
- Mikołajewska & Kenyon (1996) Mikołajewska J., & Kenyon, S. J. 1996, AJ, 112, 1659
- Munari et al. (2001) Munari, U., Tomov, T., Yudin, B. F., et al. 2001, A&A, 369, L1
- Munari et al. (2005) Munari, U., Siviero, A., & Henden, A. 2005, MNRAS, 360, 1257
- Mürset et al. (1991) Mürset, U., Nussbaumer, H., Schmid, H. M., & Vogel, M. 1991, A&A, 248, 458
- Mürset & Schmid (1999) Mürset, U., & Schmid, H. M. 1999, A&AS, 137, 473
- Nussbaumer & Vogel (1987) Nussbaumer, H., & Vogel, M. 1987, A&A, 182, 51
- Nussbaumer & Vogel (1989) Nussbaumer, H., & Vogel, M. 1989, A&A, 213, 137
- Osterbrock (1989) Osterbrock, D. E. 1989, Astrophysics of Gaseous Nebulae and Active Galactic Nuclei, (San Francisco: W. H. Freema and Company Press)
- Paczyński & Żytkow (1978) Pacźynski, B., & Żytkow, A. N. 1978, ApJ, 222, 604
- Paczyński & Rudak (1980) Paczyński, B., & Rudak, R. 1980, A&A, 82, 349
- Parimucha & Vaňko (2005) Parimucha, Š., & Vaňko, M. 2005, CoSka, 35, 35
- Petterson (1977) Petterson, J. A. 1977, ApJ, 216, 827
- Pringle (1996) Pringle, J. E. 1996, MNRAS, 281, 357
- Pringle (1997) Pringle, J. E. 1997, MNRAS, 292, 136
- Seaquist et al. (1984) Seaquist, E. R., Taylor, A. R. & Button, S. 1984, ApJ, 284, 202
- Shagatova (2017) Shagatova, N. 2017, PASP, 129, 067001
- Shen & Bildsten (2007) Shen, K. J., & Bildsten, L. 2007, ApJ, 660, 1444
- Škoda (1996) Škoda, P. 1996, in ASP Conf. Ser. 101, Astronomical Data Analysis Software and Systems V, ed. G. H. Jacoby, & J. Barnes, (San Francisco: ASP), 187
- Skopal (2005) Skopal, A. 2005, A&A, 440, 995
- Skopal (2006) Skopal, A. 2006, A&A, 457, 1003
- Skopal (2007) Skopal, A. 2007, New Astron., 12, 597
- Skopal et al. (2000) Skopal, A., Chochol, D., Pribulla, T., Vaňko, M. 2000, IBVS No. 5005
- Skopal & Pribulla (2006) Skopal, A., & Pribulla, T. 2006, ATel 882
- Skopal et al. (2006) Skopal, A., Vittone, A. A., Errico, L., et al. 2006, A&A, 453, 279
- Skopal et al. (2009) Skopal, A., Pribulla, T., Budaj, J., et al. 2009, ApJ, 690, 1222
- Skopal et al. (2011) Skopal, A., Tarasova, T. N., Cariková, Z., et al. 2011, A&A, 536, A27
- Skopal et al. (2012) Skopal, A., Shugarov, S., Vaňko, M., et al. 2012, AN, 333, 242
- Skopal et al. (2013) Skopal, A., Tomov, N. A. & Tomova, M. T. 2013, A&A, 551, id. L10
- Skopal et al. (2017) Skopal, A., Shugarov, S. Yu., Sekeráš, M., et al. 2017, A&A, 604, A48
- Sokoloski & Kenyon (2003) Sokoloski, J. L., & Kenyon, S. J. 2003, ApJ, 584, 1021
- Sokoloski et al. (2006) Sokoloski, J. L., Kenyon, S. J., Espey, B. R., et al. 2006, ApJ, 636, 1002
- Southwell et al. (1997) Southwell, K. A., Livio, M., & Pringle, J. E. 1997, ApJ, 478, L29
- Tarasova & Skopal (2012) Tarasova, T. N., & Skopal, A. 2012, ARep, 56, 212
- Tomov et al. (1990) Tomov, T., Kolev, D., Zamanov, R., Georgiev, L., & Antov, A. 1990, Nature, 346, 637
- Tomov et al. (2000) Tomov, T., Munari, U., & Marrese, P. M. 2000, A&A, 354, L25
- Tomov et al. (2007) Tomov, N. A., Tomova, M. T., & Bisikalo, D. V. 2007, MNRAS, 376, L16
- Tomov et al. (2017) Tomov, T., Zamanov, R., Gałan, C., & Pietrukowicz, P. 2017, AcA, 67, 225
- van den Eijnden et al. (2018) van den Eijnden, J., Degenaar, N., Russell, T. D., et al. 2018, MNRAS, 473, L141
- Vaňko et al. (2015a) Vaňko, M., Komžík, R., Kollár, V., & Sekeráš, M. 2015a, CoSka, 44, 77
- Vaňko et al. (2015b) Vaňko, M., Komžík, R., Kollár, V., & Sekeráš, M. 2015b, CoSka, 44, 91
- Wijers & Pringle (1999) Wijers, R. A. M. J. & Pringle, J. E. 1999, MNRAS, 308, 207