The Effect of AGN on the Global H I Content of Isolated Low-Mass Galaxies
Abstract
We investigate the global neutral hydrogen (H I) content of isolated galaxies selected from the SDSS spectroscopic survey with optical evidence of Active Galactic Nuclei (AGN). Our sample includes galaxies with unresolved H I observations from the ALFALFA 70% data release combined with deeper H I observations of low-mass galaxies with . We examine the H I masses of this sample using the distance from the star-forming sequence on the [O III]/H and [N II]/H Baldwin Phillips Terlevich (BPT) diagram as a measurement of AGN activity. In agreement with previous studies, we find that, for galaxies with , AGN activity does not correlate with the global H I content. However, for galaxies with , we identify a set of objects at large distances from the BPT star-forming sequence and lower than expected H I masses. This gas-depleted sample is red in both g-r and NUV-r colors and compact without distinguishable signs of star formation. This is surprising because the vast majority of isolated galaxies in this stellar mass regime are both star-forming and gas-rich. These galaxies are greater than 1.5 Mpc from any massive galaxy, ruling out environmental processes as a source of the gas-depletion. We suggest that either black hole feedback or shocks from extremely bursty star formation cause the emission lines and have destroyed or otherwise consumed the cold gas.
Subject headings:
galaxies: active galaxies: evolution galaxies: nuclei radio lines: galaxies –galaxies: dwarf1. Introduction
Feedback from active galactic nuclei (AGN) is often invoked as a mechanism to regulate galaxy evolution (e.g., Silk & Rees, 1998; Fabian, 1999; Granato et al., 2001, 2004; Di Matteo et al., 2005; Dashyan et al., 2018). AGN feedback, either alone or together with feedback from star formation, can have profound effects on galaxy evolution by heating, ionizing and expelling gas from the interstellar medium (ISM). However, important aspects of AGN feedback physics are poorly constrained and simulations are often tuned to reproduce observations and galaxy scaling relations (e.g., Bower et al., 2006; Somerville et al., 2008; Gabor et al., 2011; DeBuhr et al., 2011; Schaye et al., 2014; Genel et al., 2014).
Studies of the H I content of active galaxies consistently produce results that AGN activity is not directly correlated with the global H I gas mass of galaxies (e.g., Ho et al., 2008; Fabello et al., 2011; Zhu & Wu, 2015). For example, Geréb et al. (2015) find no relation between AGN [O III] luminosity and the global H I content of massive galaxies, even when the AGN are split by red sequence and green valley. However, Lemonias et al. (2014) find that high-mass galaxies with the largest gas fractions and the lowest H I surface densities (and therefore the lowest star formation rate surface densities) are also likely to have signatures of AGN emission and large bulges. While AGN may affect cold gas locally, the above studies support the conclusion that AGN activity is not entirely responsible for the global H I gas regulation in massive galaxies.
Recent studies have uncovered a large sample of low-mass galaxies with showing signatures of accreting black holes (e.g., Reines et al., 2013; Sartori et al., 2015; Reines & Comastri, 2016). Low-mass galaxies offer an opportunity to examine AGN feedback processes in galaxies with shallower gravitational potential wells, where feedback processes may have a more profound effect on the global ISM than in high-mass galaxies. However, low-mass galaxies are strongly affected by environmental processes (e.g., Geha et al., 2012). To clearly examine the properties of galaxies with evidence of AGN, we study isolated galaxies where the effects of environment are minimized.
Bradford et al. (2015, Paper I) showed that isolated galaxies with cannot completely destroy their own cold gas reservoirs. Galaxies with have gas fractions greater than 20% and galaxies with have gas fractions greater than 30%. However, flux-limited surveys of H I emission are, by definition, biased towards gas-rich galaxies and may not contain low-mass galaxies that have been significantly depleted of their H I gas due to feedback processes (Koribalski et al., 2004; Giovanelli et al., 2005).
In this paper, we ask whether the presence of an AGN significantly affects the global H I content of low mass galaxies (). We compliment the H I observations from Paper I and data from the ALFALFA H I survey with new, deeper H I observations of low-mass galaxies with evidence of AGN activity. In § 2, we present the galaxy catalog, emission line diagnostic data, H I observations, and catalog statistics. We measure a new versus relation for all isolated ALFALFA galaxies and explore emission line diagnostics by measuring the perpendicular distance from the star forming region in [O III]/H and [N II]/H space. In § 3, we examine in detail the H I gas masses of isolated, low-mass galaxies with evidence of gas-depletion due to AGN activity and compare these galaxies to a gas-normal sample with similar positions on the [O III]/H and [N II]/H BPT diagram. We examine these populations and compare them to the rest of the isolated sample. In § 4, we discuss our results and posit what may cause the emission line ratios and gas-depletion in this gas-depleted sample. In this work, we adopt the following cosmological parameters: , , km s-1 (i.e., h = 0.7).
2. Data and Methods
2.1. Galaxy Catalog and Environment Definitions
We select galaxies from version 0.1.2 of the NASA Sloan Atlas (NSA) catalog 111http://www.nsatlas.org (Blanton et al., 2011). The NSA catalog is based on the Sloan Digital Sky Survey DR8 (SDSS) (Aihara et al., 2011). Stellar masses are generated from the Blanton & Roweis (2007) kcorrect software and are calculated using a Chabrier (2003) IMF. We assume a 0.2 dex uncertainty in . We restrict our galaxy sample to the NSA redshift between 0.002 and 0.055 and we apply several quality cuts as detailed in Paper I. These cuts ensure accurate photometry, spectroscopy and heliocentric distance measurements.
Isolated galaxies have various definitions (Haynes & Giovanelli, 1984; Karachentsev et al., 2011; Brough et al., 2013; Hirschmann et al., 2013). Geha et al. (2012) find that low-mass galaxies with located at least 1.5 Mpc from a massive galaxy are always star-forming and isolated quenched galaxies with are extremely rare. We adopt this empirically motivated isolation criterion for low-mass galaxies. Isolated low-mass galaxies are therefore defined as with projected distances to a massive host () greater than 1.5 Mpc. Isolated high-mass galaxies are defined as in Paper I with , a projected distance larger than 1.5 Mpc to the nearest galaxy more massive than 0.5 dex, and a fifth nearest neighbor surface density . After restricting the galaxies from the NSA catalog to isolated galaxies only, we obtain 36708 isolated galaxies, of which 28621 are high-mass and 8074 are low-mass.
2.2. H I Observations
2.2.1 Our H I Observations
We have obtained new observations of 30 galaxies using the Arecibo Observatory between March of 2015 and January of 2017. The 21-cm observations used the same configuration detailed in Paper I: L-band Wide receiver using 1024 resolution channels with a bandwidth of 12.5 MHz and a velocity resolution of 2.6 km s-1. Position switched ON/ OFF observing and ON/OFF noise-diode calibration was used. Our deeper integration times run from 5 to 60 minutes on-source, with an average integration time of 16 minutes. We integrate until a detection has been made or we reach an on-source exposure time of 30 minutes (although in a few cases the exposure time is less due to observing constraints).
For this work, we re-reduce all H I data from Paper I and our new data in order to co-add all spectra from the same receiver configuration and to maximize the number of usable observations. Most of the observations from Paper I focus on isolated galaxies with and a Sersic axis ratio less than 0.65 in order to obtain accurate kinematics from H I line-widths. Our new observations focus mostly on the Reines et al. (2013) “dwarf” galaxy sample with signs of AGN activity. We have updated the Paper I H I measurement algorithm to salvage more noise-only spectra and spectra with unstable baselines outside of the spectral window of interest. The most significant update to this algorithm is an adaptive Hanning smoothing length (between 2.5 and 10 km/s) to optimize the measured emission line parameters. Uncertainties in the properties of the H I emission line are calculated through the same bootstrap process as described in Paper I.
We calculate upper limits for 65 non-detections in this H I sample. Non-detections are identified using a smoothed S/N cutoff below 6 and verified by eye. For each non-detection, we estimate the the H I 20% line-width using the stellar Tully-Fisher relation from Bradford et al. (2016) and de-project this velocity based on the optical inclination. We then calculate the expected using the stellar mass-to-gas mass relation in Paper I and convert this gas mass to H I flux. The specific relationship between and we use does not affect our results, as the upper limits are always significantly less than the predicted from this relation. We create a synthetic Gaussian emission line with this H I line width and integrated flux. We measure the rms of the observation using the un-smoothed spectrum. We then iterate over this fiducial signal, add in a random noise realization, and Hanning smooth this synthetic spectrum to a resolution of 10 km s-1. For each noise realization, we decrease the integrated flux of the synthetic spectrum until we reach the smoothed S/N cutoff of 6. When the S/N drops below 6, we perform 1000 additional noise realizations using this final synthetic emission line. The median integrated flux of these random realizations where the S/N is less than 6 is the final upper limit.
| NSAID | BPT Classification | |||||||||||
|---|---|---|---|---|---|---|---|---|---|---|---|---|
| (h:m:s) | (∘:’:”) | (mJy km/s) | (mJy) | (km/s) | (Mpc) | (s) | (Mpc) | |||||
| (1) | (2) | (3) | (4) | (5) | (6) | (7) | (8) | (9) | (10) | (11) | (12) | (13) |
| 1933 | 13:38:15.39 | -00:23:54.79 | 0.0220 | 736.5 23.8 | 0.9 | 178 6 | 9.2 7.9 | 9.1 | 93 | 600 | 1.5 | Comp |
| 13496 | 10:54:47.89 | +02:56:52.51 | 0.0222 | 890.7 31.8 | 0.8 | 165 10 | 9.3 8.0 | 8.9 | 94 | 900 | 2.3 | SF (broad H) |
| 31601 | 07:37:43.65 | +24:09:34.45 | 0.0249 | 694.0 25.1 | 1.3 | 142 8 | 9.3 8.0 | 8.5 | 108 | 300 | 1.6 | SF |
| 39954 | 09:47:05.72 | +05:01:59.91 | 0.0242 | 49.4 | 0.8 | - | 8.1 | 9.2 | 103 | 1800 | 2.1 | Comp |
| 50121 | 08:15:49.08 | +25:47:01.49 | 0.0248 | 37.7 | 0.7 | - | 8.0 | 9.2 | 107 | 2700 | 1.9 | Comp |
| 56919 | 15:30:56.86 | +31:36:49.49 | 0.0365 | 371.4 25.2 | 0.6 | 213 29 | 9.4 8.2 | 9.4 | 161 | 1200 | 3.2 | Comp |
| 57536 | 15:47:03.21 | +34:13:19.48 | 0.0395 | 59.9 | 0.8 | - | 8.6 | 9.5 | 175 | 2100 | 7.1 | Comp |
| 58455 | 16:32:10.87 | +29:01:30.60 | 0.0370 | 11.2 | 1.0 | - | 7.9 | 9.4 | 164 | 1080 | 2.9 | Comp |
| 64878 | 09:27:47.64 | +33:12:33.17 | 0.0375 | 394.8 15.2 | 0.9 | 74 3 | 9.4 8.1 | 9.4 | 165 | 300 | 3.1 | Comp |
| 65192 | 09:50:20.09 | +36:04:46.56 | 0.0218 | 340.4 12.4 | 1.1 | 68 2 | 8.9 7.6 | 9.3 | 94 | 600 | 1.7 | Comp |
| 68105 | 15:30:27.30 | +28:31:20.71 | 0.0341 | 19.6 | 1.8 | - | 8.0 | 9.5 | 150 | 600 | 1.7 | SF |
| 71340 | 14:29:02.53 | +10:23:59.23 | 0.0298 | 181.7 | 2.5 | - | 8.9 | 9.4 | 129 | 300 | 1.6 | SF |
| 74744 | 10:55:55.13 | +13:56:16.97 | 0.0238 | 346.0 16.1 | 0.9 | 65 5 | 8.9 7.7 | 9.2 | 101 | 600 | 1.8 | Comp |
| 77431 | 13:04:34.92 | +07:55:05.10 | 0.0480 | 132.4 | 1.9 | - | 9.1 | 9.0 | 211 | 300 | 0.1 | AGN |
| 79150 | 14:55:18.51 | +08:16:06.42 | 0.0361 | 34.8 | 0.7 | - | 8.3 | 9.4 | 158 | 2400 | 1.5 | Comp |
| 84550 | 08:57:45.12 | +25:23:47.21 | 0.0133 | 826.2 25.7 | 1.7 | 78 4 | 8.9 7.8 | 9.2 | 62 | 300 | 3.6 | SF |
| 90179 | 10:47:58.08 | +33:55:37.13 | 0.0228 | 2114.2 23.2 | 1.4 | 150 2 | 9.7 8.3 | 9.4 | 99 | 300 | 2.4 | Comp |
| 91579 | 12:03:25.68 | +33:08:46.16 | 0.0349 | 138.6 11.7 | 0.3 | 129 17 | 8.9 7.8 | 9.0 | 153 | 2400 | 1.6 | SF (broad H) |
| 93582 | 13:28:14.70 | +29:57:09.66 | 0.0095 | 238.9 15.2 | 0.8 | 73 5 | 8.0 7.0 | 7.7 | 40 | 600 | 2.2 | SF |
| 93958 | 11:31:29.21 | +35:09:59.01 | 0.0337 | 32.9 | 0.8 | - | 8.2 | 9.3 | 147 | 2400 | 1.5 | Comp |
| 101949 | 11:43:02.42 | +26:08:18.99 | 0.0230 | 51.1 | 0.7 | - | 8.1 | 9.3 | 99 | 2400 | 1.0 | AGN |
| 104334 | 13:12:19.26 | +27:07:37.26 | 0.0149 | 609.1 43.4 | 1.3 | 141 29 | 8.8 7.8 | 8.5 | 68 | 300 | 2.4 | SF |
| 104527 | 13:32:45.62 | +26:34:49.35 | 0.0470 | 63.5 | 0.9 | - | 8.8 | 9.4 | 208 | 1200 | 1.1 | AGN |
| 105376 | 08:40:25.54 | +18:18:59.04 | 0.0150 | 99.1 | 1.6 | - | 8.1 | 9.3 | 69 | 600 | 1.2 | AGN |
| 106991 | 10:04:23.34 | +23:13:23.37 | 0.0266 | 453.1 15.5 | 0.5 | 176 10 | 9.2 7.9 | 9.2 | 115 | 1500 | 3.2 | Comp |
| 107272 | 10:09:35.67 | +26:56:49.02 | 0.0144 | 154.0 24.0 | 0.5 | 99 36 | 8.2 7.4 | 8.5 | 66 | 1200 | 1.2 | AGN |
| 109397 | 07:58:12.44 | +11:01:14.18 | 0.0078 | 7217.1 65.4 | 1.9 | 109 2 | 9.4 8.6 | 9.1 | 38 | 300 | 6.4 | SF |
| 111644 | 11:05:03.97 | +22:41:23.43 | 0.0246 | 127.2 | 2.2 | - | 8.5 | 9.1 | 106 | 300 | 0.6 | AGN |
| 118505 | 12:18:13.44 | +20:04:36.82 | 0.0457 | 31.7 | 0.8 | - | 8.5 | 9.3 | 201 | 1800 | 1.9 | Comp |
| 123656 | 14:20:44.94 | +22:42:36.95 | 0.0307 | 51.1 | 0.8 | - | 8.3 | 9.3 | 134 | 1800 | 1.6 | AGN |
Note. — Column definitions are: (1) NSAID, (2) right ascension, (3) declination, (4) redshift, (5) integrated 21-cm flux density, (6) rms per spectral element of the 21-cm flux after smoothing, (7) 20% HI line width, (8) HI mass, (9) stellar mass, (10) heliocentric distance, (11) total on-source integration time of 21-cm observation, (12) 2D projected distance from this galaxy to a more massive galaxy with (see § 2.1), (13) BPT category determined in Reines & Volonteri (2015) and Reines et al. (2013),
We detail our new H I observations, detections and non-detections, in Table 1. All of these galaxies have emission line measurements from Reines & Volonteri (2015), which are described in § 2.4. Note that some of these galaxies are isolated and some are not. For the duration of this work we will focus on isolated galaxies only, but we list these non-isolated galaxies for clarity.
2.2.2 ALFALFA H I Data
We compliment the H I data described above with the publicly available ALFALFA 70% catalog, a blind, drift-scan survey (Haynes et al., 2011). We match sources in the ALFALFA catalog using their optical centers with “detcodes” of 1 and 2 to NSA catalog sources within 6” and where the difference between systemic velocities is less than 75 km s-1. We discard any matches to the ALFALFA detcode 2 sources where the S/N is less than 6. For overlapping observations between our data and the ALFALFA catalog, we adopt the error-weighted average of the H I measurements.
For galaxies without a detection that fall within the ALFALFA footprint, we calculate conservative upper limits by using the S/N calculation from Haynes et al. (2011) to back out the predicted flux for a S/N of 6:
| (1) |
with the H I integrated flux density, the 50% H I line-width, [km/s], is the resolution of the smoothed spectrum and the measured rms of the H I spectrum. For this case, 2.3 , which is the mean rms of the ALFALFA survey. We then calculate the H I line widths using the stellar Tully-Fisher relation from Bradford et al. (2016) and upper limits as described in § 2.2.1.
While we are not guaranteed that this approach accurately represents the upper limits of these galaxies, we find that these upper limits match the ALFALFA Spaenhauer diagram ( versus heliocentric distance) and the H I profile width versus integrated flux density relations from ALFALFA (Figures 3 and 12 in Haynes et al. (2011). These results have motivated us to proceed with these upper limits serving purely as a reference for our primary analysis.
2.3. The Isolated to Relation
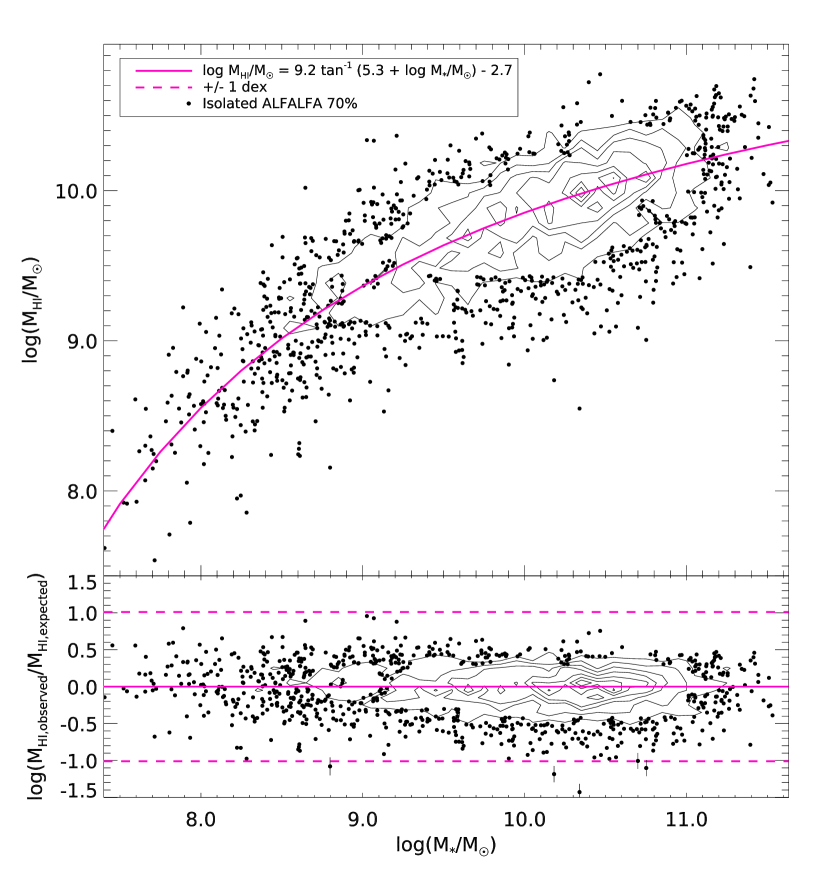
The observed cold gas content of galaxies is closely related to their stellar mass, galaxy color, and stellar surface density (e.g., Catinella et al., 2010; Huang et al., 2012, Paper I). The baryon content of isolated low-mass galaxies is often dominated by cold gas, likely because galaxy formation is inefficient at low masses (Roychowdhury et al., 2014). A break in the relation between and occurs near log , where the gas fraction increases to more than 90% at the lowest stellar masses. In Paper I, we fit a broken power law to the to relation with a break at log . In this work however, we find that an arctangent function provides a better fit simultaneously to the high and low-mass ends of the to relation while maintaining the break between high and low regimes. This function is not physically motivated but offers a better fit to the locus of the distribution in at fixed than a simple broken power-law.
We fit the relation only to the isolated galaxies selected from the NSA catalog that have ALFALFA H I data. The relation is measured with ALFALFA data only because of homogeneity and the survey’s well-studied completeness and detection limits (Haynes et al., 2011, § 6). We use only isolated galaxies to minimize the effects of environmental gas-depletion processes on this relationship.
To perform the fit, we bin the data in stellar mass and then fit to the weighted medians of the distribution of in each stellar mass bin. Because the distribution of as a function of stellar mass is log-normal with the tail of the distribution trending to smaller , this fitting method removes any spurious trends in the residuals in this relation, which is critical for our analysis below. We measure the following relation:
| (2) |
We calculate the residuals from the to relation for both the ALFLFA sample and our H I data as,
| (3) |
We add 0.1 dex in quadrature to all H I residual uncertainties and upper limits due to the uncertainty in the fit.
We present the relation between and in the top panel of Figure 1 for isolated galaxies with ALFALFA data and the residuals () between the observed and the predicted in the bottom panel. Equation 2 is plotted as the solid curve. The dashed lines in the bottom panel are dex from the relation, which roughly corresponds to the 3 scatter. We use the dex residual as a reference point throughout the paper as an arbitrary line of demarcation.
2.4. Emission Line Measurements
Optical emission line flux ratio diagnostics are often used to differentiate between various physical phenomena that ionize the interstellar medium of galaxies (Baldwin et al., 1981; Veilleux & Osterbrock, 1987). Differentiating between excitation sources (actively accreting black holes, star formation, shocks from AGB stars, etc.) depends on the ionization mechanism strength. Reines & Volonteri (2015) measure emission line strengths of 6̃7,000 galaxies selected from the NSA catalog. The authors cull the spectral catalog with a S/N cutoff of 3 and an equivalent width cutoff of 1 for the H, [N II], [O III] emission lines and a S/N cutoff of 2 for the H line. They iteratively subtract continuum and absorption lines using the models of Tremonti et al. (2004) from the observed spectrum, carefully masking out the emission lines. Next, a one- or two-component Gaussian is fit to the [S II] doublet and used as a template for the remaining emission lines of interest, excluding [O III]. We use the dataset from this study without any modifications.
2.5. BPT emission line Diagnostics
We examine the emission line diagnostics of all galaxies from Reines & Volonteri (2015), regardless of environment or H I data using the [O III]/H and [N II]/H narrow-line BPT diagram (Baldwin et al., 1981; Veilleux & Osterbrock, 1987; Kewley et al., 2006). We adopt the division into the star-forming, composite, and AGN categorization that has been performed by Reines & Volonteri (2015) using the Kewley et al. (2001) and Kauffmann et al. (2003) categorization. The Kewley et al. (2001) demarcation line represents the division between a theoretical maximal starburst model and emission that can only be explained by AGN activity. The Kauffmann et al. (2003) demarcation line is an empirical separation between the star forming sequence and the AGN sequence. Galaxies below the Kauffmann et al. (2003) line are considered to be purely star forming and galaxies above the Kewley et al. (2001) line are considered Seyferts and LINERs. The region between these two demarcation lines are defined as composite spectra with both star formation and AGN emission.
Galaxies are commonly categorized using these divisions in BPT space. This classification scheme has been calibrated with galaxies more massive than the Reines et al. (2013) sample. For low mass galaxies where AGN emission is weaker and may be more difficult to disentangle from star formation emission, it is unclear where the standard definitions are effective. Lower mass galaxies are also, on average, more metal-poor which will affect the measured line ratios. To further compound this problem, the ratio of emission from star formation to AGN activity is a strong function of the spatial resolution of the observations - where single fiber observations can create aperture bias (e.g., Sharp & Bland-Hawthorn, 2010; Pracy et al., 2014; Gomes et al., 2016). The mean fraction of the surface area covered by the SDSS fiber compared to the 50% Petrosian radii is 22% and 32% for isolated high and low-mass galaxies, respectively. We expect smaller, less massive galaxies with AGN emission to shift towards the composite or possibly the star-forming region of the BPT diagram. Thus emission-line categories may significantly limit our analysis.
It is therefore enlightening to examine galaxy properties relative to position on a BPT diagram as opposed to categorizations (e.g., Kewley et al., 2001; Kauffmann et al., 2003; Kewley et al., 2013; Zhu & Wu, 2015). For example, Kauffmann et al. (2003) examine the [O III]/H and [N II]/H narrow-line BPT space by defining a distance and an angle from a point where the star-forming sequence meets the plume of galaxies with AGN emission. They find that [O III] luminosity, a measure of AGN strength, does not increase with distance from this point, while [O III] luminosity decreases sharply at a characteristic angle.
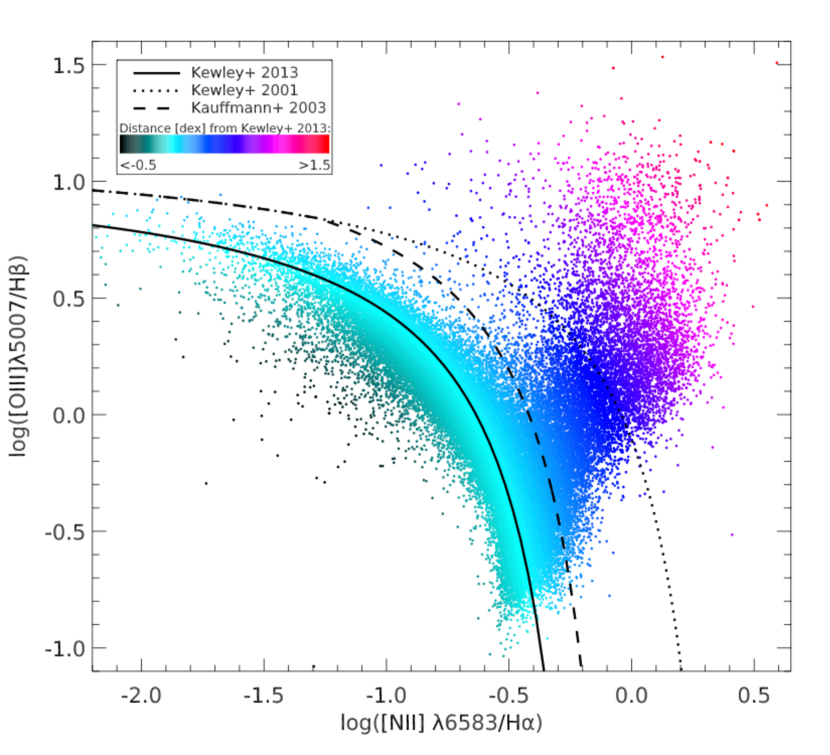
We measure the perpendicular distance from the star-forming sequence of the [O III]/H and [N II]/H BPT diagram as defined by Kewley et al. (2013) for each galaxy. The position of the Kewley et al. (2013) fit is determined by local SDSS star-forming galaxies while the shape of the curve is based on data from their photoionization models (see their Figure 1),
| (4) |
For each galaxy, we define as the minimum perpendicular distance of each galaxy to equation 4. In Figure 2, we present the [O III]]/H versus [N II]/H emission line diagnostic BPT diagram. The data are color-coded by their distance from the star-forming sequence as defined above in equation 4. This figure includes every galaxy with BPT data, regardless of whether or not there exists H I data.
2.6. Final Sample Description
For the remainder of this work, we focus on a galaxy sample defined by the following criteria:
-
1.
Galaxies selected from the NSA catalog passing the quality cuts from Paper I. The NSA includes galaxies in the redshift range .
-
2.
Galaxies are isolated given the criteria for low-mass and high-mass galaxies given in § 2.1.
-
3.
Galaxies have H I observations from Paper I, our H I dataset or from the ALFALFA 70% catalog.
-
4.
Galaxies have well-measured emission line ratios from Reines & Volonteri (2015).
The sample defined by combining the above criteria is not complete, but does fully sample the BPT diagram. This final data set consists of 2855 isolated galaxies with H I and BPT data, 867 of which we refer to as ’low-mass’ ).
3. Results
3.1. H I Residuals as a Function of BPT Distance
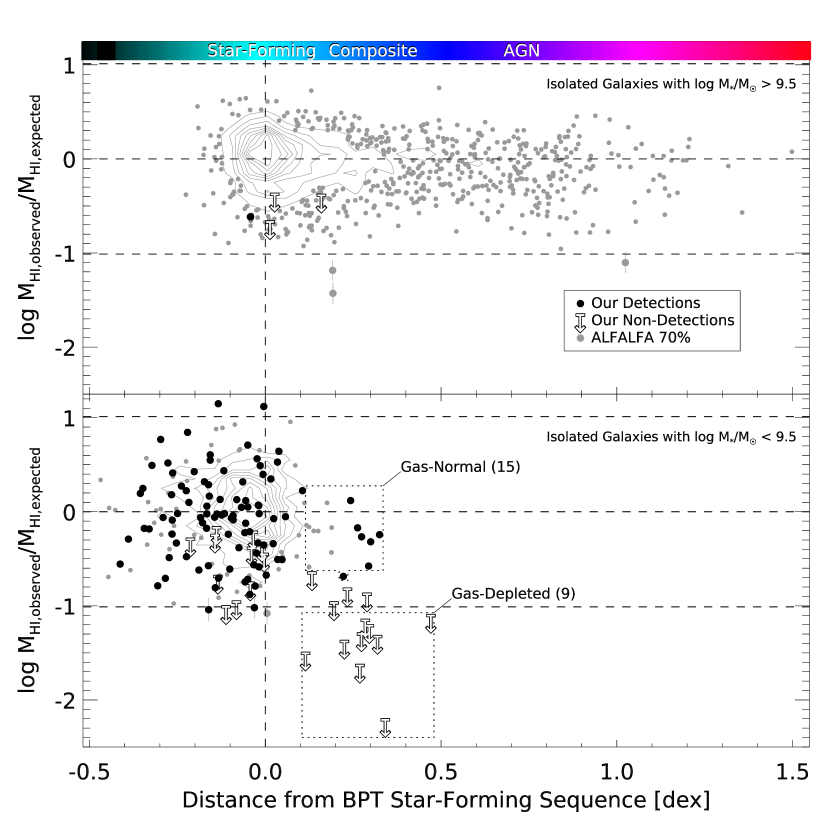
In Figure 3, we present isolated galaxies with both BPT and H I data. We divide this sample at , as shown in the top and bottom panels. In this figure, we examine the residual () as a function of distance from the BPT star-forming sequence (). ALFALFA detections are shown as grey points and contours. The H I data from Paper I and our deeper observations are shown as black dots for detections and downward pointing arrows for upper limits. The color bar corresponds to values as in Figure 2. The star-forming, composite, and AGN regions, as defined by Kewley et al. (2001) and Kauffmann et al. (2003), are labeled in the color bar at the median positions of the distributions of the entire sample for each of the three categories. These labels are only meant to act as a guide. The scatter in the H I residual, dex, is shown as horizontal dashed lines. Galaxies with dex are plotted with error bars. Given the conservative ALFALFA upper limit estimates from § 2.2.2, we would not expect ALFALFA to detect a significant number of galaxies below the dex line.
The high-mass galaxy sample in the top panel of Figure 3 shows no trend in as a function of . While this is certainly an incomplete H I sample due to the flux-limited nature of the ALFALFA survey, we can safely assume the incompleteness is the same for all galaxies across the entire BPT diagram because is not dependent on heliocentric distance. This lack of a trend supports previous studies (see § 1) suggesting that the global H I content of high-mass galaxies is not significantly affected by AGN activity.
The low-mass galaxy sample is shown in the bottom panel of Figure 3. This sample suffers from the same H I incompleteness as the high-mass sample but, as in the high-mass case, we do not expect this incompleteness to be a function of . The peak in the distribution of BPT distances is offset by dex from the locus of the star-forming sequence. This offset is likely due to the fact that low-mass galaxies are metal-poor compared to massive galaxies (see Kewley et al. (2013) equation 4). Since the star-forming population of low mass galaxies is offset relative to the typical AGN demarcation lines, this further motivates our decision to examine galaxies are a function of BPT distance ().
In the low-mass regime, we have followed-up many galaxies with deeper H I data from Paper I. In the star-forming region, we have randomly sampled this population and do not observe any star-forming galaxies with dex despite these deeper observations. Indeed, given the results from Paper I, we expect cold gas fractions greater than 20% for all isolated galaxies with . However our deeper H I observations, do uncover a population of galaxies at intermediate BPT distances where 0.11 dex and H I upper limits dex. These galaxies are “gas-depleted” relative to galaxies in the same stellar mass range by an order of magnitude and they are inconsistent with the H I distribution of the star-forming population. This gas-depleted galaxy sample with dex may be indicative of an ionizing process other than star-formation that is depleting the ISM of H I.
In the same intermediate region of BPT distances where 0.11 dex, we also find low-mass galaxies that are “gas-normal”. These gas-normal galaxies have H I gas masses that are consistent both with the star-forming population and with galaxies in the same stellar mass range. This implies that whatever is causing these strong emission line ratios does not always significantly deplete the global H I mass.
3.2. Isolated Low-Mass Galaxies at Intermediate BPT Distances
| NSAID | Type | D | g-r | NUV-r | Sersić N | H EW | ||||||||
|---|---|---|---|---|---|---|---|---|---|---|---|---|---|---|
| (h:m:s) | (∘:’:”) | dex | dex | Mpc | kpc | Å | ||||||||
| (1) | (2) | (3) | (4) | (5) | (6) | (7) | (8) | (9) | (10) | (11) | (12) | (13) | (14) | (15) |
| Gas-Depleted | ||||||||||||||
| 35979 | 08:20:13.93 | +30:25:03.09 | 0.0196 | Comp | 0.34 0.09 | -2.2 | 9.5 | 85 | 0.630.03 | 4.380.08 | 1.600.03 | 1.7 | 1.540.03 | 2.00.3 |
| 39954 | 09:47:05.72 | +05:01:59.91 | 0.0242 | Comp | 0.27 0.04 | -1.3 | 9.2 | 103 | 0.500.03 | 3.270.06 | 0.720.01 | 2.1 | 1.330.03 | 13.50.5 |
| 50121 | 08:15:49.08 | +25:47:01.49 | 0.0248 | Comp | 0.23 0.09 | -1.4 | 9.2 | 107 | 0.660.03 | 3.860.09 | 0.780.02 | 2.1 | 1.460.05 | 33.20.9 |
| 58455 | 16:32:10.87 | +29:01:30.60 | 0.0370 | Comp | 0.27 0.03 | -1.6 | 9.4 | 164 | 0.440.03 | 2.400.05 | 1.440.02 | 3.5 | 1.220.02 | 19.40.7 |
| 68105 | 15:30:27.30 | +28:31:20.71 | 0.0341 | SF | 0.11 0.07 | -1.5 | 9.5 | 150 | 0.700.03 | - | 2.530.04 | 1.8 | 1.550.07 | 5.40.5 |
| 78759 | 14:12:43.72 | +08:22:16.06 | 0.0286 | Comp | 0.32 0.10 | -1.3 | 9.4 | 123 | 0.590.03 | 3.820.20 | 1.430.02 | 3.5 | 1.400.02 | 1.90.3 |
| 79150 | 14:55:18.51 | +08:16:06.42 | 0.0361 | Comp | 0.28 0.04 | -1.2 | 9.4 | 158 | 0.580.03 | 3.670.31 | 0.940.01 | 1.4 | 1.340.03 | 8.30.4 |
| 93958 | 11:31:29.21 | +35:09:59.01 | 0.0337 | Comp | 0.30 0.03 | -1.2 | 9.3 | 147 | 0.970.03 | 3.810.19 | 0.280.00 | 5.8 | 1.380.04 | 22.80.7 |
| 123656 | 14:20:44.94 | +22:42:36.95 | 0.0307 | AGN | 0.47 0.07 | -1.1 | 9.3 | 134 | 0.620.03 | 4.010.26 | 0.640.01 | 5.9 | 1.490.02 | 4.00.3 |
| Gas-Normal | ||||||||||||||
| 1933 | 13:38:15.39 | -00:23:54.79 | 0.0220 | Comp | 0.27 0.02 | -0.3 0.1 | 9.1 | 93 | 0.270.03 | - | 2.020.05 | 1.0 | 1.120.01 | 92.31.2 |
| 5512 | 23:35:56.57 | +00:42:13.94 | 0.0224 | SF | 0.15 0.10 | -0.2 0.1 | 9.3 | 100 | 0.400.03 | 2.170.05 | 5.660.12 | 1.3 | 1.230.10 | 11.91.3 |
| 47492 | 08:00:24.59 | +25:21:19.87 | 0.0118 | SF | 0.14 0.02 | -0.2 0.1 | 8.4 | 54 | 0.140.03 | - | 0.870.03 | 2.0 | 1.060.01 | 89.51.6 |
| 48538 | 11:33:25.42 | +09:58:59.36 | 0.0210 | SF | 0.19 0.13 | -0.2 0.1 | 9.3 | 90 | 0.560.03 | 2.950.23 | 4.250.08 | 0.8 | 1.300.07 | 6.70.8 |
| 56919 | 15:30:56.86 | +31:36:49.49 | 0.0365 | Comp | 0.33 0.04 | -0.2 0.1 | 9.4 | 161 | 0.320.03 | - | 0.250.00 | 6.0 | 1.180.01 | 50.10.8 |
| 64878 | 09:27:47.64 | +33:12:33.17 | 0.0375 | Comp | 0.26 0.12 | -0.2 0.1 | 9.4 | 165 | 0.460.03 | 2.200.09 | 5.180.07 | 1.6 | 1.340.07 | 7.31.0 |
| 65192 | 09:50:20.09 | +36:04:46.56 | 0.0218 | Comp | 0.22 0.12 | -0.7 0.1 | 9.3 | 94 | 0.450.05 | 2.710.14 | 2.960.07 | 1.2 | 1.330.05 | 5.90.9 |
| 74744 | 10:55:55.13 | +13:56:16.97 | 0.0238 | Comp | 0.29 0.03 | -0.6 0.1 | 9.2 | 101 | 0.510.03 | 3.560.17 | 0.470.01 | 2.2 | 1.320.01 | 5.60.3 |
| 90179 | 10:47:58.08 | +33:55:37.13 | 0.0228 | Comp | 0.24 0.09 | 0.1 0.1 | 9.4 | 99 | 0.360.03 | 2.030.05 | 7.820.17 | 1.9 | 1.250.06 | 15.51.4 |
| 106991 | 10:04:23.34 | +23:13:23.37 | 0.0266 | Comp | 0.30 0.08 | -0.3 0.1 | 9.2 | 115 | 0.530.03 | 2.980.20 | 0.360.01 | 6.0 | 1.540.03 | 4.50.3 |
| 109873 | 08:43:35.13 | +13:03:46.57 | 0.0138 | SF | 0.19 0.01 | -0.4 0.1 | 8.8 | 60 | 0.270.03 | 1.880.07 | 1.120.04 | 1.9 | 1.080.01 | 35.80.6 |
| 114208 | 15:41:24.89 | +11:59:05.48 | 0.0145 | SF | 0.12 0.02 | -0.6 0.1 | 9.5 | 60 | 0.790.03 | 3.760.14 | 1.890.07 | 0.7 | 1.340.02 | 17.20.3 |
| 119809 | 12:24:16.18 | +24:16:01.74 | 0.0289 | SF | 0.18 0.10 | 0.1 0.1 | 9.2 | 125 | 0.440.03 | 2.040.13 | 5.270.09 | 3.5 | 0.880.05 | 9.71.2 |
| 119983 | 12:58:45.57 | +24:14:02.10 | 0.0227 | SF | 0.12 0.09 | -0.2 0.1 | 9.4 | 97 | 0.450.03 | 2.280.06 | 5.530.12 | 1.1 | 1.350.06 | 9.80.9 |
| 124169 | 15:20:14.16 | +17:43:52.95 | 0.0214 | SF | 0.12 0.01 | -0.1 0.1 | 9.3 | 93 | 0.230.03 | 1.950.10 | 2.900.07 | 3.4 | 1.120.01 | 105.91.7 |
Note. — Galaxies above the horizontal break are gas-depleted galaxies and galaxies below are gas-normal. Column definitions are: (1) NSAID, (2) R.A., (3) decl., (4) redshift, (5) BPT categorization from Reines et al. (2013), (6) BPT distance defined in § 2.5, (7) HI residual as defined in § 2.3, (8) stellar mass, (9) heliocentric distance, (10) color, (11) NUV-r color, (12) optical effective radius, (13) Sersić index, (14) 4000 Åbreak, and (15) the H equivalent width measured from SDSS spectra.
We find a set of gas-depleted, isolated, low-mass () galaxies with signs of AGN activity. We next compare the gas-depleted galaxies at large to the gas-normal galaxies in the same regime in order to explore the nature of the ionizing power source. We also compare the properties of both the gas-depleted sample and the gas-normal sample to a stellar-mass matched sample of isolated galaxies.
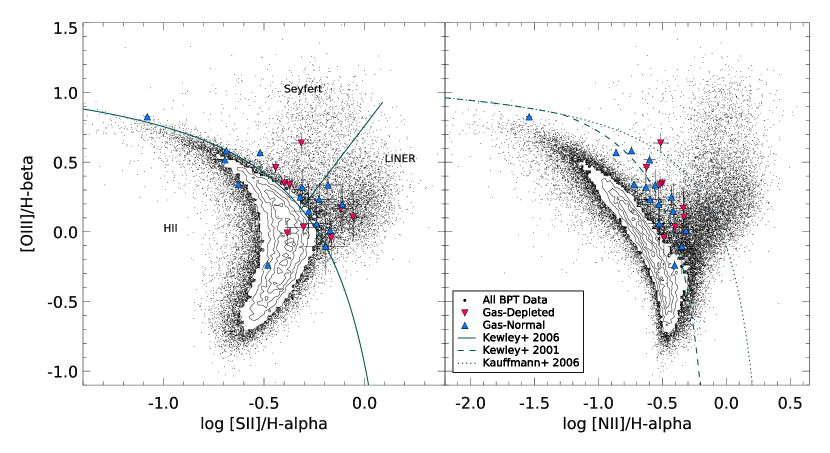
In other to further understand the source of ionization in our large galaxies, we examine additional line diagnostics. Active galaxies are often split into Seyfert and LINERs using the the [O III]/H and [S II]/H narrow-line BPT diagram (Heckman, 1980). While Seyfert emission is associated with accretion onto a black hole, LINER emission is more ambiguous, having been detected outside the nucleus of many galaxies. Kewley et al. (2006) identify a separation [S II]/H vs [O III]/H BPT space between Seyfert and LINER emission.
In Figure 4, we present the [O III]/H and [S II]/H narrow-line diagram in the left panel and revisit the [O III]/H and [N II]/H BPT diagram in the right panel. All galaxies with emission line data are plotted as black points and contours. The gas-depleted, isolated, low-mass sample is shown as red, downward-pointing triangles and the gas-normal, isolated, low-mass sample is shown as blue triangles (see § 3.1). In the left panel, the Kewley et al. (2006) demarcation curve separates Seyferts and LINERs from the HII region and the straight line splits the active galaxies into Seyferts and LINER branches, as labeled.
In the left panel of Figure 4, the majority of the gas-depleted and the gas-normal samples lie above and along the extreme starburst curve of Kewley et al. (2001, 2006). Both samples are therefore largely inconsistent with the star-forming galaxies. The gas-depleted sample above the curve is split between the Seyfert and LINER regions, while the gas-normal sample is mostly LINER-like. Figure 4 provides further evidence that the emission line measurements of the majority of the gas-depleted sample and a fraction of the galaxies in the gas-normal sample are partially due to ionization processes other than star formation (see further discussion in § 4).
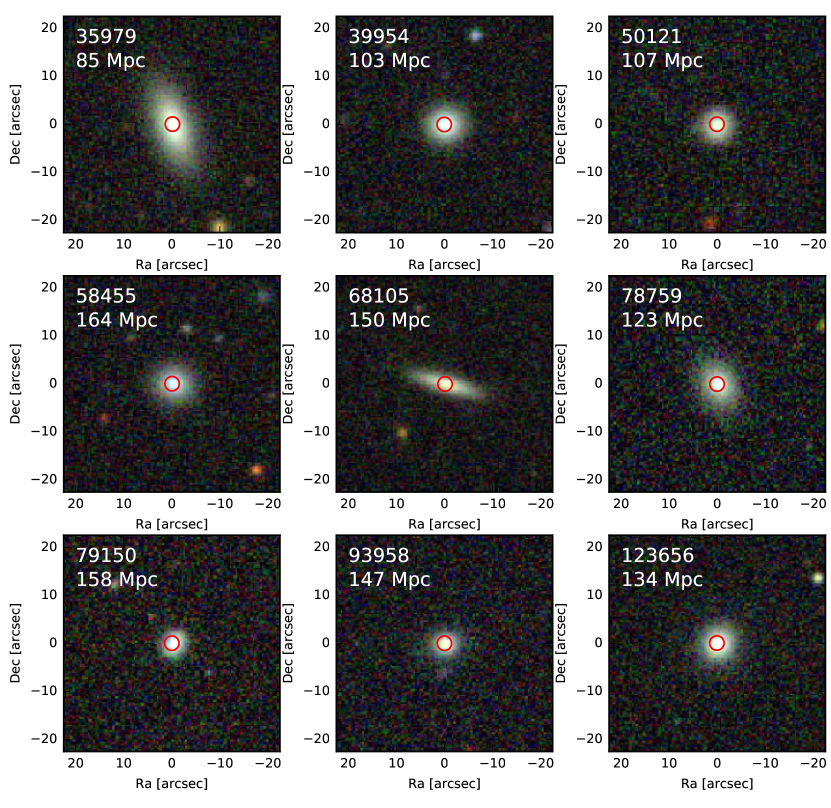
In order to further disentangle the source of the emission line ratios and the relationship of these processes to the global H I content of these galaxies, we examine the galaxy properties of the two samples. In Figure 5, we present SDSS images of the gas-depleted sample. The identifications used in each figure are the NSAIDs from version 0.1.2 of the NSA catalog. The SDSS fiber positions and sizes are plotted as red circles on each galaxy image. The heliocentric distances are noted in each image. All of the gas-depleted galaxies have similar visual properties (red, compact and nucleated) aside from 35979 and 68105 which are red yet more prolate in their respective orientations than the rest of the gas-depleted sample. The SDSS fiber covers a significant fraction of these galaxies’ projected areas and these galaxies’ spectra may contain a significant amount of contamination from emission outside of the galaxy centers (see § 3.1).
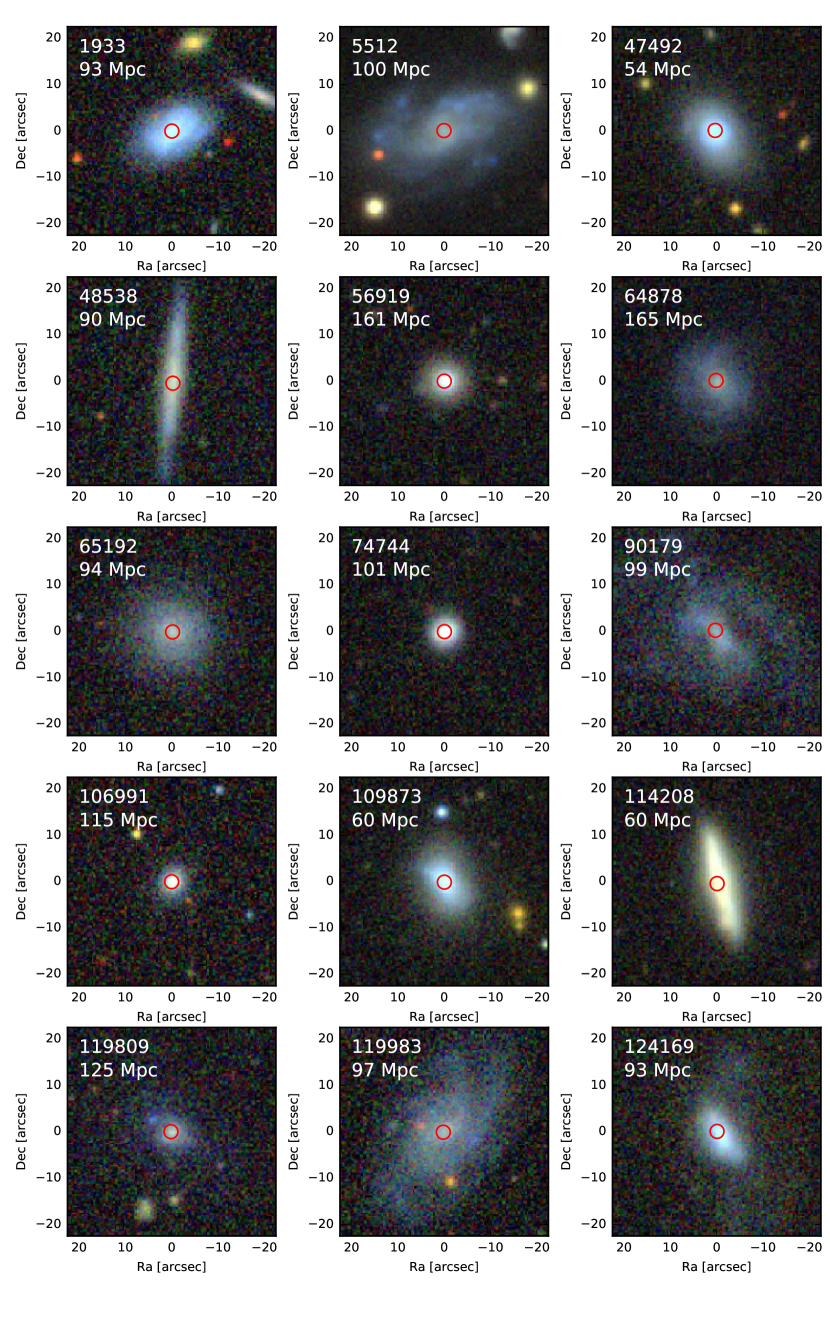
In Figure 6, we present images of the gas-normal sample. This sample is diverse in galaxy properties relative to the gas-depleted sample. Objects 56919, 74744, 106991 and 114208 are similar in appearance to the gas-depleted population and the SDSS fiber again covers a significant fraction of these galaxies. The remaining galaxies tend to be blue and more diffuse with some signs of spiral structure and larger sizes than the SDSS fiber. For many of these galaxies there are visual signs of both diffuse and concentrated star formation regions.
In Figure 7, we examine the distributions of g-r colors, NUV-r colors, effective radius, Sersić index, D, and H equivalent width of both the gas-normal and the gas-depleted low-mass samples relative to all isolated galaxies in the NSA catalog within the same stellar mass range (with ). The gas-normal sample is shown as upward pointing triangles, color-coded by . The gas-depleted sample is shown as downward pointing triangles, also color-coded by . Isolated galaxies from the NSA catalog, excluding the two samples of interest, are shown as grey histograms in each panel regardless of whether BPT or H I data exists. The median of each distribution is shown as a vertical dashed line. We present these and other relevant properties of the gas-depleted and gas-normal galaxy samples in Table 2.
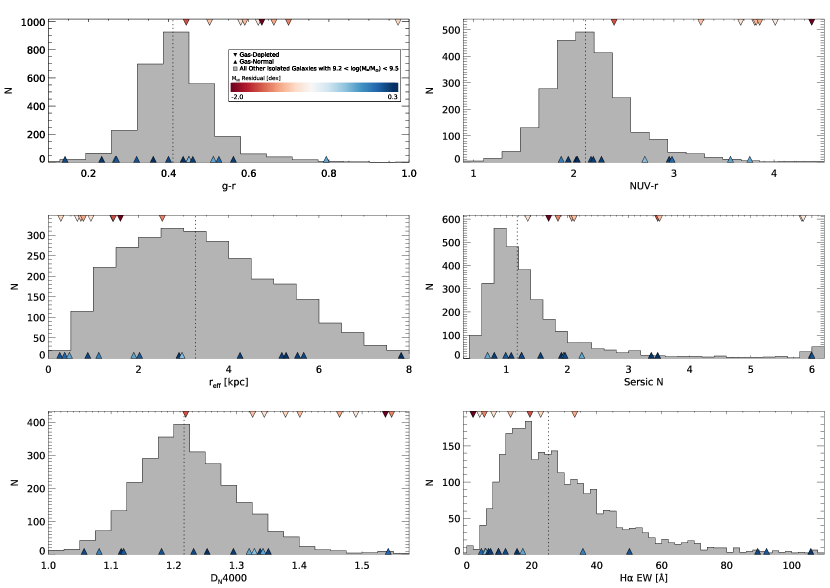
Confirming our visual analysis, the distribution of the gas-depleted sample properties is inconsistent with being drawn from the overall star-forming population. For each property shown in Figure 7, we test the null hypothesis that the gas-depleted/gas-normal sample and the full isolated sample of galaxies in the same stellar mass range are drawn from the same underlying population. We use a variation of the Student’s t-test without the assumption that the variances of the two populations are equal. The gas-depleted galaxies are not drawn from the same distribution as the overall population with greater 95% confidence for all 6 properties shown in Figure 7. For the gas-normal population, the distributions are consistent (that is, we cannot reject the null hypothesis that they are drawn from different underlying populations).
We also examine [O III] luminosity in the same fashion as above (not shown). Both the gas-normal and gas-depleted samples are consistent with the general distribution of [O III] luminosity. However, the general distribution become restricted to galaxies that have emission line measurements from Reines & Volonteri (2015). Kauffmann et al. (2003) also do not find that [O III] luminosity changes as a function of a galaxy’s distance from locus of the star-forming BPT region.
4. Discussion
We find a set of galaxies with that are both isolated and gas-poor. These galaxies are located primarily in the composite region of the [O III]/H versus [N II]/H BPT diagram and the LINER/Seyfert regions of the [O III]/H and [S II]/H BPT diagram. These gas-depleted galaxies are also compact and red with older stellar populations and no obvious signs of star formation.
This result is surprising because isolated galaxies in this mass range are generally gas-rich, diffuse, blue and show ongoing star formation. Indeed, Geha et al. (2012) find that less than 2% of isolated galaxies with are quiescent. If these galaxies are truly not forming stars, they are extremely rare cases of quenched, low-mass galaxies in isolation. Here we explore the possible physical processes behind the emission line ratios and what may have removed the gas from these galaxies. We note that these galaxies are defined as at least 1.5 Mpc from any massive galaxy, such that the usual environmental processes which dominate in group and cluster environments are unlikely to be active.
A straightforward interpretation is that these galaxies are depleted of H I because of AGN feedback. In this scenario, the line ratios that we observe are excited by accretion onto the central black hole, and energy from accretion has successfully coupled to the gas in the galaxy on large scales and removed and/or destroyed the gas in the galaxy. Accretion energy is observed to drive large scale outflows in molecular (e.g., Alatalo et al., 2011; Veilleux et al., 2013), warm ionized (e.g., Liu et al., 2013; Harrison et al., 2012), and hot (warm absorbers, BALs) gas (e.g., Crenshaw et al., 2003; Reeves et al., 2009). The energy may couple to the gas via radiation pressure on dust (e.g., Thompson et al., 2005), via thermal heating (e.g., Weinberger et al., 2016) or via input of kinetic energy (e.g., Choi et al., 2012).
Many of the gas-normal and gas-depleted galaxies are classified as LINERs. While LINER emission in massive galaxies has been directly linked with black hole accretion, there are many instances of off-nuclear LINERs (see Ho (2008) and references therein). Even in cases with unambiguous signs of accretion, it is not clear that the AGN provide sufficient photons to photoionize the gas (Eracleous et al., 2010; Yan & Blanton, 2012). A number of photoionization sources may explain the observed line ratios. Shocks and post-AGB (pAGB) stars are possible sources of excitation for the gas. In the case of pAGB stars, we would expect H equivalent widths less than 3Å if pAGB stars are causing a diffuse stellar emission (Binette et al., 1994; Belfiore et al., 2016, 2015). The H equivalent width distribution suggests that the majority of the line emission cannot be excited by pAGB stars, leaving shocks or AGN as the most viable options.
If AGN activity is not responsible for heating or removing the cold gas, perhaps the compact structure of the gas-depleted galaxies provides a clue to their nature. Star formation may have been extremely bursty and destroyed or otherwise consumed the cold gas. Compact galaxies can indeed experience extreme outflows caused by compact stellar feedback (Diamond-Stanic et al., 2012). If most of the star-forming cold gas has been removed, we may be seeing the remaining shocked gas from the outflows. This scenario could explain both the gas depletion and the line ratios without invoking an AGN. The three compact, gas-normal galaxies at large BPT distances will be interesting to study for signs of higher star-formation rates or larger outflow velocities than their more diffuse counterparts. Finally, higher spatial resolution imaging and spectroscopy of both the star-forming and gas-depleted compact galaxies would be enlightening, to determine whether they have a diffuse disk component or central point source.
5. Summary
In this work, we study the H I masses of galaxies with signs of AGN activity as measured by optical emission lines. We compile a catalog of isolated galaxies with optical emission lines measured from SDSS DR8 spectra and single-dish H I observations both from the ALFALFA 70% data release and from Paper I. We obtain new, deeper H I observations with a focus on isolated, low-mass galaxies selected from the Reines et al. (2013) “dwarf” galaxy sample with signs of AGN activity. We measure a new - relation using ALFALFA 70% data as in Equation 2. We also measure the distance of each galaxy with [O III]/H and [N II]/H data from the Baldwin Phillips Terlevich (BPT) star-forming sequence (). We use this distance as a measurement of AGN activity strength and compare as a function of . Our results are summarized as follows:
-
1.
We identify a set of isolated, low-mass galaxies with and 0.11 dex that is significantly gas-depleted.
-
2.
7 of the 9 gas-depleted galaxies are located above the H II demarcation line of Kewley et al. (2006) on the [O III]/H and [S II]/H diagram, 3 of which are categorized as LINERs and 4 as Seyferts.
-
3.
The gas-depleted, low-mass, isolated galaxies with large are red and compact with old stellar populations and no distinguishable signs of star formation. The property distributions of the gas-depleted sample are inconsistent with the general population of isolated galaxies in the same stellar mass range.
-
4.
We compare the gas-depleted sample to a population of 15 gas-normal, low-mass, isolated galaxies with large . This sample consists primarily of star-forming, late-type galaxies. The majority of these galaxies are consistent with the general population of isolated galaxies in the same stellar mass range. However, we find 3 gas-normal galaxies with similar visual and structural properties as the gas-depleted population. We find a similar fraction of these gas-normal galaxies in the LINER and Seyfert regions on the [O III]/H and [S II]/H BPT diagram as the gas-depleted sample.
Because these galaxies are very isolated (more distance than 1.5 Mpc from a more massive neighbor), environmental process cannot explain the emission line ratios or H I masses in the gas-depleted sample. We suggest two possibilities below.
In the first case, the energy from black hole accretion successfully couples to the cold gas and causes both the emission lines and the depletion of H I. The combination of deep radio and X-ray data would be useful to test the nature of these sources. As far as we are aware, no observations in radio continuum or X-ray exist for these galaxies.
In the second case, the compact structural properties of the gas-depleted sample may indicate a much more efficient and energetic star formation history than other galaxies in the same stellar mass regime. It could be that the shocks from this star formation generated the emission lines and removed the cold gas from these galaxies. Deeper imaging and resolved spectroscopy may help examine the nature of these compact galaxies. Star formation histories for both the gas-normal and gas-depleted compact galaxies would also help us determine the nature of these galaxies.
References
- Aihara et al. (2011) Aihara, H. et al. 2011, ApJS, 193, 29
- Alatalo et al. (2011) Alatalo, K., Blitz, L., Young, L. M., Davis, T. A., Bureau, M., Lopez, L. A., Cappellari, M., Scott, N., Shapiro, K. L., Crocker, A. F., Martín, S., Bois, M., Bournaud, F., Davies, R. L., de Zeeuw, P. T., Duc, P. A., Emsellem, E., Falcón-Barroso, J., Khochfar, S., Krajnovic, D., Kuntschner, H., Lablanche, P. Y., McDermid, R. M., Morganti, R., Naab, T., Oosterloo, T., Sarzi, M., Serra, P., & Weijmans, A. 2011, ApJ, 735, 88
- Baldwin et al. (1981) Baldwin, J. A., Phillips, M. M., & Terlevich, R. 1981, PASP, 93, 5
- Belfiore et al. (2015) Belfiore, F., Maiolino, R., Bundy, K., Thomas, D., Maraston, C., Wilkinson, D., Sánchez, S. F., Bershady, M., Blanc, G. A., Bothwell, M., Cales, S. L., Coccato, L., Drory, N., Emsellem, E., Fu, H., Gelfand, J., Law, D., Masters, K., Parejko, J., Tremonti, C., Wake, D., Weijmans, A., Yan, R., Xiao, T., Zhang, K., Zheng, T., Bizyaev, D., Kinemuchi, K., Oravetz, D., & Simmons, A. 2015, MNRAS, 449, 867
- Belfiore et al. (2016) Belfiore, F., Maiolino, R., Maraston, C., Emsellem, E., Bershady, M. A., Masters, K. L., Yan, R., Bizyaev, D., Boquien, M., Brownstein, J. R., Bundy, K., Drory, N., Heckman, T. M., Law, D. R., Roman-Lopes, A., Pan, K., Stanghellini, L., Thomas, D., Weijmans, A.-M., & Westfall, K. B. 2016, MNRAS, 3111
- Binette et al. (1994) Binette, L., Magris, C. G., Stasinska, G., & Bruzual, A. G. 1994, A&A, 292, 13
- Blanton et al. (2011) Blanton, M. R., Kazin, E., Muna, D., Weaver, B. A., & Price-Whelan, A. 2011, AJ, 142, 31
- Blanton & Roweis (2007) Blanton, M. R. & Roweis, S. 2007, AJ, 133, 734
- Bower et al. (2006) Bower, R. G., Benson, A. J., Malbon, R., Helly, J. C., Frenk, C. S., Baugh, C. M., Cole, S., & Lacey, C. G. 2006, MNRAS, 370, 645
- Bradford et al. (2015) Bradford, J. D., Geha, M. C., & Blanton, M. R. 2015, ApJ, 809, 146
- Bradford et al. (2016) Bradford, J. D., Geha, M. C., & van den Bosch, F. C. 2016, ApJ, 832, 11
- Brough et al. (2013) Brough, S., Croom, S., Sharp, R., Hopkins, A. M., Taylor, E. N., Baldry, I. K., Gunawardhana, M. L. P., Liske, J., Norberg, P., Robotham, A. S. G., Bauer, A. E., Bland-Hawthorn, J., Colless, M., Foster, C., Kelvin, L. S., Lara-Lopez, M. A., Lopez-Sanchez, A. R., Loveday, J., Owers, M., Pimbblet, K. A., & Prescott, M. 2013, MNRAS, 435, 2903
- Catinella et al. (2010) Catinella, B., Schiminovich, D., Kauffmann, G., Fabello, S., Wang, J., Hummels, C., Lemonias, J., Moran, S. M., Wu, R., Giovanelli, R., Haynes, M. P., Heckman, T. M., Basu-Zych, A. R., Blanton, M. R., Brinchmann, J., Budavári, T., Gonçalves, T., Johnson, B. D., Kennicutt, R. C., Madore, B. F., Martin, C. D., Rich, M. R., Tacconi, L. J., Thilker, D. A., Wild, V., & Wyder, T. K. 2010, MNRAS, 403, 683
- Chabrier (2003) Chabrier, G. 2003, PASP, 115, 763
- Choi et al. (2012) Choi, E., Ostriker, J. P., Naab, T., & Johansson, P. H. 2012, ApJ, 754, 125
- Crenshaw et al. (2003) Crenshaw, D. M., Kraemer, S. B., & George, I. M. 2003, ARA&A, 41, 117
- Dashyan et al. (2018) Dashyan, G., Silk, J., Mamon, G. A., Dubois, Y., & Hartwig, T. 2018, MNRAS, 473, 5698
- DeBuhr et al. (2011) DeBuhr, J., Quataert, E., & Ma, C.-P. 2011, MNRAS, 420, 2221
- Di Matteo et al. (2005) Di Matteo, T., Springel, V., & Hernquist, L. 2005, Nature, 433, 604
- Diamond-Stanic et al. (2012) Diamond-Stanic, A. M., Moustakas, J., Tremonti, C. A., Coil, A. L., Hickox, R. C., Robaina, A. R., Rudnick, G. H., & Sell, P. H. 2012, ApJ, 755, L26
- Eracleous et al. (2010) Eracleous, M., Hwang, J. A., & Flohic, H. M. L. G. 2010, ApJ, 711, 796
- Fabello et al. (2011) Fabello, S., Kauffmann, G., Catinella, B., Giovanelli, R., Haynes, M. P., Heckman, T. M., & Schiminovich, D. 2011, MNRAS, 416, 1739
- Fabian (1999) Fabian, A. C. 1999, MNRAS, 308, L39
- Gabor et al. (2011) Gabor, J. M., Davé, R., Oppenheimer, B. D., & Finlator, K. 2011, MNRAS, 417, 2676
- Geha et al. (2012) Geha, M., Blanton, M. R., Yan, R., & Tinker, J. L. 2012, ApJ, 757, 85
- Genel et al. (2014) Genel, S., Vogelsberger, M., Springel, V., Sijacki, D., Nelson, D., Snyder, G., Rodriguez-Gomez, V., Torrey, P., & Hernquist, L. 2014, eprint arXiv:1405.3749
- Geréb et al. (2015) Geréb, K., Morganti, R., Oosterloo, T. A., Hoppmann, L., & Staveley-Smith, L. 2015, A&A, 580, A43
- Giovanelli et al. (2005) Giovanelli, R. et al. 2005, AJ, 130, 2598
- Gomes et al. (2016) Gomes, J. M. et al. 2016, A&A, 585, A92
- Granato et al. (2004) Granato, G. L., De Zotti, G., Silva, L., Bressan, A., & Danese, L. 2004, ApJ, 600, 580
- Granato et al. (2001) Granato, G. L., Silva, L., Monaco, P., Panuzzo, P., Salucci, P., De Zotti, G., & Danese, L. 2001, MNRAS, 324, 757
- Harrison et al. (2012) Harrison, C. M., Alexander, D. M., Swinbank, A. M., Smail, I., Alaghband-Zadeh, S., Bauer, F. E., Chapman, S. C., Del Moro, A., Hickox, R. C., Ivison, R. J., Menéndez-Delmestre, K., Mullaney, J. R., & Nesvadba, N. P. H. 2012, MNRAS, 426, 1073
- Haynes & Giovanelli (1984) Haynes, M. P. & Giovanelli, R. 1984, AJ, 89, 758
- Haynes et al. (2011) Haynes, M. P., Giovanelli, R., Martin, A. M., Hess, K. M., Saintonge, A., Adams, E. A. K., Hallenbeck, G., Hoffman, G. L., Huang, S., Kent, B. R., Koopmann, R. A., Papastergis, E., Stierwalt, S., Balonek, T. J., Craig, D. W., Higdon, S. J. U., Kornreich, D. A., Miller, J. R., O’Donoghue, A. A., Olowin, R. P., Rosenberg, J. L., Spekkens, K., Troischt, P., & Wilcots, E. M. 2011, AJ, 142, 170
- Heckman (1980) Heckman, T. M. 1980, A&A, 87, 152
- Hirschmann et al. (2013) Hirschmann, M., De Lucia, G., Iovino, A., & Cucciati, O. 2013, MNRAS, 433, 1479
- Ho (2008) Ho, L. C. 2008, ARA&A, 46, 475
- Ho et al. (2008) Ho, L. C., Darling, J., & Greene, J. E. 2008, ApJ, 681, 128
- Huang et al. (2012) Huang, S., Haynes, M. P., Giovanelli, R., & Brinchmann, J. 2012, ApJ, 756, 113
- Karachentsev et al. (2011) Karachentsev, I. D., Makarov, D. I., Karachentseva, V. E., & Melnyk, O. V. 2011, Astrophys. Bull., 66, 1
- Kauffmann et al. (2003) Kauffmann, G., Heckman, T. M., Simon White, D. M., Charlot, S., Tremonti, C., Brinchmann, J., Bruzual, G., Peng, E. W., Seibert, M., Bernardi, M., Blanton, M., Brinkmann, J., Castander, F., Csabai, I., Fukugita, M., Ivezić, Ž., Munn, J. A., Nichol, R. C., Padmanabhan, N., Thakar, A. R., Weinberg, D. H., & York, D. 2003, MNRAS, 341, 33
- Kewley et al. (2013) Kewley, L. J., Dopita, M. A., Leitherer, C., Davé, R., Yuan, T., Allen, M., Groves, B., & Sutherland, R. 2013, ApJ, 774, 100
- Kewley et al. (2001) Kewley, L. J., Dopita, M. A., Sutherland, R. S., Heisler, C. A., & Trevena, J. 2001, ApJ, 556, 121
- Kewley et al. (2004) Kewley, L. J., Geller, M. J., & Jansen, R. A. 2004, AJ, 127, 2002
- Kewley et al. (2006) Kewley, L. J., Groves, B., Kauffmann, G., & Heckman, T. 2006, MNRAS, 372, 961
- Koribalski et al. (2004) Koribalski, B. S., Staveley-Smith, L., Kilborn, V. A., Ryder, S. D., Kraan-Korteweg, R. C., Ryan-Weber, E. V., Ekers, R. D., Jerjen, H., Henning, P. A., Putman, M. E., Zwaan, M. A., de Blok, W. J. G., Calabretta, M. R., Disney, M. J., Minchin, R. F., Bhathal, R., Boyce, P. J., Drinkwater, M. J., Freeman, K. C., Gibson, B. K., Green, A. J., Haynes, R. F., Juraszek, S., Kesteven, M. J., Knezek, P. M., Mader, S., Marquarding, M., Meyer, M., Mould, J. R., Oosterloo, T., O’Brien, J., Price, R. M., Sadler, E. M., Schröder, A., Stewart, I. M., Stootman, F., Waugh, M., Warren, B. E., Webster, R. L., & Wright, A. E. 2004, AJ, 128, 16
- Lemonias et al. (2014) Lemonias, J. J., Schiminovich, D., Catinella, B., Heckman, T. M., & Moran, S. M. 2014, ApJ, 790, 27
- Liu et al. (2013) Liu, G., Zakamska, N. L., Greene, J. E., Nesvadba, N. P. H., & Liu, X. 2013, MNRAS, 436, 2576
- Pracy et al. (2014) Pracy, M. B., Owers, M. S., Zwaan, M., Couch, W., Kuntschner, H., Croom, S. M., & Sadler, E. M. 2014, MNRAS, 443, 388
- Reeves et al. (2009) Reeves, J. N., O’Brien, P. T., Braito, V., Behar, E., Miller, L., Turner, T. J., Fabian, A. C., Kaspi, S., Mushotzky, R., & Ward, M. 2009, ApJ, 701, 493
- Reines & Comastri (2016) Reines, A. E. & Comastri, A. 2016, Publ. Astron. Soc. Aust., 33, 1304
- Reines et al. (2013) Reines, A. E., Greene, J. E., & Geha, M. 2013, ApJ, 775, 116
- Reines & Volonteri (2015) Reines, A. E. & Volonteri, M. 2015, ApJ, 813, 82
- Roychowdhury et al. (2014) Roychowdhury, S., Chengalur, J. N., Kaisin, S. S., & Karachentsev, I. D. 2014, MNRAS, 445, 1392
- Sartori et al. (2015) Sartori, L. F., Schawinski, K., Treister, E., Trakhtenbrot, B., Koss, M., Shirazi, M., & Oh, K. 2015, MNRAS, 454, 3722
- Schaye et al. (2014) Schaye, J., Crain, R. A., Bower, R. G., Furlong, M., Schaller, M., Theuns, T., Dalla Vecchia, C., Frenk, C. S., McCarthy, I. G., Helly, J. C., Jenkins, A., Rosas-Guevara, Y. M., White, S. D. M., Baes, M., Booth, C. M., Camps, P., Navarro, J. F., Qu, Y., Rahmati, A., Sawala, T., Thomas, P. A., & Trayford, J. 2014, MNRAS, 446, 521
- Sharp & Bland-Hawthorn (2010) Sharp, R. G. & Bland-Hawthorn, J. 2010, ApJ, 711, 818
- Silk & Rees (1998) Silk, J. & Rees, M. J. 1998, A&A, 331, L1
- Somerville et al. (2008) Somerville, R. S., Hopkins, P. F., Cox, T. J., Robertson, B. E., & Hernquist, L. 2008, MNRAS, 391, 481
- Thompson et al. (2005) Thompson, T. A., Quataert, E., & Murray, N. 2005, ApJ, 630, 167
- Tremonti et al. (2004) Tremonti, C. A., Heckman, T. M., Kauffmann, G., Brinchmann, J., Charlot, S., White, S. D. M., Seibert, M., Peng, E. W., Schlegel, D. J., Uomoto, A., Fukugita, M., & Brinkmann, J. 2004, ApJ, 613, 898
- Veilleux et al. (2013) Veilleux, S., Meléndez, M., Sturm, E., Gracia-Carpio, J., Fischer, J., González-Alfonso, E., Contursi, A., Lutz, D., Poglitsch, A., Davies, R., Genzel, R., Tacconi, L., de Jong, J. A., Sternberg, A., Netzer, H., Hailey-Dunsheath, S., Verma, A., Rupke, D. S. N., Maiolino, R., Teng, S. H., & Polisensky, E. 2013, ApJ, 776, 27
- Veilleux & Osterbrock (1987) Veilleux, S. & Osterbrock, D. E. 1987, ApJS, 63, 295
- Weinberger et al. (2016) Weinberger, R., Springel, V., Hernquist, L., Pillepich, A., Marinacci, F., Pakmor, R., Nelson, D., Genel, S., Vogelsberger, M., Naiman, J., & Torrey, P. 2016, MNRAS, 465, 3291
- Yan & Blanton (2012) Yan, R. & Blanton, M. R. 2012, ApJ, 747, 61
- Zhu & Wu (2015) Zhu, Y.-N. & Wu, H. 2015, AJ, 149, 10