Many-body quantum Monte Carlo study of 2D materials:
cohesion and band gap in single-layer phosphorene
Abstract
Quantum Monte Carlo (QMC) is applied to obtain the fundamental (quasiparticle) electronic band gap, , of a semiconducting two-dimensional (2D) phosphorene whose optical and electronic properties fill the void between graphene and 2D transition metal dichalcogenides. Similarly to other 2D materials, the electronic structure of phosphorene is strongly influenced by reduced screening, making it challenging to obtain reliable predictions by single-particle density functional methods. Advanced GW techniques, which include many-body effects as perturbative corrections, are hardly consistent with each other, predicting the band gap of phosphorene with a spread of almost 1 eV, from 1.6 to 2.4 eV. Our QMC results, from infinite periodic superlattices as well as from finite clusters, predict to be about 2.4 eV, indicating that available GW results are systematically underestimating the gap. Using the recently uncovered universal scaling between the exciton binding energy and , we predict the optical gap of 1.75 eV that can be directly related to measurements even on encapsulated samples due to its robustness against dielectric environment. The QMC gaps are indeed consistent with recent experiments based on optical absorption and photoluminescence excitation spectroscopy. We also predict the cohesion of phosphorene to be only slightly smaller than that of the bulk crystal. Our investigations not only benchmark GW methods and experiments, but also open the field of 2D electronic structure to computationally intensive but highly predictive QMC methods which include many-body effects such as electronic correlations and van der Waals interactions explicitly.
I Introduction
Two-dimensional (2D) materials have already revolutionized science, and have the potential to revolutionize technology due to their unique electronic, optical, thermal, spin, and magnetic properties. 1; 2; 3; 4; 5; 6; 7 Remarkably, 2D materials cover a wide range of electronic structures. The electronic properties range from metallic single atom layers of palladium and rhodium, 8 semimetallic graphene, 3 semiconducting transition metal dichalcogenides, 5 to insulating wide-gap h-BN. 6 Crucial for device applications are materials with a proper band gap. Layered black phosphorus (BP) features fundamental band gaps in the range of 0.3–2 eV, bridging semimetallic graphene and transition metal dichalcogenides. 9 This range is specifically important for optoelectronic, photovoltaic, photocatalytic, fiber optic telecommunications, and thermal imaging applications. 10
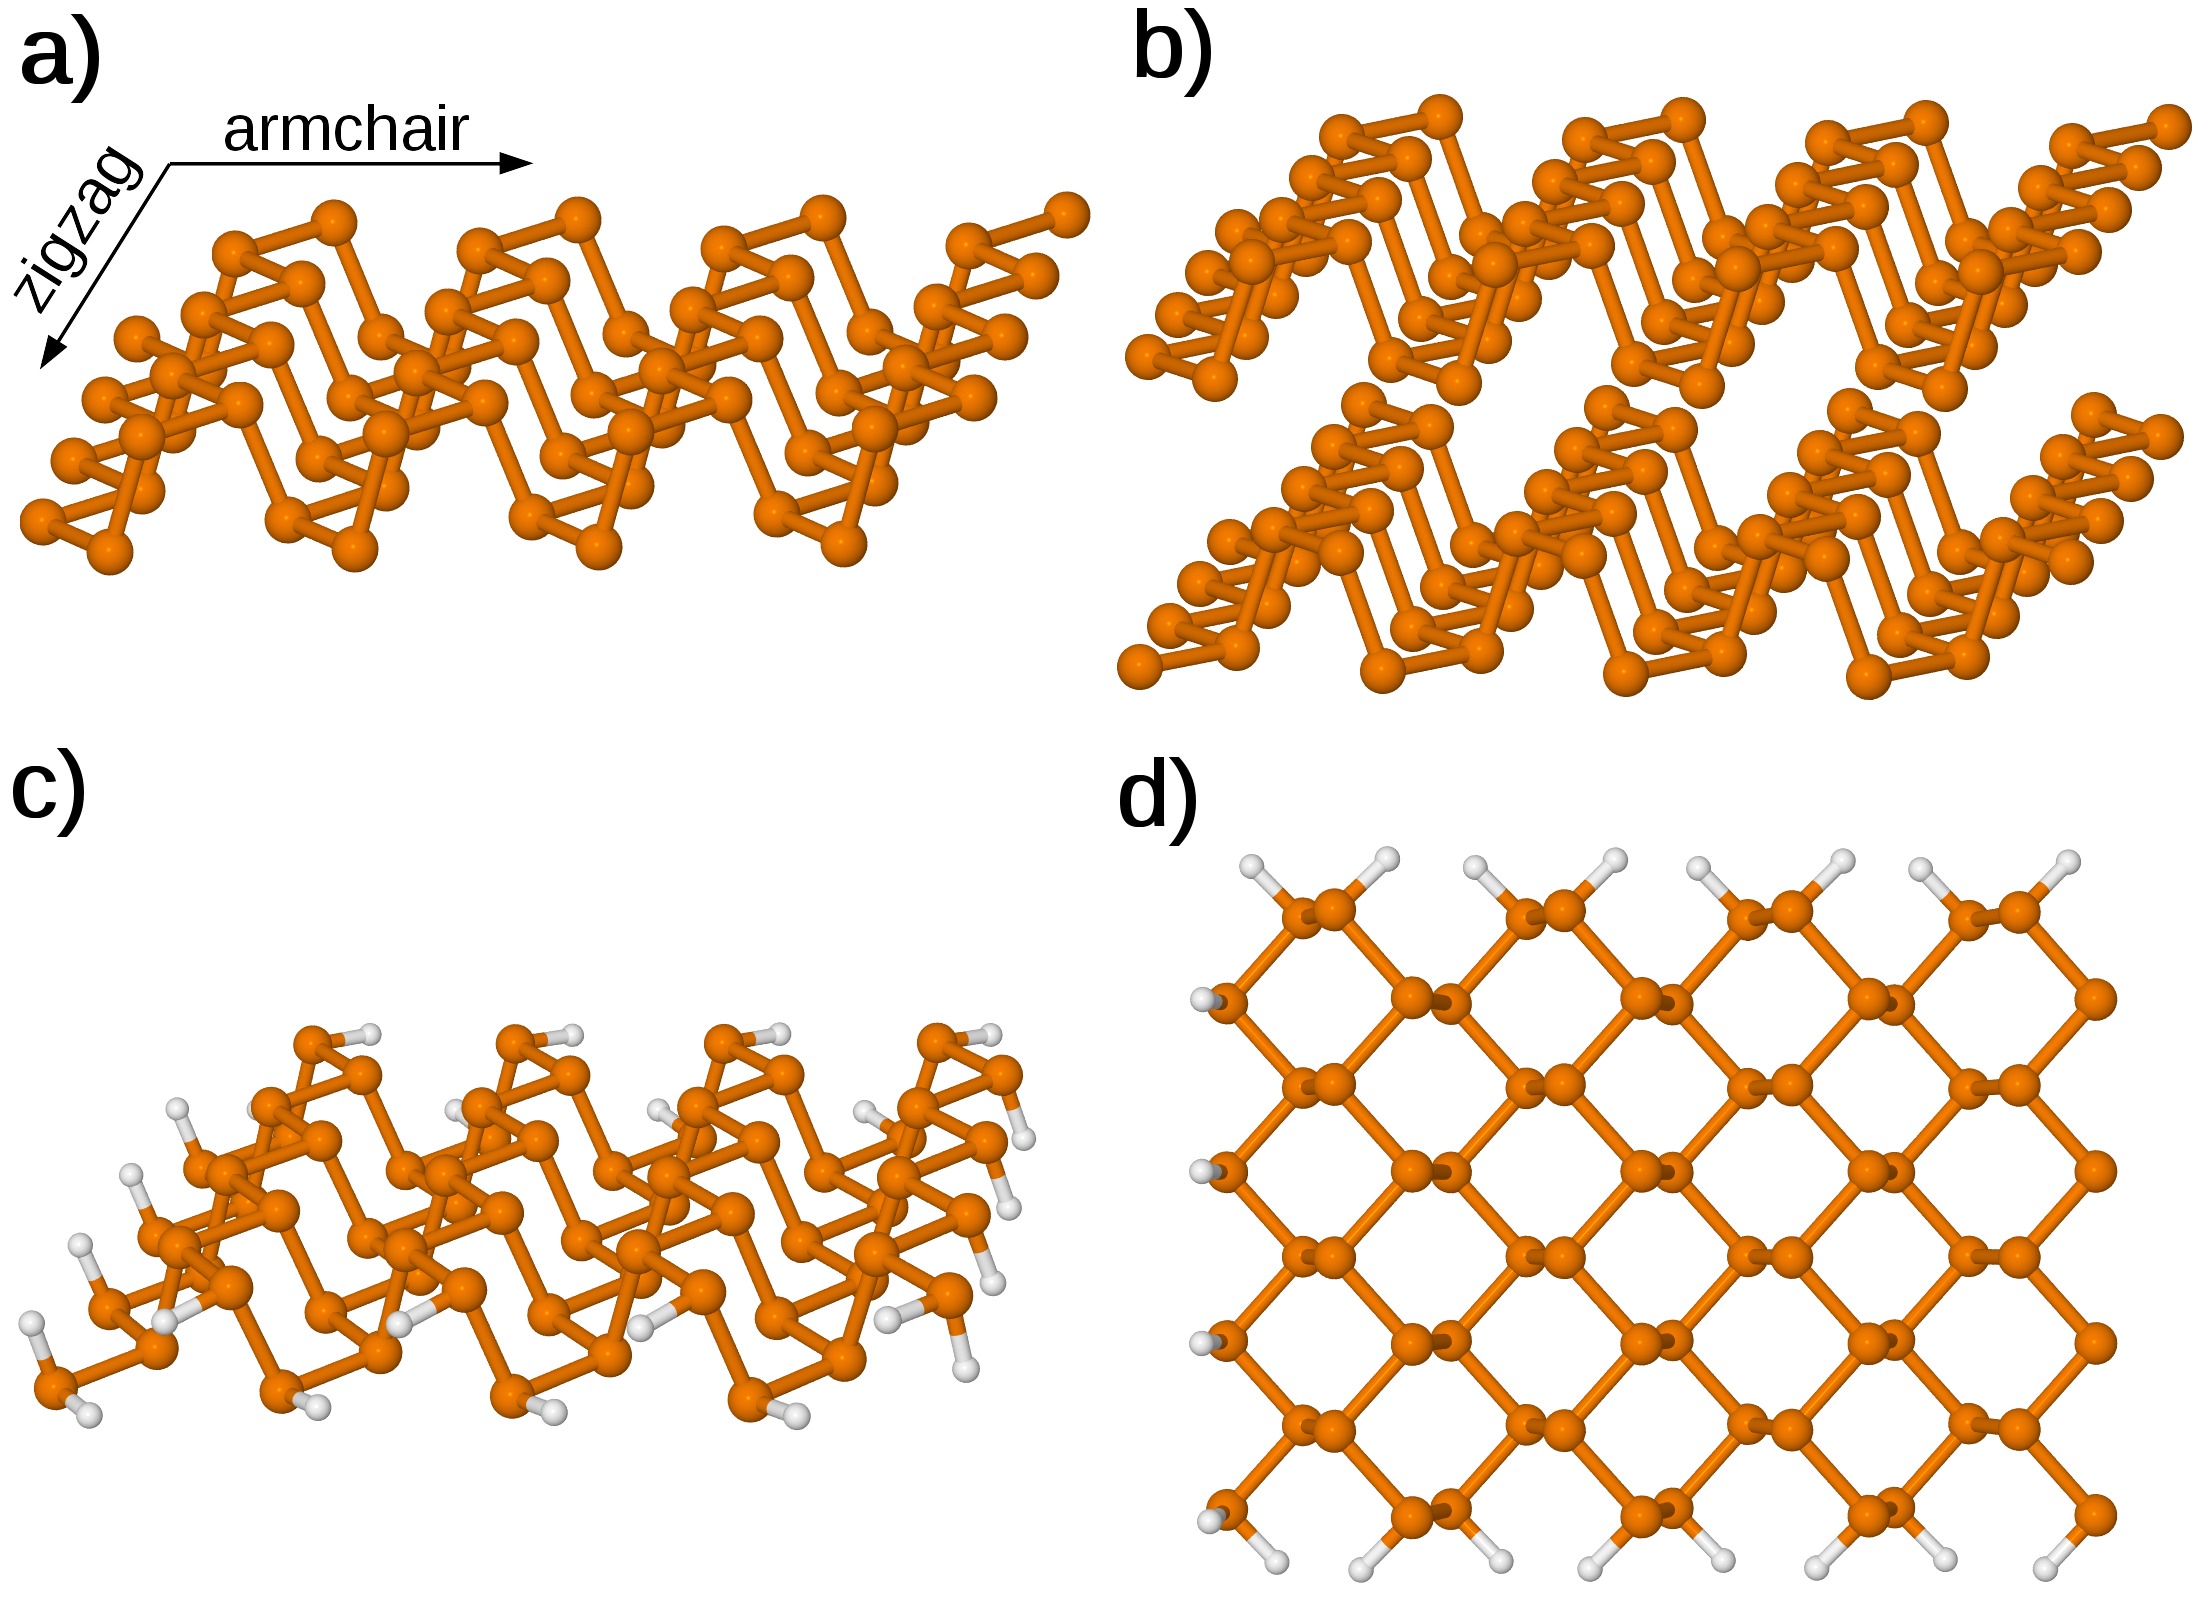
A single layer of black phosphorus—phosphorene—comprises sp3 bonded phosphorus atoms forming an anisotropic puckered honeycomb lattice, see Figure 1. The three-fold bonding coordination implies that each phosphorus atom has a lone pair orbital which makes phosphorene reactive to air. 9 This oxidation degradation is eliminated by capping or encapsulating phosphorene with(in) an insulator.
| DFT | DFT | DMC | exp. | exp. | exp. | exp. | |||||||||
| GGA | H | GGA | H | GGA | GGA | GGA | GGA | GGA | GGA | GGA/H | STS | PLES | PL | OA | |
| 0.815 | 1.515 | 1.916 | 2.417 | 2.318 | 2.319 | 2.020; 19 | 1.814 | 1.621 | 2.122 | 2.680.10 | 2.4 | 2.016 | 2.20.123 | 2.10.0224, 1.625 | 1.726 |
| 2.540.12 | 2.00.0424, 1.52 | ||||||||||||||
| 0.8 | 1.7 | 2.410.17 | 1.30.0223 | ||||||||||||
| - | - | - | - | 0.918 | - | 0.820 | 0.514 | - | 0.822 | 0.65⋆ | - | 0.90.1223 | - | - | |
Black phosphorus features a direct band gap at the point, all the way from single-layer phosphorene up to bulk. However, and this makes phosphorene particularly attractive, there are several ways to manipulate the gap. (i) First, the gap varies with the number of layers and therefore band engineering techniques can be readily applied. Exfoliation of layers from the bulk BP is straightforward, 1; 2; 27 see Fig. 1, due to predominantly van der Waals interlayer bonds. 28 While in the bulk the gap is about 0.3 eV, it increases towards about 2 eV (we argue for 2.4 eV) in single-layer phosphorene. 10 (ii) Next, phosphorene can sustain large in-plane compressive/tensile strains in excess of about 10%, compared to just some 2% in the bulk. 29 This strain engineering is predicted to affect the band gap by 50%. 30 Finally, (iii) the gap of phosphorene is predicted to be strongly susceptible to the dielectric environment. 10; 2; 26
Assuming that the fundamental (quasiparticle) band gap depends on the dielectric that protects it against degradation, can we infer from experiments some key characteristics about pristine phosphorene providing thus the benchmark for both experiment and theory? Two established facts make the answer positive. (a) The dielectric environment affects both the fundamental gap, as well as the exciton binding energy, .31 Remarkably, the difference, , which is the optical gap, is essentially unaffected by the dielectric. 23; 32; 33; 34; 35; 36 (b) Recently, a universal linear scaling between the exciton binding energy and the fundamental gap, was predicted based on many examples from the 2D realm 14 (see also the predecessor18), including phosphorene. Combining these two observations, (a) and (b), allows to estimate from a calculation of on a pristine 2D material, namely , and compare with experimental obtained from an encapsulated or capped sample.
Let us now turn to the existing experimental and theoretical state-of-the-art in determining the electronic gap(s) of single-layer phosphorene. Table 1 shows a rather comprehensive selection of measured and calculated fundamental and optical gaps, as well as exciton binding energies for phosphorene. Photoluminescence is often contaminated by defect emission, as is also evidenced by the scatter of the measured values for . Most reliable is optical absorption. A recent experiment26 has reported eV, for phosphorene encapsulated in hBN. This value would lead to eV for pristine phosphorene, according to the above mentioned linear scaling. Similarly, it would suggest the exciton binding energy, , of about 0.65 eV. Certainly both (a) and (b) observations are not exact, so the above estimates of and would carry a scatter of perhaps 10% or so. If we next look at the photoluminescence excitation spectroscopy data for phosophorene on silicon oxide, 37 the obtained fundamental gap is eV. Considering the influence of the oxide, it is reasonable to deduce from this experiment that the fundamental gap of free-standing phosphorene is 0.1–0.2 eV greater, that is, 2.3–2.4 eV. 37
On the theory side, we see from Tab. I that single-particle density functional methods predict, unsurprisingly, too low and strongly method-dependent values for . Inclusion of GW corrections11 is essential to bring the gaps closer to 2 eV. However, various GW approximants ( or ) give different values coming from different implementations, ranging from 1.6 eV to 2.4 eV. The largest value, 2.4 eV, which would be consistent with the aforementioned optical absorption experiments, is obtained by using a hybrid functional.37 However, the same implementation predicts 0.6 eV band gap for bulk BP37 (experimental value is 0.3 eV), making it clear that there is a limited predicting power from this calculation. As for the exciton binding energies, predictions (see Tab. I) range from 0.5 to 1 eV, again with little consensus in both theory and experiment. The experimental value of 0.9 eV 37 is likely affected by the optical edge of 1.3 eV of the emission peak (compare to 1.73 eV of the absorption experiment26).
To obtain accurate bounds and reliable estimates of the band gap of phosphorene, we propose to employ the quantum Monte Carlo (QMC) method. QMC is an efficient, albeit computationally demanding 38; 39 way to benchmark electronic structure calculations in condensed matter. 40; 41; 42 Indeed, this method has been applied to compute band gaps in three-dimensional systems,40 clusters,43 and nanoparticles.44 In the 2D realm it was already used to obtain reference binding energies of 2D bilayers, 28; 45 but thus far has not been systematically employed to obtain electronic structure parameters.
Here we report QMC calculations for the fundamental band gap of single-layer phosphorene. We use both the periodic lattice as well as supercell approaches, to demonstrate convergence and consistency. The accuracy of the ground-state properties is evidenced by calculating cohesion, which differs little from the bulk value. We stress that our QMC calculation is the full method, not relying on phenomenological interactions. In fact, we solve the Schrödinger equation for hundreds of electrons interacting mutually as well as with the lattice ions, to obtain the ground and excited states needed for the band gap calculation. Finally, we note that the knowledge of the band gap of phosphorene is important not only on its own right as a fundamental electronic quantity of a potentially technologically relevant material, but it is crucial also for building effective theories such as tight-binding 21 and kp models. 46 We believe that our adaptation of QMC methods will open the way for this powerful technique to investigations of electronic structures of 2D systems, which are inherently prone to strong interactions and require careful considerations.
II Simulation techniques
The band gap was determined from both extended and cluster approximants with lattice parameters fixed to the experimental values in the black phosphorus crystal. In fact, it was shown that the experimental lattice parameters agree with the lattice parameters determined by QMC methods within the error bars 28. The gap was extracted as the singlet-singlet vertical excitation energy. Here , with and being, respectively, the ground- and the first excited-states obtained by fixed-node QMC 38 not allowing any relaxation of the DFT nodal hypersurfaces due to the HOMOLUMO electron excitation; no vibronic effects are included. The fixed-node approximation is the only fundamental approximation in the electronic structure QMC. 38
In the periodic setup the and were computed from DMC (diffusion Monte Carlo) energies in the fixed-node approximation using the VMC (variational Monte Carlo) trial wave functions with the nodal hypersurfaces determined by two different sets of DFT orbitals: the generalized gradient approximation PBE 12 (PBE/DMC) and hybrid B3LYP 13 (B3LYP/DMC), at the -point of the Brillouin zone, optimizing the short-range correlations of the Jastrow factor. 38 The consistency check using both PBE and B3LYP DFT nodal hypersurfaces was deemed important as at the DFT level the HOMO-LUMO gaps of the two DFT functionals differ by 1 eV, see Table 1. The Yeh-Berkowitz 47 modification in the 3D Ewald summation technique for systems with a slab geometry that are periodic in two dimensions and have a finite length in the third dimension, was adopted. We cross checked in detail that this agrees with an alternative derivation of Ewald sums for 2D slab geometries.48 In the cluster setup we used the B3LYP 13 (B3LYP/DMC) nodal hypersurfaces.
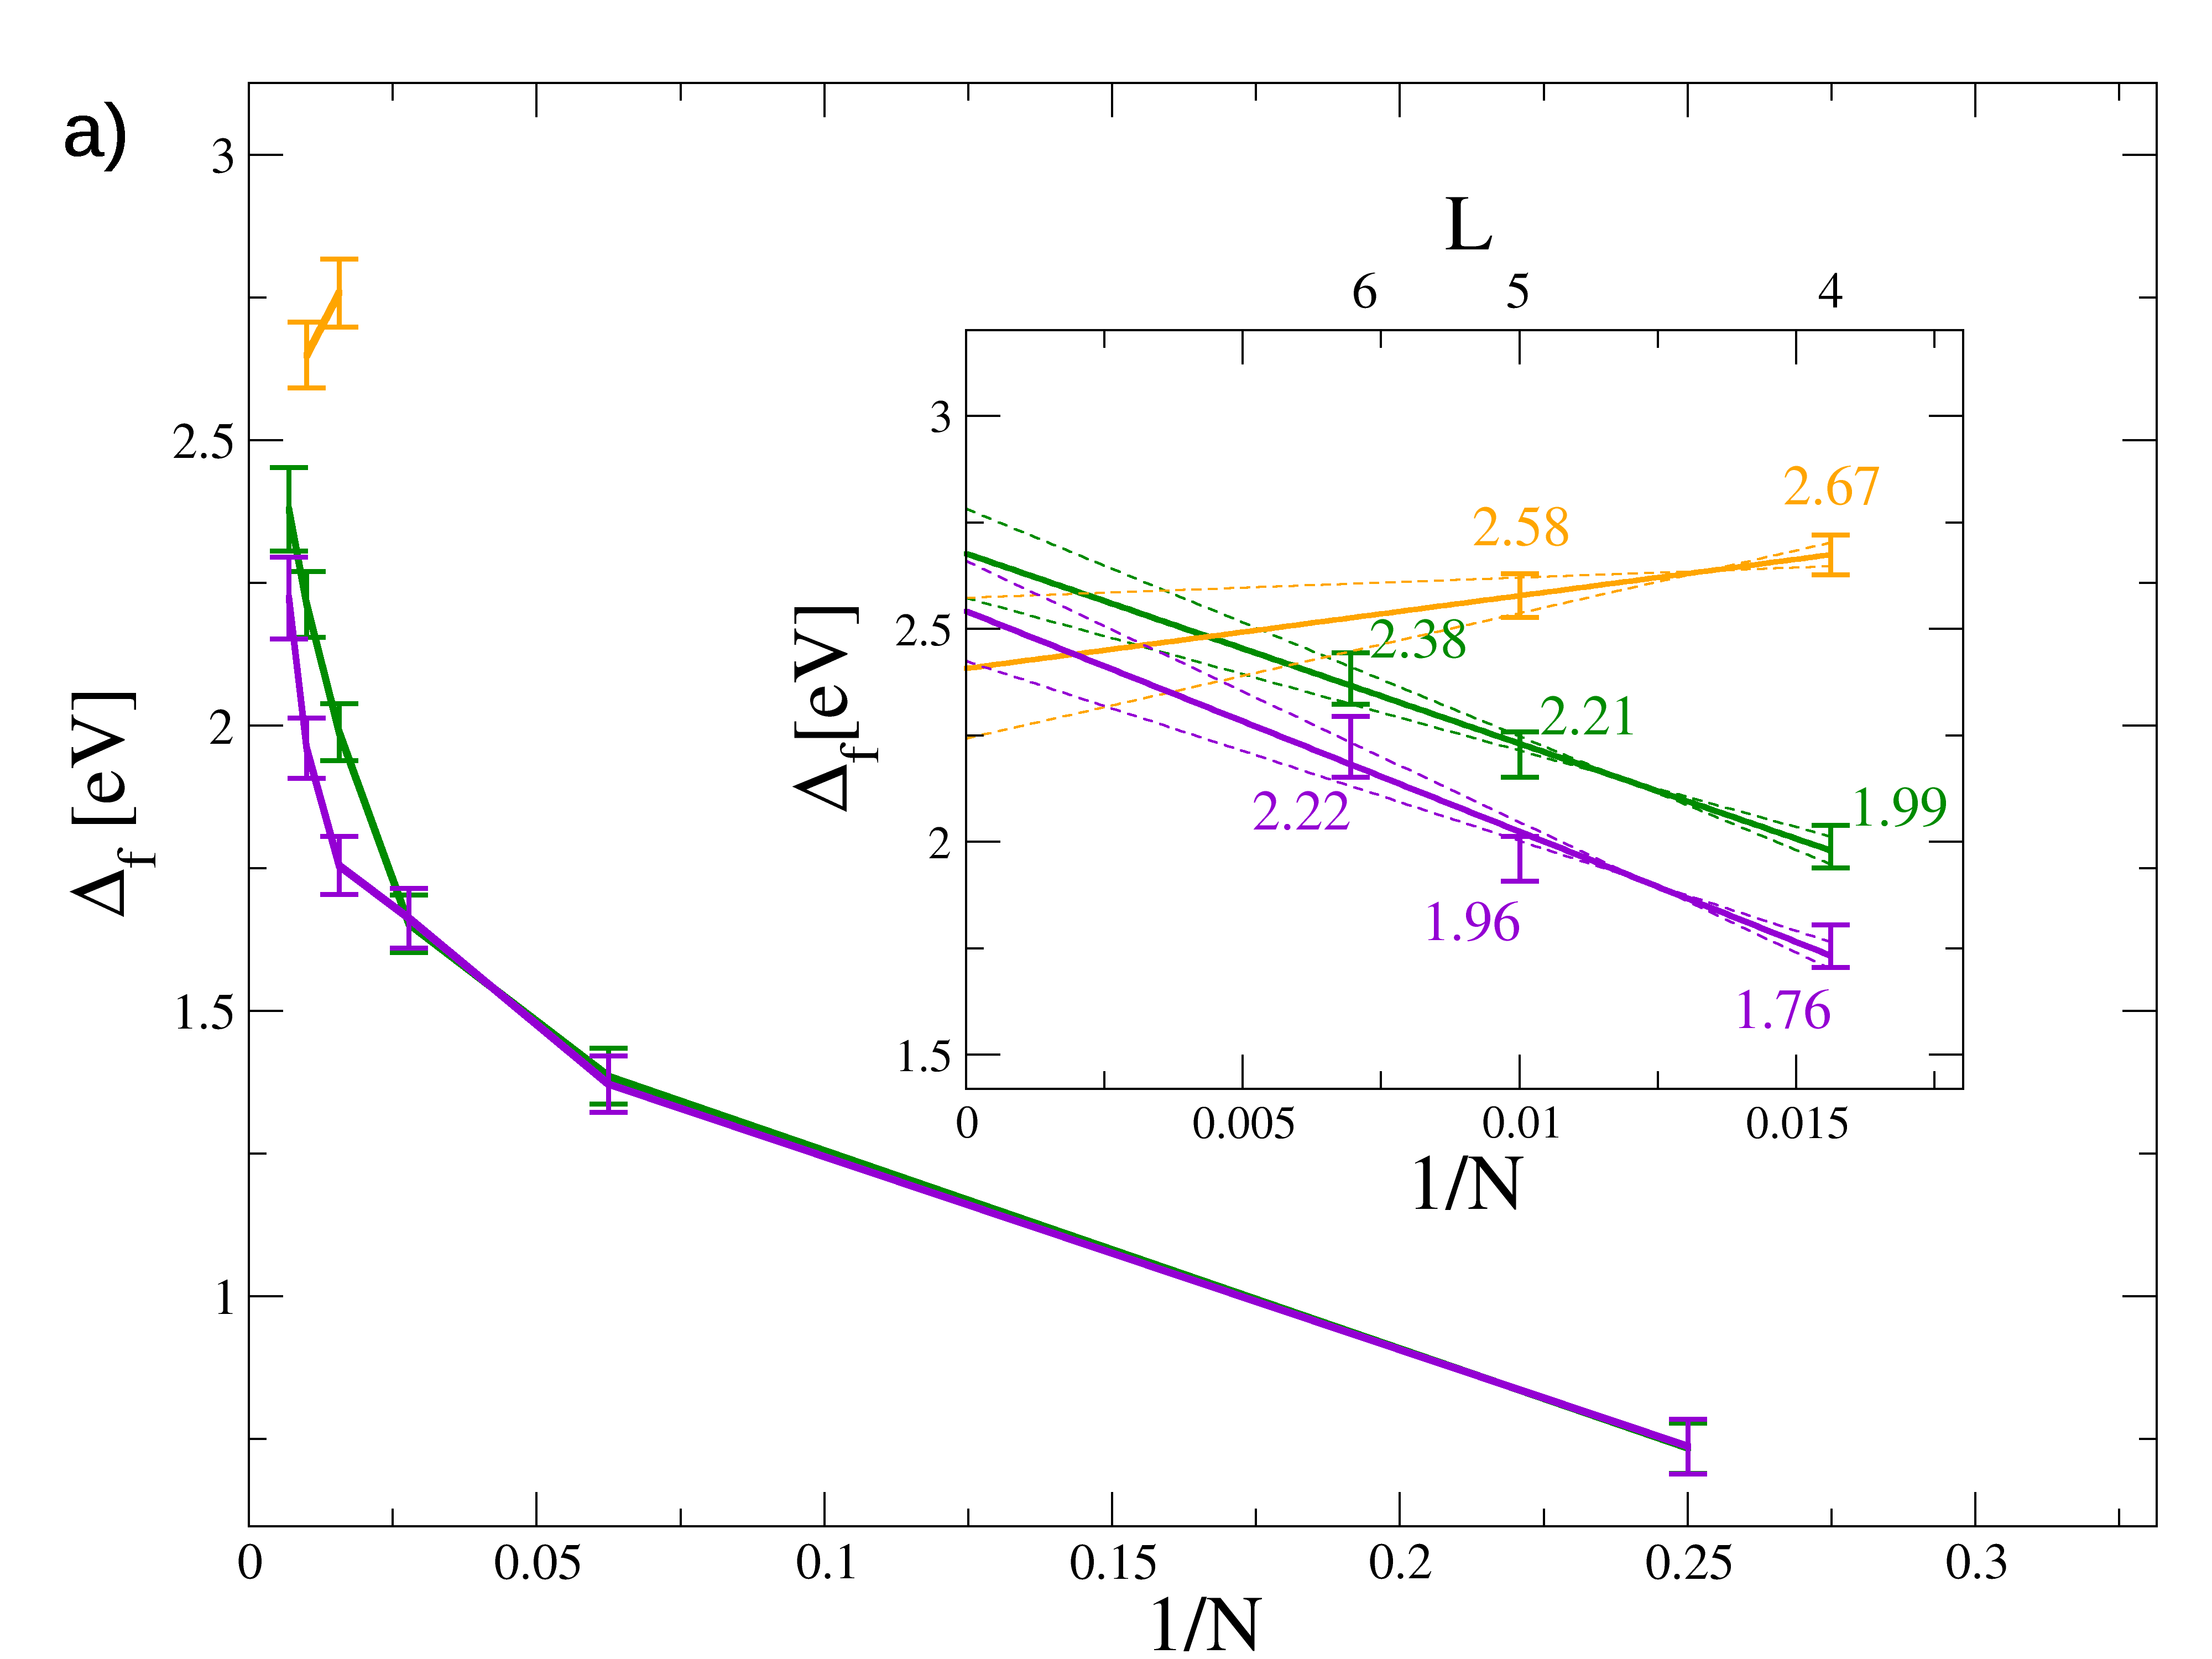
Finite-size scaling towards the thermodynamic limit was performed for a series of 1 1 to 6 6 series of periodic approximants, see Fig. 1 a), and for 4 4 and 5 5 H-terminated cluster approximants, assuming a linear scaling with 1/, where is the number of P atoms. Our approach corresponds to quasi-exact many-body treatment, to within the fixed-node approximation, of the 2D electron polarizability entering the equations for . 14 The ground-state energy was also used to determine the cohesion energy. More details can be found in Supplementary Material (SM).
III Results and discussion
Periodic supercells.
Our finite-size diffusion Monte-Carlo (DMC) scaling study of is shown in Fig. 2 a). Although in 3D periodic calculations typical QMC extrapolations from supercells to bulk behave as 1/ where is the number of atoms in the supercell, in the 2D slab systems the issue is more complicated. 48 The strong periodic Coulomb interactions unscreened in the direction perpendicular to the layer make the renormalization of electron interactions huge and the electrostatic energies slowly convergent. Therefore, the supercells have to be sufficiently large to marginalize the periodicity effects and to allow for reliable finite-size extrapolations. To this end, we have carried out extensive calculations of for the sequence of 1 1 up to 6 6 periodic supercell systems with two DFT nodal hypersurfaces. For sizes or larger the linear scaling describes the results very well. For smaller supercells, the different components of the total energies, such as the potential energy, are too biased to make the trends transparent.
The infinite-size extrapolation from the extended-system calculations yields
| (1) |
fixing the nodal hypersurfaces by the hybrid B3LYP 13 DFT functional. Recall that the corresponding DFT value is 1.7 eV, see Tab. I. If we now fix the nodal hypersurfaces by PBE 12 DFT single-particle orbitals, see Figure 2 a), we get the extrapolation to
| (2) |
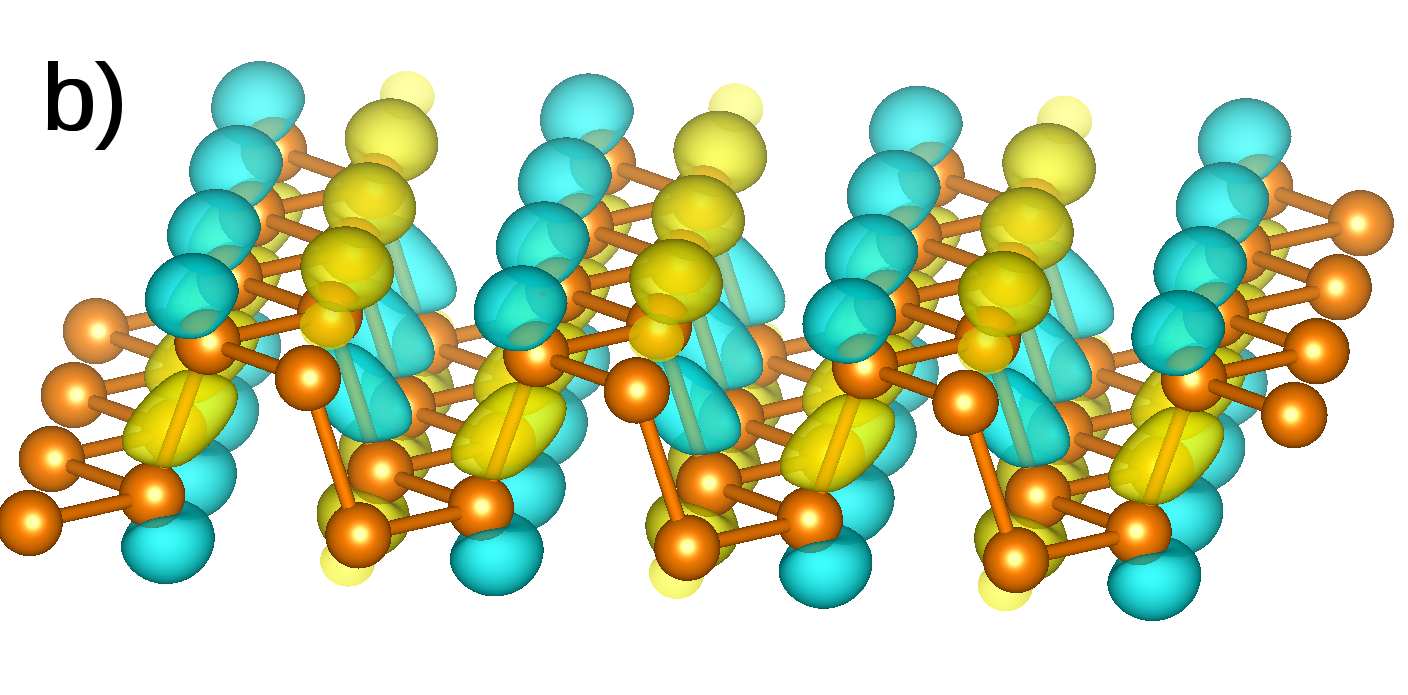
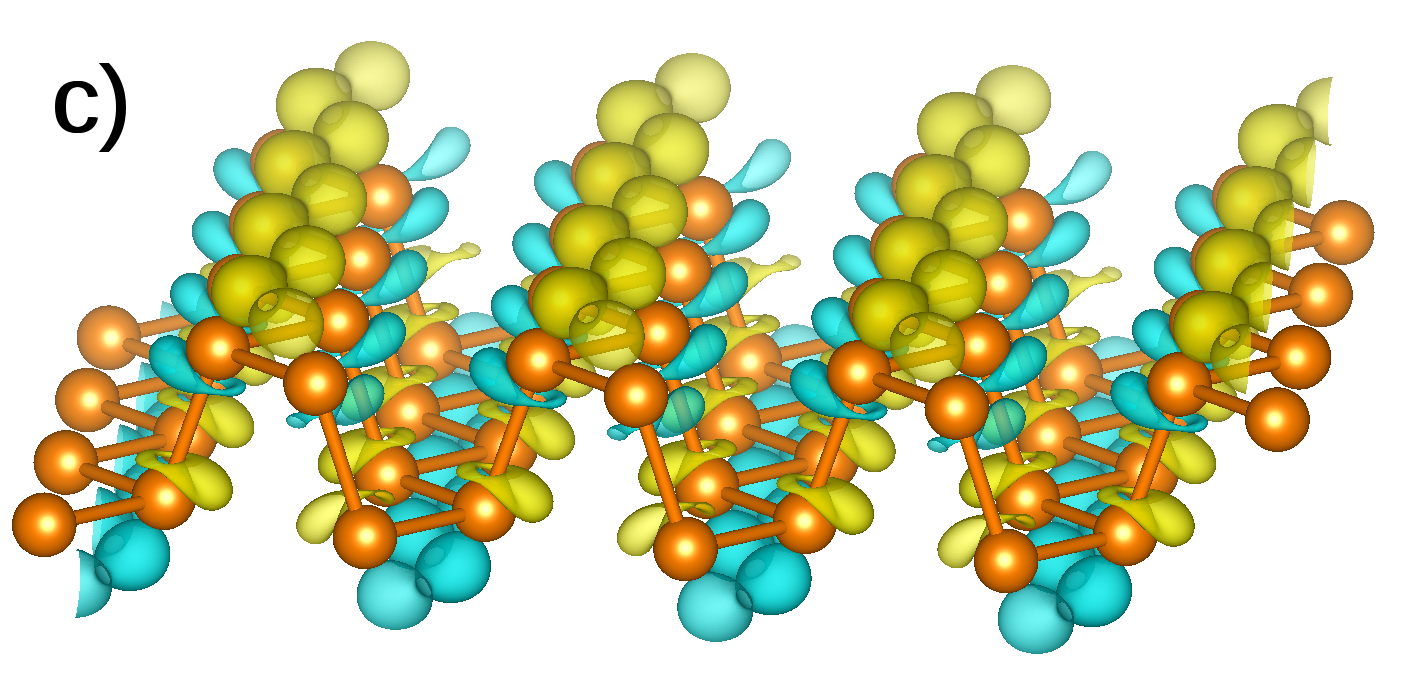
which overlaps with within the error bars. The PBE DFT gap is 0.8 eV. Remarkably, despite the significant difference of almost 1 eV in the DFT gaps, the QMC method that starts with the corresponding DFT wave functions (and fixing their nodal hypersurfaces), gives a consistent output for both! Surprisingly, the convergence of in the periodic setting is determined mainly by the Hartree-Fock energy components, with the rest, including the correlation energies, converging much faster. For example, the ground-state correlation energy is essentially converged at the 3 3 supercell size, whereas the excited-state at a slightly larger size of 5 5. This provides a way of estimating the phosphorene properties from the more slowly converging Hartree-Fock results, simply by adding the corresponding correlation energies; see SM for more details. We also plot the HOMO/LUMO orbitals for the extended calculations at the point in Fig. 2 b) and c), respectively. The orbital’s distribution and bonding type can give insight into Coulomb finite size effects; see SM for a discussion.
Clusters.
Due to intricacies of extrapolations of the periodic supercells, and for consistency, we have also calculated in a finite cluster setting. The clusters corresponded to supercell sizes in the periodic method above, with terminations of unsaturated bonds with H atoms, see Fig. 1 c) and d). Finite-size scaling constructed from these cluster approximants, given in Fig. 2 a), extrapolates to
| (3) |
reasonably close to considering the fact that we compare periodic systems versus isolated clusters in vacuum and that these two models actually exhibit opposite trends as the functions of the system size. Due to finite-size confinement, the computed excitations in finite clusters as a rule overestimate the gaps. The DMC values for the 5 5 clusters clearly illustrate this, see Fig. 2 a). However, as explained in SM, the cluster gaps are bound to converge to the fundamental gap in the infinite size limit and also provide upper bounds for the estimation of fundamental gaps as indicated above. The upper bound property of cluster gaps enables us to probe usefulness of alternative extrapolations to bulk schemes, such as, for instance, 1/ scaling, 49 see SM. Since both our estimates of from the periodic supercells are greater than the cluster estimate, there is likely a small bias in the evaluation of excitations in the periodic supercells. In particular, the fixed-node errors in the excited and the ground states are most likely not identical and could be also intertwined with the remnants of the finite size errors even at larger sizes.
The convergence of the excited states is much more challenging in extended 2D systems than in bulk. The key reason is that the non-periodic direction enables changes in the single-particle densities that have dominant contribution to the periodic Coulomb interactions, a problem that is naturally avoided in cluster geometries; for details see SM. Therefore, we estimate that a systematic uncertainty of 0.1 to 0.2 eV could be present in our periodic-supercells gap calculations. The multiple calculations of the excited states that we present clearly illustrate this aspect.
The error is certainly greater for the excited-state energy, than for the ground state. Since the variational principle behind QMC gives the upper bound on the energy, it follows that the cluster value is a superior estimate for the fundamental gap. We believe that the true value of for intrinsic phosphorene is about 2.4 eV, as also indicated in Tab. I. The GW values, defining the current state-of-the-art, are, compared to QMC, widely scattered and systematically underestimating the gap.
Exciton binding energy, optical gap, and comparison with experiment.
Using the universal linear scaling,14 , we can also estimate the excitonic binding energy of phosphorene as eV. The optical gap is then eV. This is consistent with the optical absorption experiment26 which reports 1.73 eV. As we discussed in the introduction, the optical gap of 2D semiconductors should be insensitive to the dielectric environment, justifying the consistency claim.
In terms of the fundamental gap obtained in experiment, (see Tab. 1), photoluminescence emission spectroscopy (silicon substrate, no capping), 23 optical absorption (sapphire substrate, h-BN capping), 26 and scanning tunneling spectroscopy (no capping), 16 yield values of of 2.2, 1.8, and 2.0 eV, respectively. The optical absorption value was attributed to the h-BN capping which also seems to reduce the exciton binding energy to just 0.1 eV. 26 The photoluminescence value of 2.2 eV is closest to our QMC prediction. Considering that the sample was on a dielectric substrate which lowers by perhaps 0.1–0.2 eV,26 our result is also consistent with this experiment.
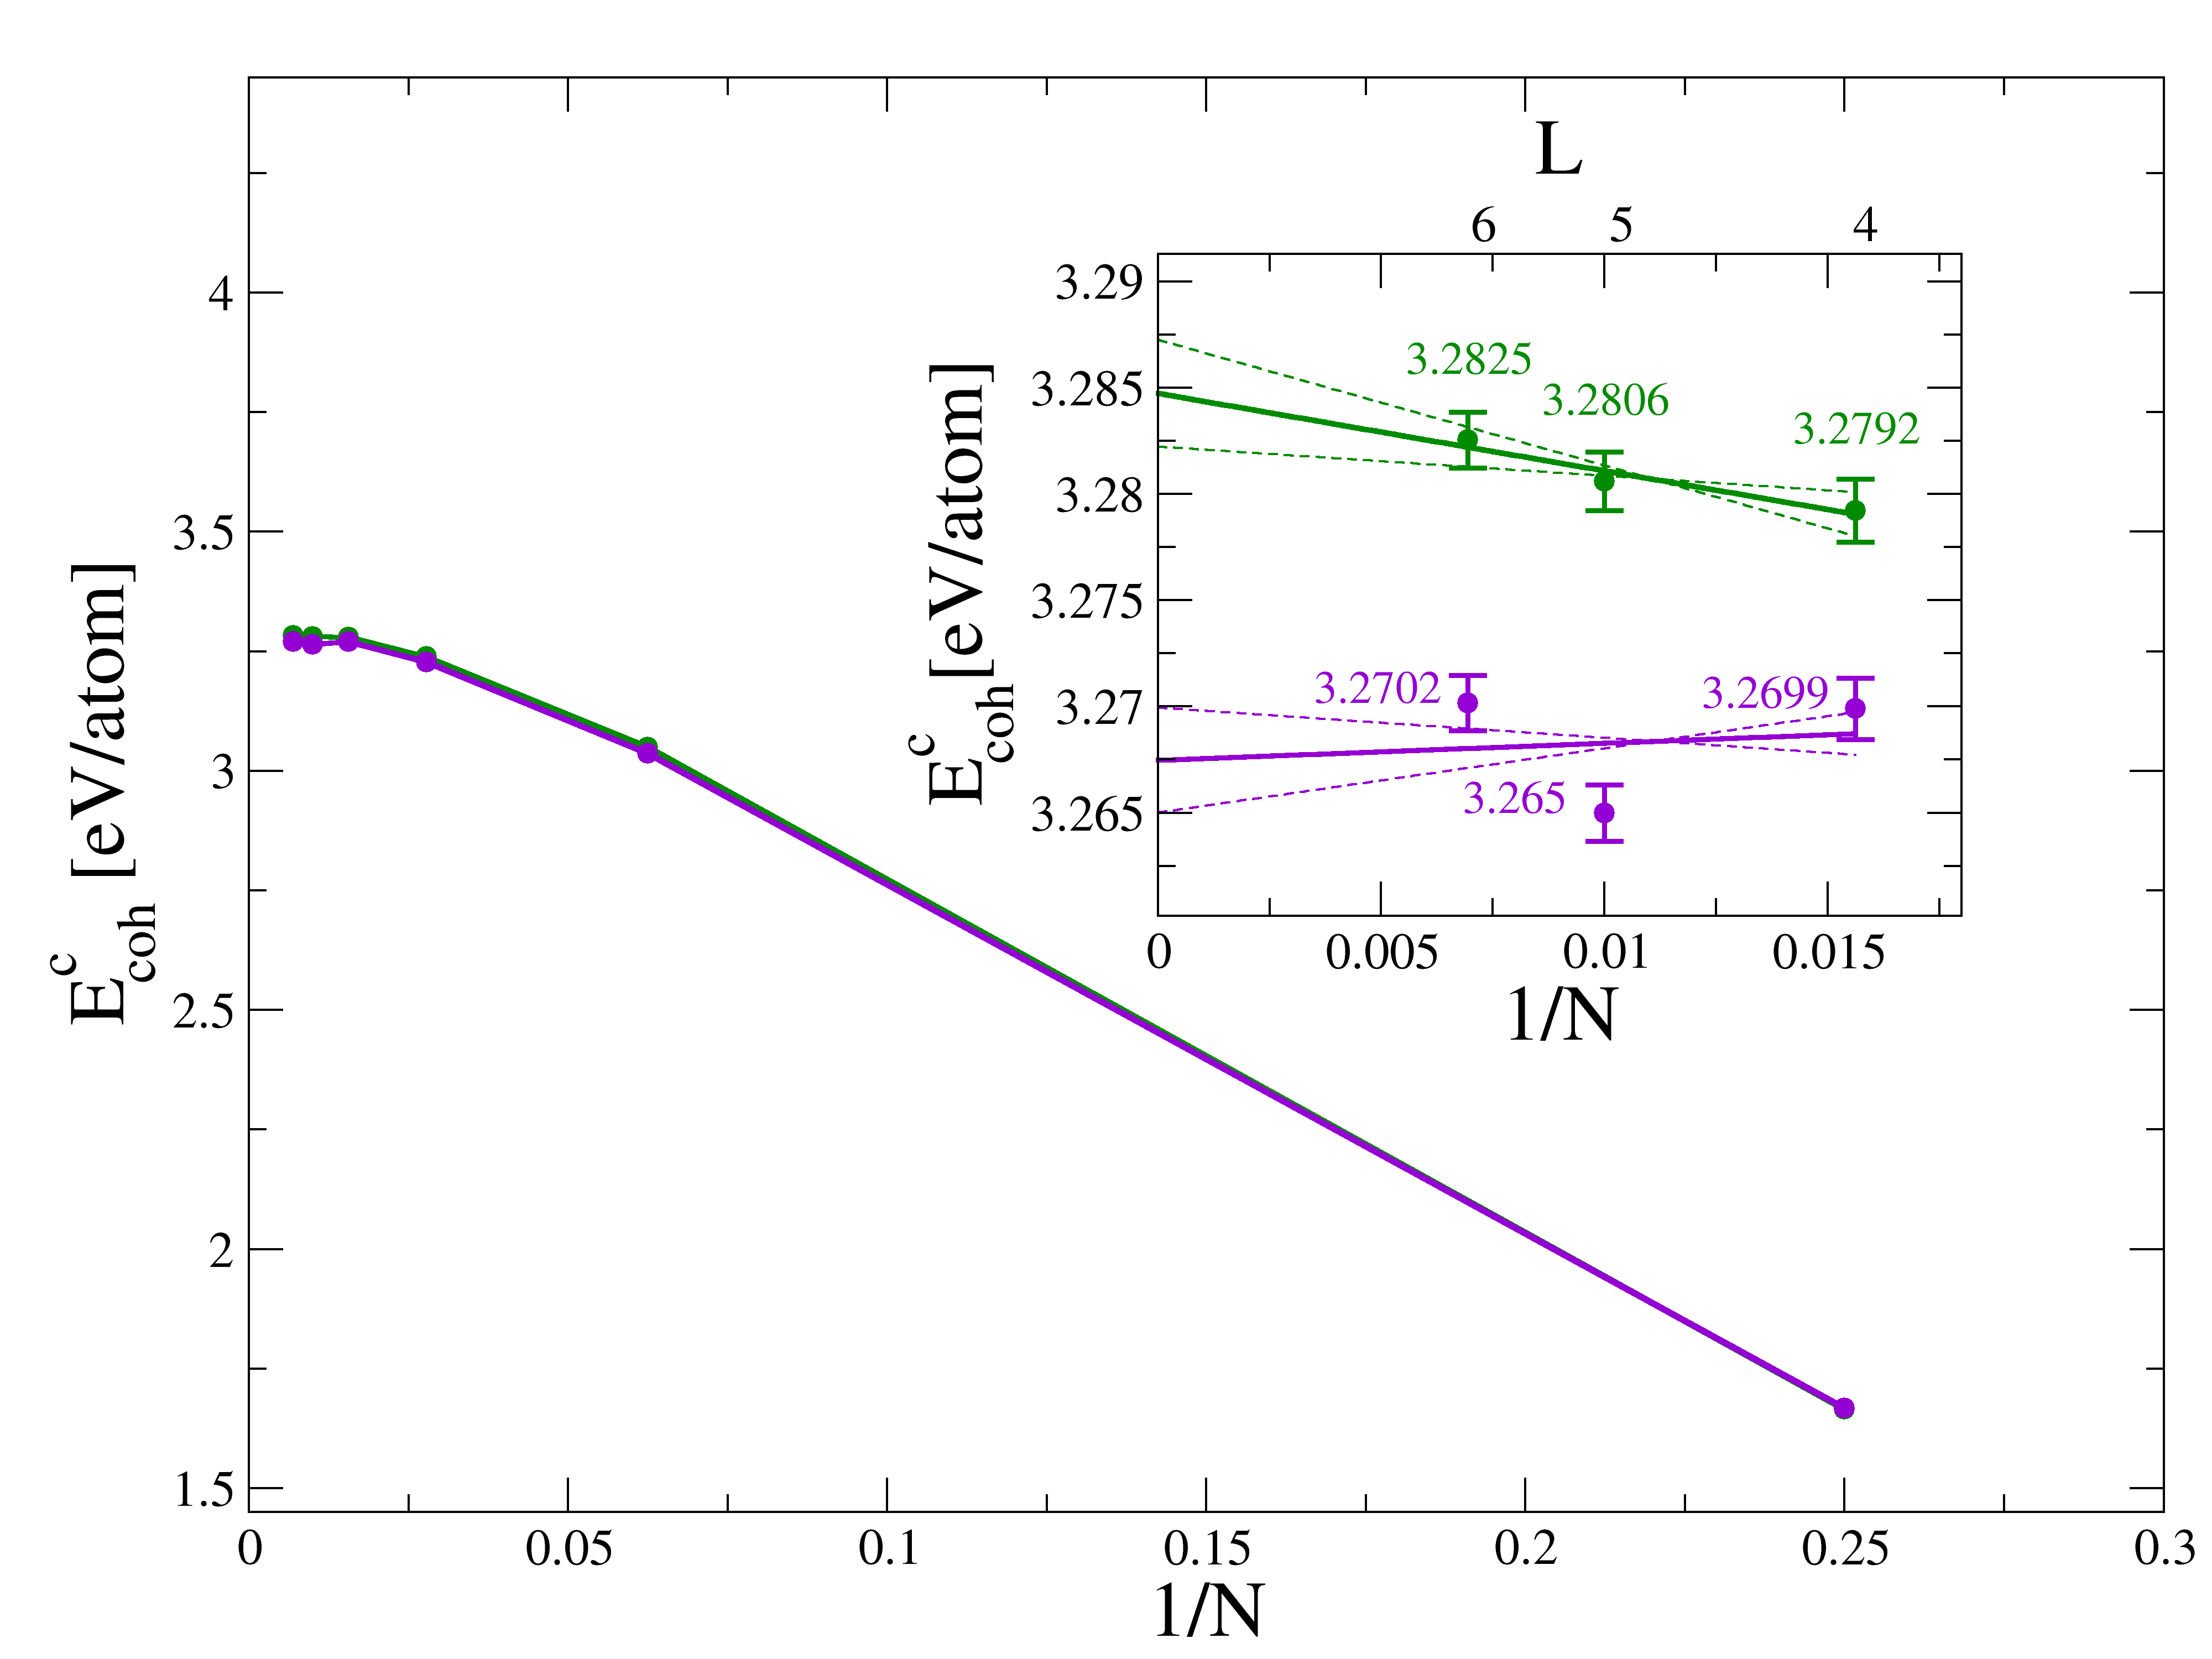
Cohesion energy.
One important quantity which, to the best of our knowledge, has not been determined experimentally yet, is the free-standing phosphorene cohesion energy. The cohesion energy of bulk black phosphorus is . 50 Compared to ordinary semiconducting 3D materials the phosphorus crystal is quite different being a van der Waals system of covalently bonded slabs. Even though the system shows moderately large cohesion, the stability of black phosphorus is rather low mainly due to an easy detachment of molecular units that per atom are bonded almost as strongly as the bulk material. Having calculated the phosphorene DMC ground state energies for a variety of sizes we can estimate the cohesion energy in the thermodynamic limit. Since the P4 molecule is the dominant sublimation product from phosphorus solids, to estimate the cohesion we follow the thermodynamic path P4 molecule bulk black phosphorus phosphorene using also the QMC calculation of the van der Waals binding energy estimated recently. 28 The finite-size scaling, Fig. 3, yields a fixed-node corrected cohesion energy of 3.268(4) in DMC/PBE and 3.284(6) eV/atom in the DMC/B3LYP periodic calculations, while from the clusters the estimated value is 3.26(1) eV/atom, see the SM for more details. Note that our estimated DMC values of cohesion energy of phosphorene from the two models are almost identical and very close to the estimation of 3.35 eV/atom for the 2D system obtained by using the van der Waals interlayer bonding from another DMC calculation.28 The corresponding DFT values are 3.09 eV/atom 51 and 3.45 eV/atom. 52
IV Conclusion and perspectives
We have performed systematic fixed-node QMC calculations of the quasiparticle band gap of free-standing single-layer phosphorene in both periodic and cluster settings. Using the universal linear scaling between the gap and the optical binding energy, we have also extracted the optical gap, which can be compared with experiments done on phosphorene on dielectric substrates or on encapsulated samples. Our results are consistent with available optical absorption and photoluminescence emission spectroscopy experiments. We argue that previous calculations based on GW underestimate the quasiparticle gap and do not give consistent predictions for phosphorene. Our ground state is essentially exact, evidenced from the calculated cohesion and its agreement with available (indirect) experimental data.
Our calculated quantities, band gap and cohesion, are key inputs into more qualitative and approximate theories, such as tight-binding and kp, as well as into experimental interpretations. In particular, there is a clear path how our results can be modified to accommodate dielectric environments which enter the experiments, leaving the core of our QMC results unchanged. This can be done by Bethe-Salpeter modeling or by use of model dielectric screening 34 to find the appropriate value of the exciton binding energy. Hence, our explicitly many-body QMC results provide a reference ground for further studies on phosphorene based on strain and layer engineering as well as chemical doping and structural defects and indeed in any other 2D material. We have also demonstrated that these cutting-edge calculations are now feasible for a range of 2D systems and we expect the QMC methods to find a place at the top of the list of the toolkit for studying 2D systems. This is underscored by the fact that the scatter of predicted values for electronic parameters is significant not only in phosphorene, but in other 2D materials as well. 53; 34; 36
Acknowledgements.
R.D., K.T., and I.S. were supported by APVV-15-0759, VEGA-2/0162/15 and VEGA-2/0123/18 projects. Contributions by L.M. have been supported by the NSF grant DMR-1410639 and by XSEDE computer time allocation at TACC. T.F. was supported by GRK Grant No. 1570, and the International Doctorate Program Topological Insulators of the Elite Network of Bavaria. J. F. acknowledges funding from the European Union’s Horizon 2020 research and innovation program under grant agreement No. 696656, and DFG SFB 1277 (B07). Total estimated amount of computation time is in excess of 30 million core hours on current architecture. T. F. and J. F acknowledge the Gauss Centre for Supercomputing (www.gauss-centre.eu) for funding this project by providing computing time on the GCS Supercomputer SuperMUC at Leibniz Supercomputing Centre (LRZ, www.lrz.de). R.D., K.T., and I.S. acknowledge that the results of this research have been obtained using the DECI resources Beskow at the PDC Center for High Performance Computing at the KTH Royal Institute of Technology, Stockholm, Sweden from the PRACE project NaM2D and Sisu based in Finland at CSC IT Center for Science with support from the PRACE DoCSiNaP project. We also gratefully acknowledge use of the Hitachi SR16000/M1 supercomputer system at CCMS/IMR, Tohoku University, Japan. We also acknowledge useful discussions with Martin Gmitra and Alexey Chernikov.References
- Li et al. (2014) L. Li, Y. Yu, G. J. Ye, Q. Ge., X. Ou., H. Wu, D. Feng, X. H. Chen., and Y. Zhang, Nat. Nanotechnol. 9, 372 (2014).
- Liu et al. (2014) H. Liu, A. T. Neal, Z. Zhou, Z. Luo, X. Xu, D. Tomanek, and P. D. Ye, ACS Nano 8, 4033 (2014).
- Novoselov et al. (2004) K. Novoselov, A. Geim, S. Morozov, D. Jiang, Y. Zhang, S. Dubonos, I. Grigorieva, and A. Firsov, Science 306, 666 (2004).
- Hunt et al. (2013) B. Hunt, J. D. Sanchez-Yamagishi, A. F. Young, M. Yankowitz, B. J. LeRoy, K. Watanabe, T. Taniguchi, P. Moon, M. Koshino, P. Jarillo-Herrero, and R. Ashoori, Science 340, 1427 (2013).
- Mak et al. (2010) K. F. Mak, C. Lee, J. Hone, J. Shan, and T. F. Heinz, Phys. Rev. Lett. 105, 136805 (2010).
- Watanabe et al. (2004) K. Watanabe, T. Taniguchi, and K. Hisao, Nat. Mat. 3, 404 (2004).
- Han et al. (2014) W. Han, R. Kawakami, M. Gmitra, and J. Fabian, Nat. Nanotechnol. 9, 794 (2014).
- Duan et al. (2014) H. Duan, N. Yan, R. Yu, C.-R. Chang, G. Zhou, H.-S. Hu, H. Rong, Z. Niu, and J. Mao, Nat. Commun. 5, 3093 (2014).
- Ling et al. (2015) X. Ling, H. Wang, S. Huang, F. Xia, and M. S. Dresselhaus, Proc. Natl. Acad. Sci. USA 112, 4523 (2015).
- Castellanos-Gomez (2015) A. Castellanos-Gomez, J. Phys. Chem. Lett. 6, 4280 (2015).
- Cudazzo et al. (2016) P. Cudazzo, L. Sponza, C. Giorgetti, L. Reining, F. Sottile, and M. Gatti, Phys. Rev. Lett. 116, 066803 (2016).
- Perdew et al. (1996) J. P. Perdew, K. Burke, and M. Ernzerhof, Phys. Rev. Lett. 77, 3865 (1996).
- Stephens et al. (1994) P. J. Stephens, F. J. Delvin, C. F. Chabalowski, and M. J. Frisch, J. Phys. Chem. 98, 11623 (1994).
- Jiang et al. (2017) Z. Jiang, Z. Liu, Y. Li, and W. Duan, Phys. Rev. Lett. 118, 266401 (2017).
- Cai et al. (2014) Y. Cai, G. Zhang, and Y. W. Zhang, Sci. Rep. 4, 6677 (2014).
- Liang et al. (2014) L. Liang, J. Wang, W. Lin, B. G. Sumpter, V. Meunier, and M. Pan, Nano Lett. 14, 6400 (2014).
- Wang et al. (2015a) V. Wang, Y. Kawazoe, and W. T. Geng, Phys. Rev. B 91, 045433 (2015a).
- Choi et al. (2015) J. H. Choi, P. Cui, H. Lan, and Z. Zhang, Phys. Rev. Lett. 115, 066403 (2015).
- Rasmussen et al. (2016) F. A. Rasmussen, P. S. Schmidt, K. T. Winther, and K. S. Thygesen, Phys. Rev. B 94, 155406 (2016).
- Tran et al. (2014) V. Tran, R. Soklaski, Y. Liang, and L. Yang, Phys. Rev. B 89, 235319 (2014).
- Rudenko and Katsnelson (2014) A. N. Rudenko and M. I. Katsnelson, Phys. Rev. B 89, 201408(R) (2014).
- Ferreira and Ribeiro (2017) F. Ferreira and R. M. Ribeiro, Phys. Rev. B 96, 115431 (2017).
- Wang et al. (2015b) X. Wang, A. Jones, K. Seyler, V. Tran, Y. Jia, H. Zhao, H. Wang, L. Yang, X. Xu, and F. Xia, Nat. Nanotechnol. 10, 517 (2015b).
- Surrente et al. (2016) A. Surrente, A. A. Mitioglu, K. Galkowski, W. Tabis, D. K. Maude, and P. Plochocka, Phys. Rev. B 93, 121405(R) (2016).
- Zhang et al. (2016) G. Zhang, S. Huang, A. Chaves, C. Song, O. Özçelik, T. Low, and H. Yan, Nat. Commun. 8, 14071 (2016).
- Li et al. (2017) L. Li, J. Kim, C. Jin, G. J. Ye, D. Y. Qiu, F. H. da Jornada, Z. Shi, L. Chen, Z. Zhang, F. Yang, K. Watanabe, T. Taniguchi, W. Ren, S. G. Louie, X. H. Chen, Y. Zhang, and F. Wang, Nat. Nanotechnol. 12, 21 (2017).
- Xia et al. (2014) F. Xia, H. Wang., and Y. Jia, Nat. Commun. 5, 4458 (2014).
- Shulenburger et al. (2015) L. Shulenburger, A. D. Baczewski, Z. Zhu, J. Guan, and D. Tománek, Nano Lett. 15, 8170 (2015).
- Roldán et al. (2015) R. Roldán, A. Castellanos-Gomez, E. Capelluti, and F. Guinea, F. Guinea, J. Phys.: Condens. Matter 27, 313201 (2015).
- Tokár et al. (2016) K. Tokár, R. Derian, J. Brndiar, and I. Štich, J. Apl. Phys. 120, 194305 (2016).
- Xiao et al. (2017) J. Xiao, M. Zhao, Y. Wang, and X. Zhang, Nanophotonics 6, 1309 (2017).
- Latini et al. (2015) S. Latini, T. Olsen, and K. S. Thygesen, Phys. Rev. B 92, 245123 (2015).
- Stier et al. (2016) A. V. Stier, N. P. Wilson, G. Clark, X. Xu, and S. A. Crooker, Nano Lett. 16, 7054 (2016).
- Trolle et al. (2017) M. L. Trolle, T. G. Thomas G. Pedersen, and V. Véniard, Sci Rep. 7, 39844 (2017).
- Raja et al. (2017) A. Raja, A. Chaves, J. Yu, G. Arefe, H. M. Hill, A. F. Rigosi, T. C. Berkelbach, P. Nagler, C. Schüller, T. Korn, C. Nuckolls, J. Hone, L. E. Brus, T. F. Heinz, D. R. Reichman, and A. Chernikov, Nature Commun. 8, 15251 (2017).
- Cho and Berkelbach (2018) Y. Cho and T. C. Berkelbach, Phys. Rev. B. 97, 041409(R) (2018).
- Wang et al. (2015c) C. Wang, Q. Xia, Y. Nie, and G. Guob, J. Appl. Phys. 117, 124302 (2015c).
- Foulkes et al. (2001) W. M. C. Foulkes, L. Mitas, R. J. Needs, and G. Rajagopal, Rev. Mod. Phys. 73, 33 (2001).
- Needs et al. (2010) R. J. Needs, M. D. Towler, N. D. Drummond, and P. López Ríos, J. Phys.: Condens. Matter 22, 023201 (2010).
- Kolorenč and Mitas (2011) J. Kolorenč and L. Mitas, Rep. Prog. Phys. 74, 026502 (2011).
- Wagner and Ceperley (2016) L. K. Wagner and D. M. Ceperley, Rep. Prog. Phys. 79, 094501 (2016).
- Dubecky et al. (2016) M. Dubecky, L. Mitas, and P. Jurecka, Chem. Rev. 116, 5188 (2016).
- Horváthová et al. (2012) L. Horváthová, M. Dubecký, L. Mitas, and I. Štich, Phys. Rev. Lett. 109, 053001 (2012).
- Derian et al. (2017) R. Derian, K. Tokár, B. Somogyi, Á. Gali, and I. Štich, J. Chem. Theory Comput. 13, 6061 (2017).
- Mostaani et al. (2015) E. Mostaani, N. D. Drummond, and V. I. Faĺko, Phys. Rev. Lett. 115, 115501 (2015).
- Li and Appelbaum (2014) P. Li and I. Appelbaum, Phys. Rev. B 90, 115439 (2014).
- Yeh and Berkowitz (1999) I.-C. Yeh and M. L. Berkowitz, J. Chem. Phys. 111, 3155 (1999).
- Wood et al. (2004) B. Wood, W. M. C. Foulkes, M. D. Towler, and N. D. Drummond, J. Phys.: Condens. Matter 16, 891 (2004).
-
Drummond et al. (2013)
N. D. Drummond, V. Zólyomi, and V. I. Faľko, Electronic Structure
of Two-Dimensional Crystals of Hexagonal Boron Nitride (TTI, QMC in the Apuan Alps VIII, Vallico
Sotto, Tuscany, Italy, 2013) http://www.tcm.phy.cam.ac.uk/~mdt26/
tti_talks/qmcitaa_13/drummond_tti2013.pdf. - Kittel (2005) C. Kittel, Introduction to Solid State Physics, 8th ed. (John Wiley & Sons, Inc., NJ, 2005) p. 50.
- Ballone and Jones (1994) P. Ballone and R. O. Jones, J. Chem. Phys. 100, 4941 (1994).
- Chen and Jeng (2016) P.-J. Chen and H.-T. Jeng, Sci. Rep. 6, 23151 (2016).
- Ryou et al. (2016) J. Ryou, Y.-S. Kim, K. C. Santosh, and K. Cho, Sci. Rep. 6, 29184 (2016).