Duluth UROP at SemEval-2018 Task 2: Multilingual Emoji Prediction with Ensemble Learning and Oversampling
Abstract
This paper describes the Duluth UROP systems that participated in SemEval–2018 Task 2, Multilingual Emoji Prediction. We relied on a variety of ensembles made up of classifiers using Naive Bayes, Logistic Regression, and Random Forests. We used unigram and bigram features and tried to offset the skewness of the data through the use of oversampling. Our task evaluation results place us 19th of 48 systems in the English evaluation, and 5th of 21 in the Spanish. After the evaluation we realized that some simple changes to preprocessing could significantly improve our results. After making these changes we attained results that would have placed us sixth in the English evaluation, and second in the Spanish.
1 Introduction
Emoji prediction of tweets is an emerging problem Barbieri et al. (2017) which combines the nuances of sentiment analysis with the noisy data characteristic of social media. SemEval–2018 Task 2 Barbieri et al. (2018) adds to this the challenge of multilingual processing, where both Spanish and English tweets are used.
Given the relatively large amount of training data available for the task (see Section 2) we decided to approach this as a classification task, where we used relatively simple unigram and bigram features in combination with standard machine learning algorithms. We particularly focused on the use of Multinomial Naive Bayes, Logistic Regression, and Random Forests, all of which were provided to us via the scikit learn package Pedregosa et al. (2011). Given the challenging nature of this task we decided to employ a variety of ensemble approaches, since no single classifier seemed likely to perform well in all cases.
In the sections that follow we summarize the experimental data used in the task, and then describe the methods we employed for supervised learning, ensemble building, and oversampling. We close by interpreting and discussing our results.
2 Experimental Data
The task organizers created both training and test data made up of Spanish and English tweets (separately). The training data consists of 100,000 Spanish tweets and 500,000 English tweets. The test data is made up of 10,000 Spanish tweets and 50,000 English tweets. Each instance consists of a single tweet, where 19 different emojis were observed in the Spanish data, and 20 emojis were observed in the English.
We collected the training tweets via the Twitter API on November 10–11, 2017. By that time some of the tweets selected by the organizers had been deleted or made private, but we were still able to download the vast majority of training tweets. For English we downloaded 490,272 tweets, so 9,628 were unavailable. For Spanish we obtained 98,657 tweets, so 1,343 were unavailable.
One of the most striking aspects of this data for
both English and Spanish is that the number of
classes (emojis) is relatively large (20 and 19
respectively), and that the distribution of these
classes is skewed. In the English training data
the most common emoji is ![]() which
occurs 21.7% of the time. The next most frequent
emoji is
which
occurs 21.7% of the time. The next most frequent
emoji is ![]() which occurs 10.5% of the time. The two emojis
were also the most frequent in the Spanish data,
occurring 19.9% and 13.7% of the time. By contrast
16 of the emojis occurred less than 5% of the time
in English, and 14 occurred less than 5% in the
Spanish.
which occurs 10.5% of the time. The two emojis
were also the most frequent in the Spanish data,
occurring 19.9% and 13.7% of the time. By contrast
16 of the emojis occurred less than 5% of the time
in English, and 14 occurred less than 5% in the
Spanish.
The evaluation measure used to rank systems in this task is the F–measure, which rewards systems that are able to predict instances in the low frequency classes correctly. Given that we decided to employ oversampling in order to try to improve our results on the low frequency classes which had the negative effect of degrading our performance on the more frequent classes.
3 System Description
3.1 Preprocessing
First, the text is normalized to lowercase. In preliminary experiments, we find that removing all punctuations reduces performance, thus we decided to only remove commas. In our task evaluation experiments we removed all non-ASCII characters, but then post–evaluation decided to keep most of them. Then, we tokenize the tweets with NLTK word tokenizer and identify unigrams and bigrams as potential features. To reduce noise, a document frequency cutoff of 5 is applied to sift out unigram and bigram features that occur in at least five tweets.
When applied to the English data, this process results in 166,681 features, including 35,197 unigrams and 131,484 bigrams. The Spanish data is made up of 40,420 features, including 12,356 unigrams and 28,061 bigrams. For text representation, we adopt the bag-of-words model. Each tweet is converted to a vector based on n-grams by Count Vectorizer.
3.2 Oversampling
Faced with the skewness of both the English and Spanish tweets, we introduce oversampling to adjust the class distribution to reduce bias. We use Synthetic Minority Oversampling Technique (SMOTE), where the minority classes are oversampled by creating synthetic examples using k nearest neighbors. We use imblearn in scikit-learn library for oversampling.
In our case, all classes are resampled to have equal number with the majority
class ![]() . As a result, the resampled Spanish data has a
size of 373,825, with class size of 19,675, and English has a size of 2,130,180, with
class size of 106,509.
. As a result, the resampled Spanish data has a
size of 373,825, with class size of 19,675, and English has a size of 2,130,180, with
class size of 106,509.
3.3 Base Classifier
We use scikit-learn library for the base classifiers and the first-level ensemble classifier below. And the second-level ensemble is constructed with mlxtend library, which is compatible with scikit-learn.
3.3.1 Multinomial Naive Bayes (MNB):
MNB is a probabilistic classifier based on integer feature counts. It is simple yet powerful for text classification, especially for short documents Wang and Manning (2012). To eliminate zero counts, we use additive smoothing with a parameter value of 0.5.
3.3.2 Logistic Regression (LR):
While NB assumes strong conditional independence, LR is more robust to correlated features. We use a LR with L2 regularization to reduce overfitting. It uses the one-vs-rest (OvR) scheme for multiclass classification.
3.3.3 Random Forest (RF):
As an enhancement of decision tree, we use the RF classifier, which ensembles a multitude of decision trees. By fitting on sub-samples of the dataset, RF improves accuracy and reduces overfitting by averaging. We use 20 trees here.
3.4 Ensemble Classifier
We build an ensemble classifier to combine the strengths of a collection of base models. The ensemble method is soft voting, where the calibrated member classifiers cast weighted votes for classes based on predicted probabilities. The ensemble is also a calibrated classifier, who can either predict associated probabilities based on weighted sum, or a class with maximum probability.
| (1) |
| (2) |
Our ensemble has two levels. On the base level, we include a diverse collection of heterogeneous classifiers: MNB, LR, RF, with weights (1.1,1,1) for Spanish and (1.5,6,1) for English.
On the second level, we train the base ensemble respectively on the original task data (Ensemble1) and oversampled data (Ensemble2). On the one hand, oversampling can adjust class distribution so that rare classes are well represented. On the other hand, it may exacerbate overfitting problem in the context of noisy data, and consequently harms accuracy. To seek a balance, we devise a meta-ensemble classifier (Meta) including both Ensemble1 and Ensemble2, with weights (3,1) for Spanish and (4,1) for English.
The weights for the ensembles were set in a non-systematic fashion via trial and error. In future work, we would like to arrive at these weights in a more rigorous fashion.
3.5 Evaluation Metric
For individual classes, score is calculated as:
The overall classification performance of the system is measured by macro-averaged score:
where k is total number of classes.
4 Results and Discussion
4.1 Task Evaluation
For task evaluation, our two submitted systems are: Ensemble1 and Meta. The official results are shown for English in Table 1 and Spanish in Table 2. Our overall F-score was competitive in both the English (19th of 48) and Spanish tasks (5th of 21).
| Method | F1 | P | R | Acc. |
|---|---|---|---|---|
| Ensemble1 | 26.37 | 28.10 | 27.41 | 34.43 |
| Meta | 26.59 | 27.18 | 27.87 | 33.80 |
| Method | F1 | P | R | Acc. |
|---|---|---|---|---|
| Ensemble1 | 16.59 | 18.03 | 17.84 | 29.67 |
| Meta | 16.75 | 17.11 | 18.10 | 28.51 |
4.2 Post Evaluation
In post-evaluation experiments, we revised the preprocessing by including most non-ASCII characters and modified the weights assigned for ensembles. As a result, the system performance improved greatly, which was largely attributed to the changes in preprocessing.
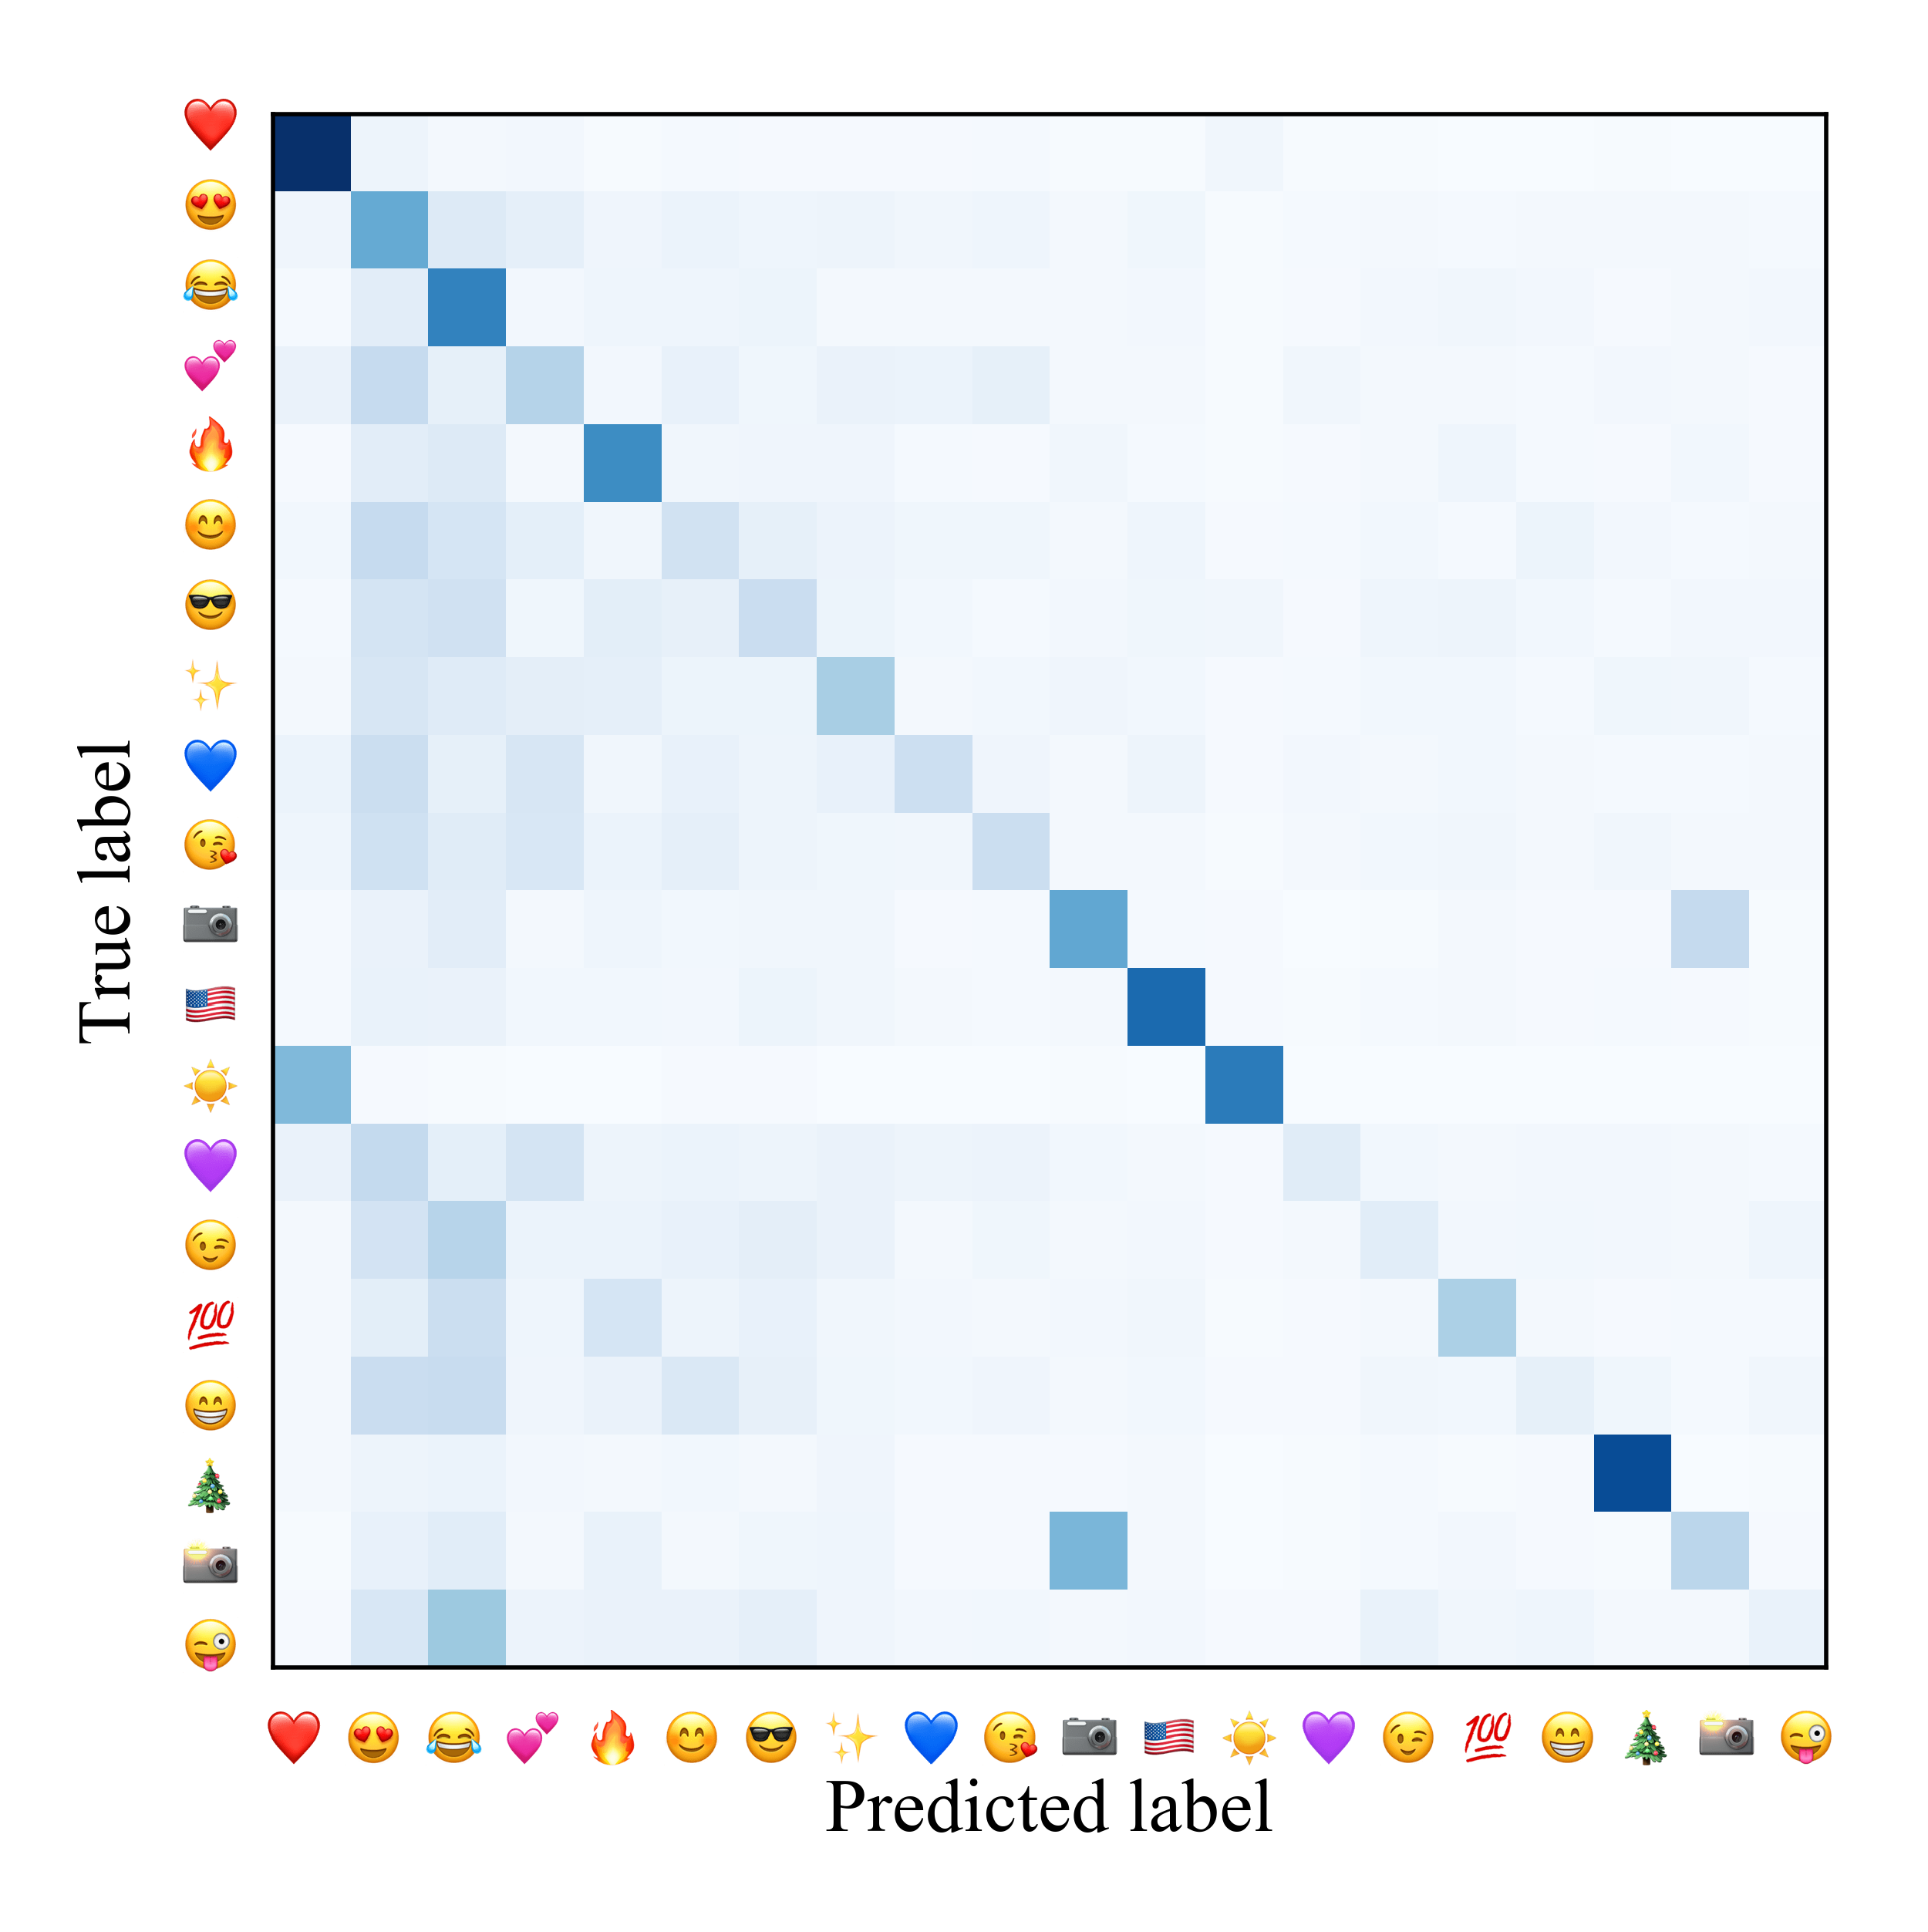
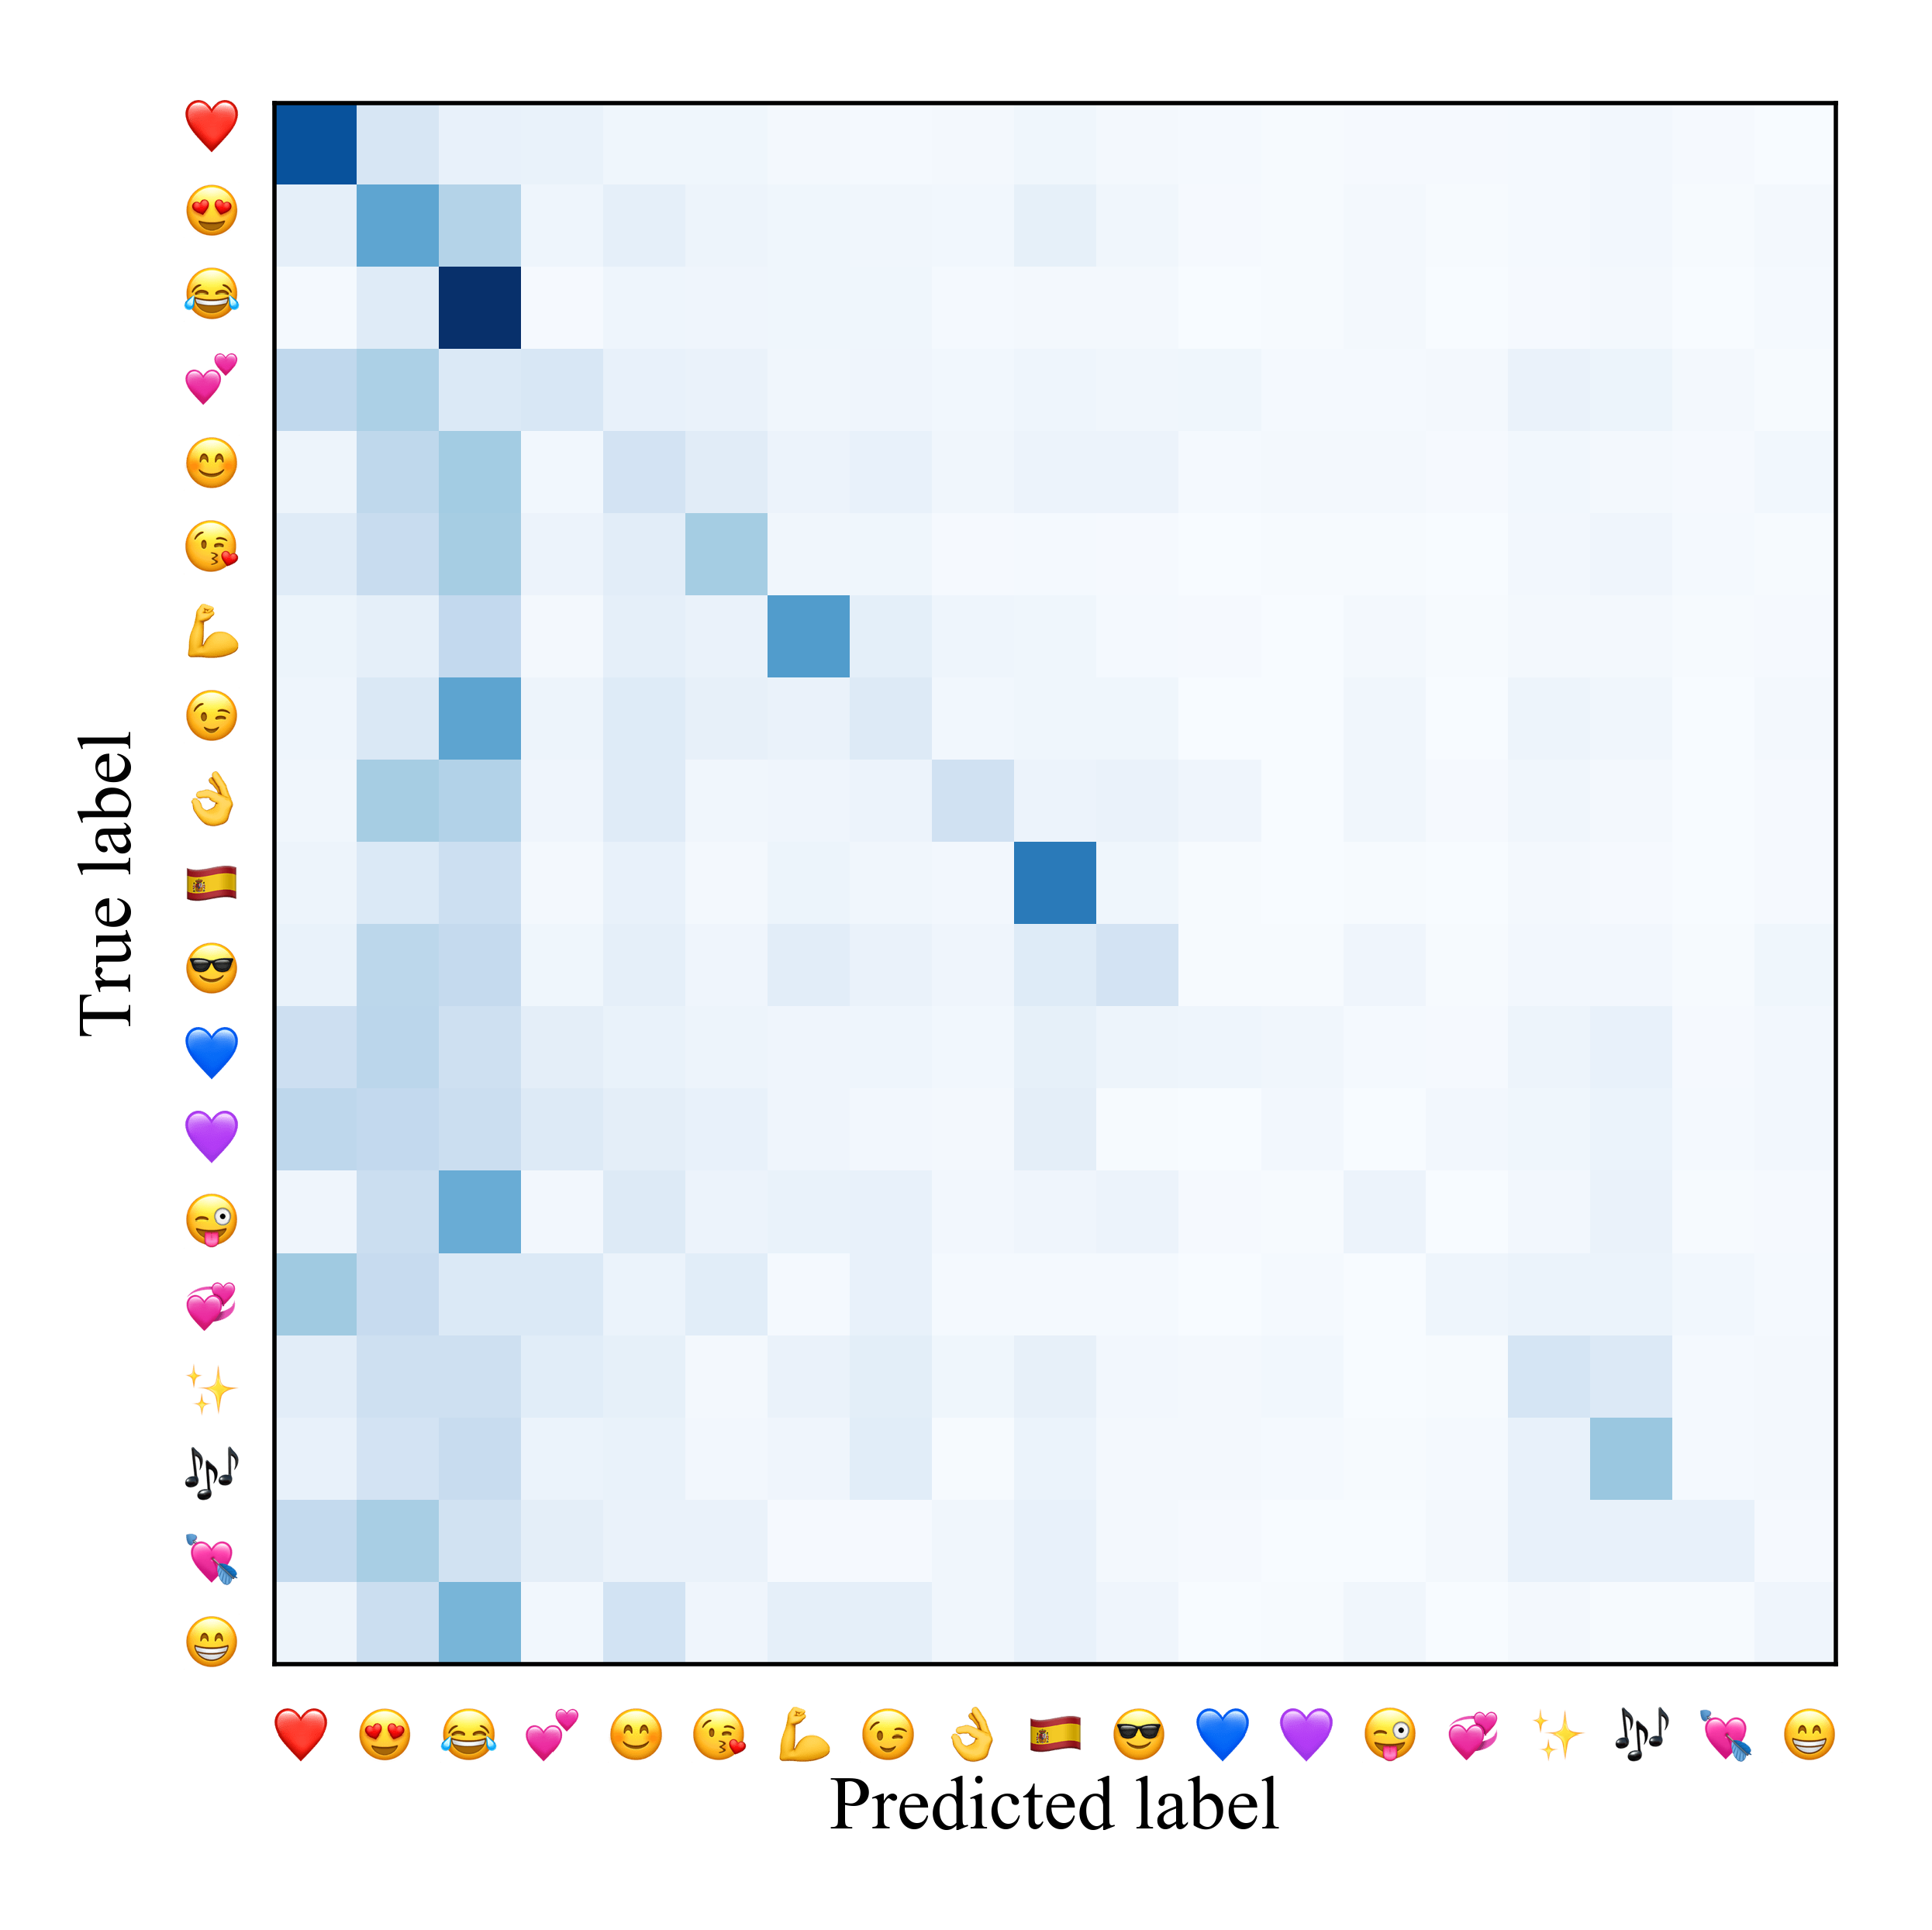
The system was trained on the whole training data, and tested with the official test data. We show post-evaluation results for English in Table 3 and for Spanish in Table 4. The confusion matrices of Meta classifier are shown in Figure 1 and Figure 2.
| Method | F1 | P | R | Acc. |
|---|---|---|---|---|
| MNB-P | 30.21 | 30.78 | 31.58 | 42.22 |
| LR-P | 32.73 | 35.05 | 32.08 | 44.79 |
| RF-P | 24.49 | 30.13 | 24.41 | 39.01 |
| Ensemble1-P | 33.03 | 34.68 | 33.09 | 45.68 |
| Ensemble2-P | 31.85 | 31.38 | 33.14 | 42.08 |
| Meta-P | 33.31 | 34.14 | 33.61 | 45.58 |
| Method | F1 | P | R | Acc. |
|---|---|---|---|---|
| MNB-P | 19.26 | 19.92 | 20.51 | 35.07 |
| LR-P | 18.43 | 20.98 | 18.28 | 35.23 |
| RF-P | 13.41 | 19.47 | 13.78 | 32.68 |
| Ensemble1-P | 19.58 | 21.13 | 20.51 | 37.05 |
| Ensemble2-P | 20.34 | 20.44 | 21.55 | 33.64 |
| Meta-P | 20.21 | 21.23 | 21.12 | 36.74 |
In the task evaluation we eliminated all non-ASCII characters during preprocessing. After the evaluation period we realized that this resulted in a significant loss of accuracy. We revised our preprocessing for our post-evaluation experiments and only removed the following non-ASCII characters (shown as Unicode value, description): (U+00B7, middle dot), (U+2019, right single quotation mark), (U+2018, left single quotation mark), (U+2022, bullet), (U+2026, horizontal ellipsis), and (U+30FB, katakana middle dot).
Preserving non-ASCIIs is important for both languages. Spanish using MNB has a F-score of 16.77 without non-ASCII and 19.08 when preserving all, and English has 25.47 without non-ASCII and 30.00 when including. While their importance for Spanish is apparent as accents are ubiquitous in Latin languages, their function for English is relatively vague. Nevertheless, they are clearly providing useful information in the tweets.
4.3 Discussion
In this section, we will discuss the results based on post-evaluation.
Ideally, we would hope an ensemble would outperform all of its components. Its performance counts on the accuracy and diversity of the members. While NB and LR are linear classifiers, RF is nonlinear. Also, the actual performance is sensitive to the assigned voting weights. Initially, we get a rough estimation based on individual performances, especially accuracy. For both English and Spanish, RF has a notable inferior score, so lower weight is expected. Then we manually perform experiments to find better weights. Due to the large size of data, it is computationally expensive to perform grid search. In the future, we would like to investigate if other automated methods could find optimal hyper-parameters more efficiently.
By fitting the ensemble with oversampled data, the overall accuracy drops. However, the rare classes originally with low F-scores gain an increase. This is desirable as we attempt to maximize the overall classification performance for all classes, which is measured by macro-averaged F. In considering the weights in Meta, we perceive Ensemble1 a more reliable source as it shows notably higher accuracy. Meta tends to outperform Ensemble1 in F-score.
It is worth mentioning that the baseline classifiers like MNB and LR have robust performance compared to other more complex systems. This suggest that improvement from ensembles may be limited for this challenging problem, and new perspectives are necessary.
Additionally, there are some interesting observations from the confusion matrices. For English tweets,
![]() is frequently misclassified as
is frequently misclassified as
![]() . And there is apparent confusion between
. And there is apparent confusion between
![]() and
and
![]() . For Spanish tweets,
. For Spanish tweets, ![]() has highest accuracy. Meanwhile, many other emojis are misclassified to this label, typical ones including
has highest accuracy. Meanwhile, many other emojis are misclassified to this label, typical ones including
![]() ,
,
![]() , and
, and
![]() .
.
Acknowledgments
The first author is grateful for the support of the Undergraduate Research Opportunity Program at the University of Minnesota.
References
- Barbieri et al. (2017) Francesco Barbieri, Miguel Ballesteros, and Horacio Saggion. 2017. Are emojis predictable? In Proceedings of the 15th Conference of the European Chapter of the Association for Computational Linguistics, EACL 2017, Valencia, Spain, April 3-7, 2017, Volume 2: Short Papers, pages 105–111.
- Barbieri et al. (2018) Francesco Barbieri, Jose Camacho-Collados, Francesco Ronzano, Luis Espinosa-Anke, Miguel Ballesteros, Valerio Basile, Viviana Patti, and Horacio Saggion. 2018. SemEval-2018 Task 2: Multilingual Emoji Prediction. In Proceedings of the 12th International Workshop on Semantic Evaluation (SemEval-2018), New Orleans, LA, United States. Association for Computational Linguistics.
- Pedregosa et al. (2011) F. Pedregosa, G. Varoquaux, A. Gramfort, V. Michel, B. Thirion, O. Grisel, M. Blondel, P. Prettenhofer, R. Weiss, V. Dubourg, J. Vanderplas, A. Passos, D. Cournapeau, M. Brucher, M. Perrot, and E. Duchesnay. 2011. Scikit-learn: Machine learning in Python. Journal of Machine Learning Research, 12:2825–2830.
- Wang and Manning (2012) Sida Wang and Christopher D. Manning. 2012. Baselines and bigrams: Simple, good sentiment and topic classification. In Proceedings of the 50th Annual Meeting of the Association for Computational Linguistics: Short Papers - Volume 2, ACL ’12, pages 90–94, Stroudsburg, PA, USA. Association for Computational Linguistics.